








 |
| Gold V.1.3.1 signal Telegram Channel (English) |
AUDUSD: Bulls Regain Control and Eye Key Resistance at 0.7140 as Technical Breakout Unfolds, August 10, 2026
2026-08-10 @ 06:01
Over the past 24 to 48 hours, the AUD/USD pair has remained relatively stable, closing yesterday at around 0.70635, up slightly by 0.46% from the previous day. Market volatility was limited, with the price fluctuating between 0.70621 and 0.70716, reflecting investor caution ahead of key data releases, especially the upcoming US Non-Farm Payrolls (NFP) report.
Recent market news indicates that the AUD/USD found support near the 38.2% Fibonacci retracement level, hovering near key mid-term moving averages. Traders appear optimistic yet cautious. Risk-on sentiment has bolstered the Australian dollar, driven by a weaker US dollar, yen intervention, and hopes of easing tensions in the Middle East. However, fluctuations in the dollar and concerns about US inflation and interest rates remain critical factors impacting price movements.
Put simply for the average investor, AUD/USD’s mild price movements reflect the market’s wait-and-see approach ahead of the US labor data. Given ongoing global political and economic uncertainties, investors should remain alert, but current risk appetite supports the Australian dollar sustaining its highest weekly close in seven weeks.
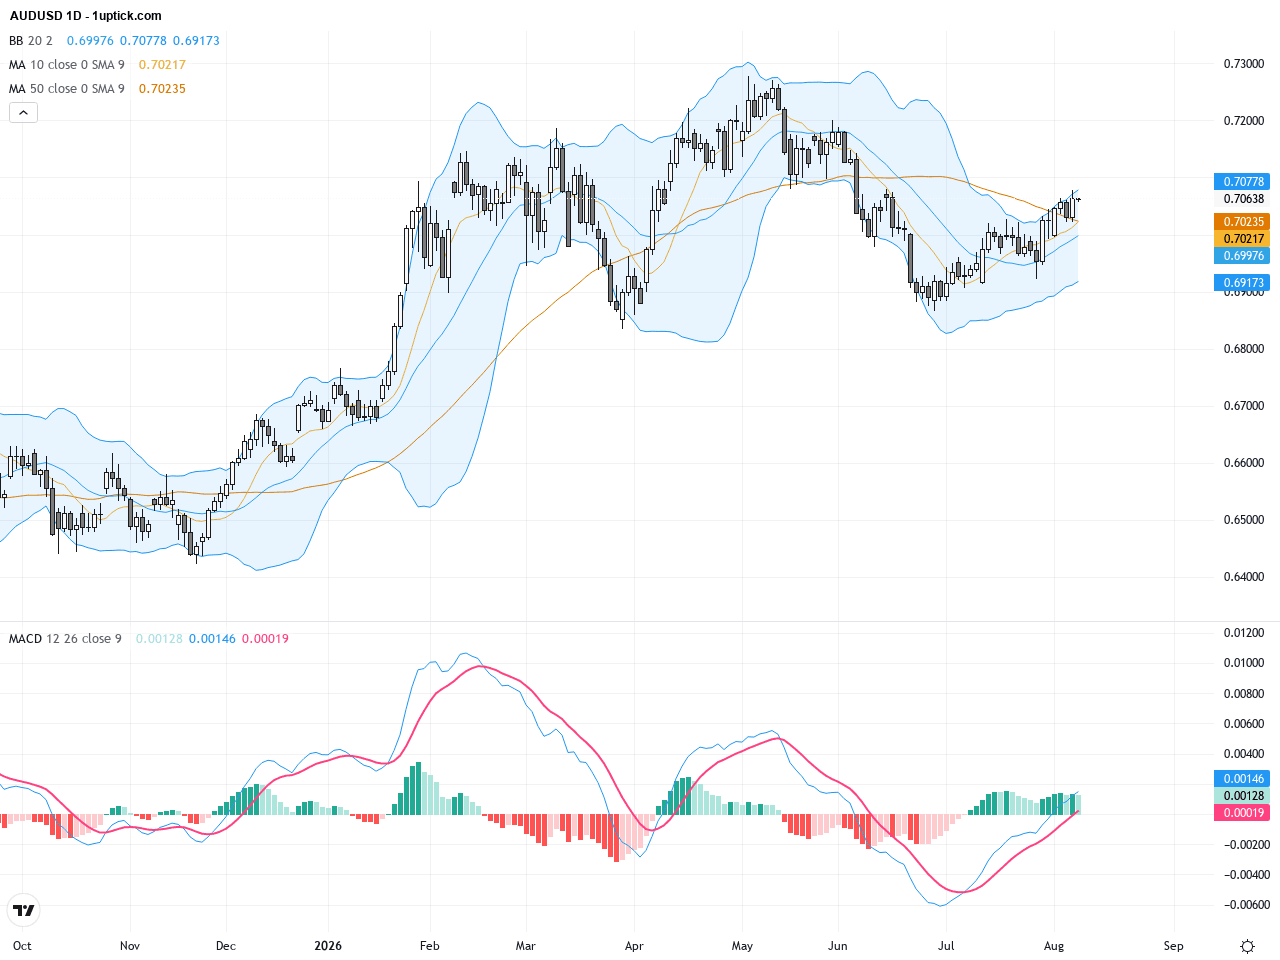
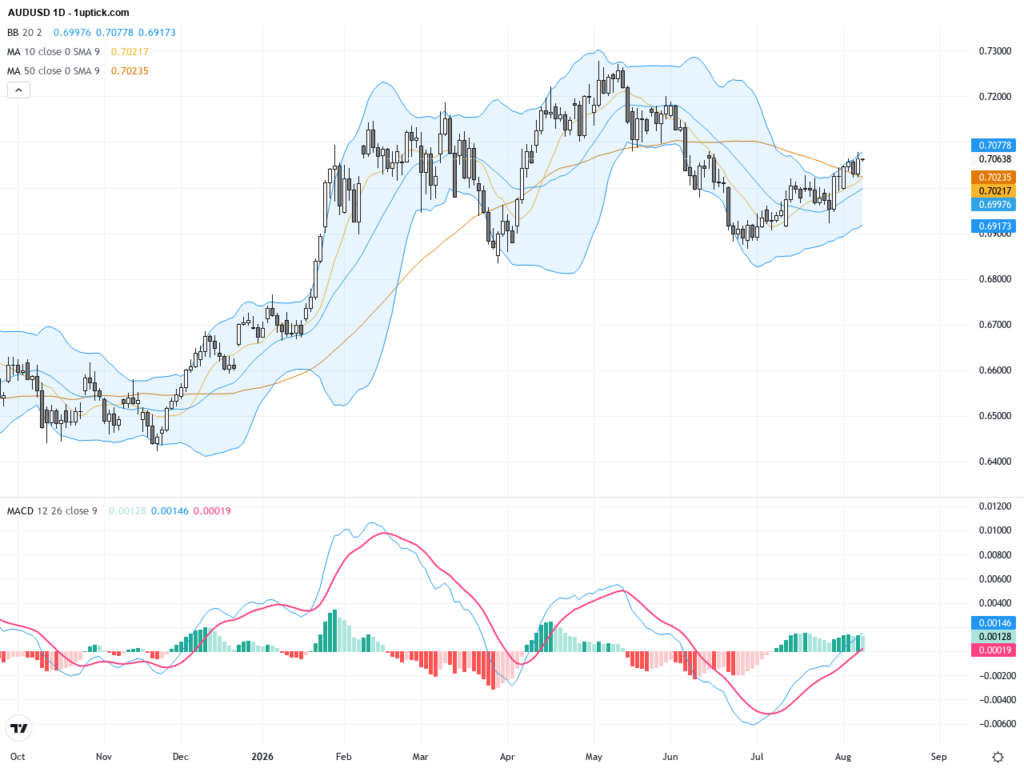
The daily chart shows AUDUSD climbing steadily from early August lows near 0.6865 towards the 0.7070 resistance area. The pair has broken above the major descending trendline, confirming a bullish shift. The 50-day moving average at around 0.6999 and the 200-day at 0.6912 provide solid support as price remains above both. Bollinger Bands have started to expand following a squeeze, indicating increased volatility. The MACD histogram is positive and growing, signaling rising bullish momentum. Overall, the daily trend favors higher prices with potential resistance approaching 0.7140.
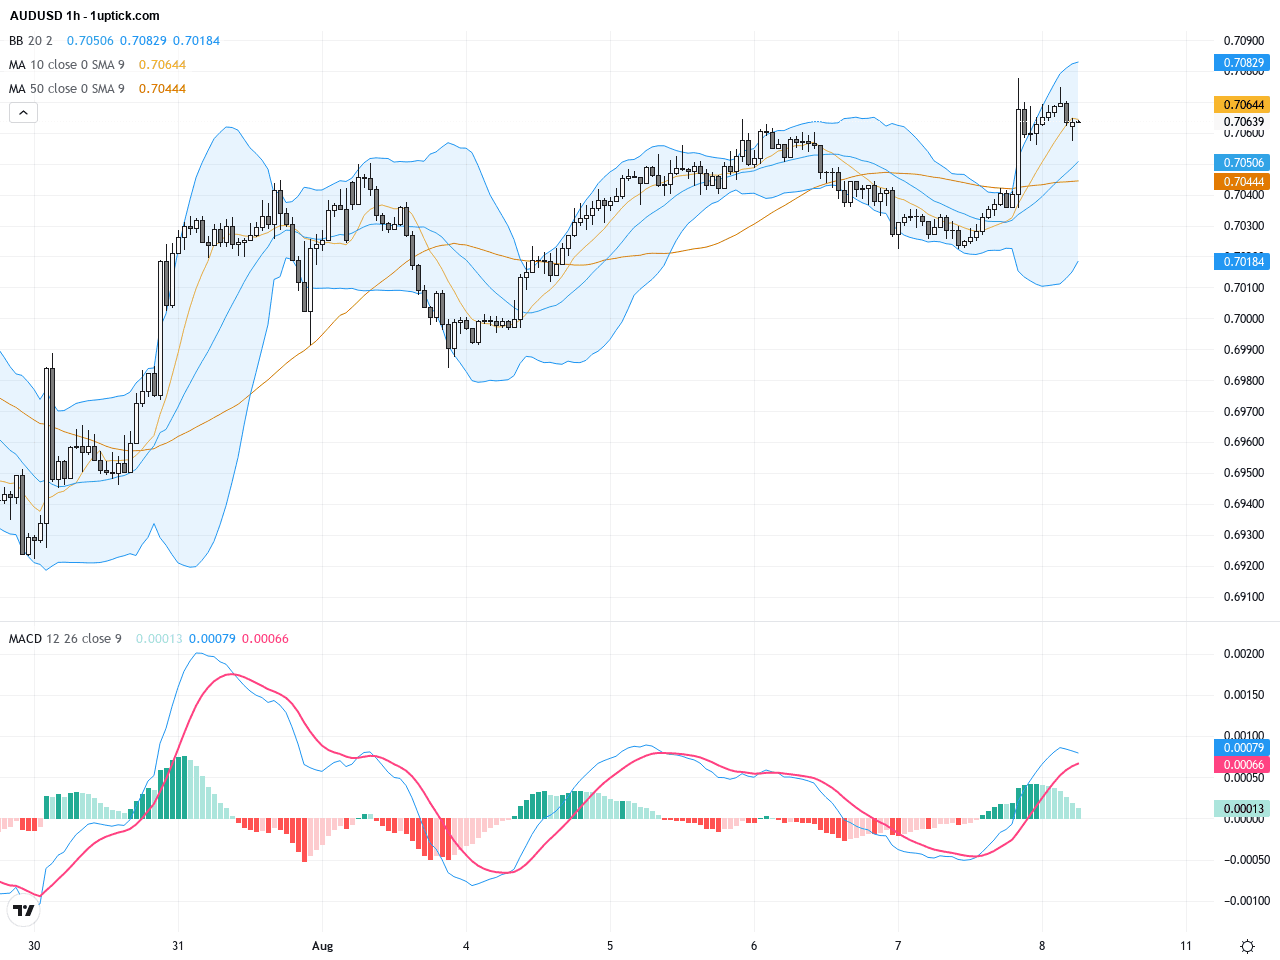
In the last 3-5 days on the hourly chart, AUDUSD shows a gradual upward trend with prices oscillating between 0.7050 and 0.7070. Bollinger Bands are widening, suggesting room for further moves. The MACD recently crossed bullishly and the RSI hovers near 60 without any overbought condition. A bullish flag pattern has formed recently, and a breakout above the flag’s upper boundary could trigger a strong short-term rally. The immediate focus is on a break above 0.7075 to confirm near-term upside continuation.
Technical Trend: Cautiously Bullish Trend
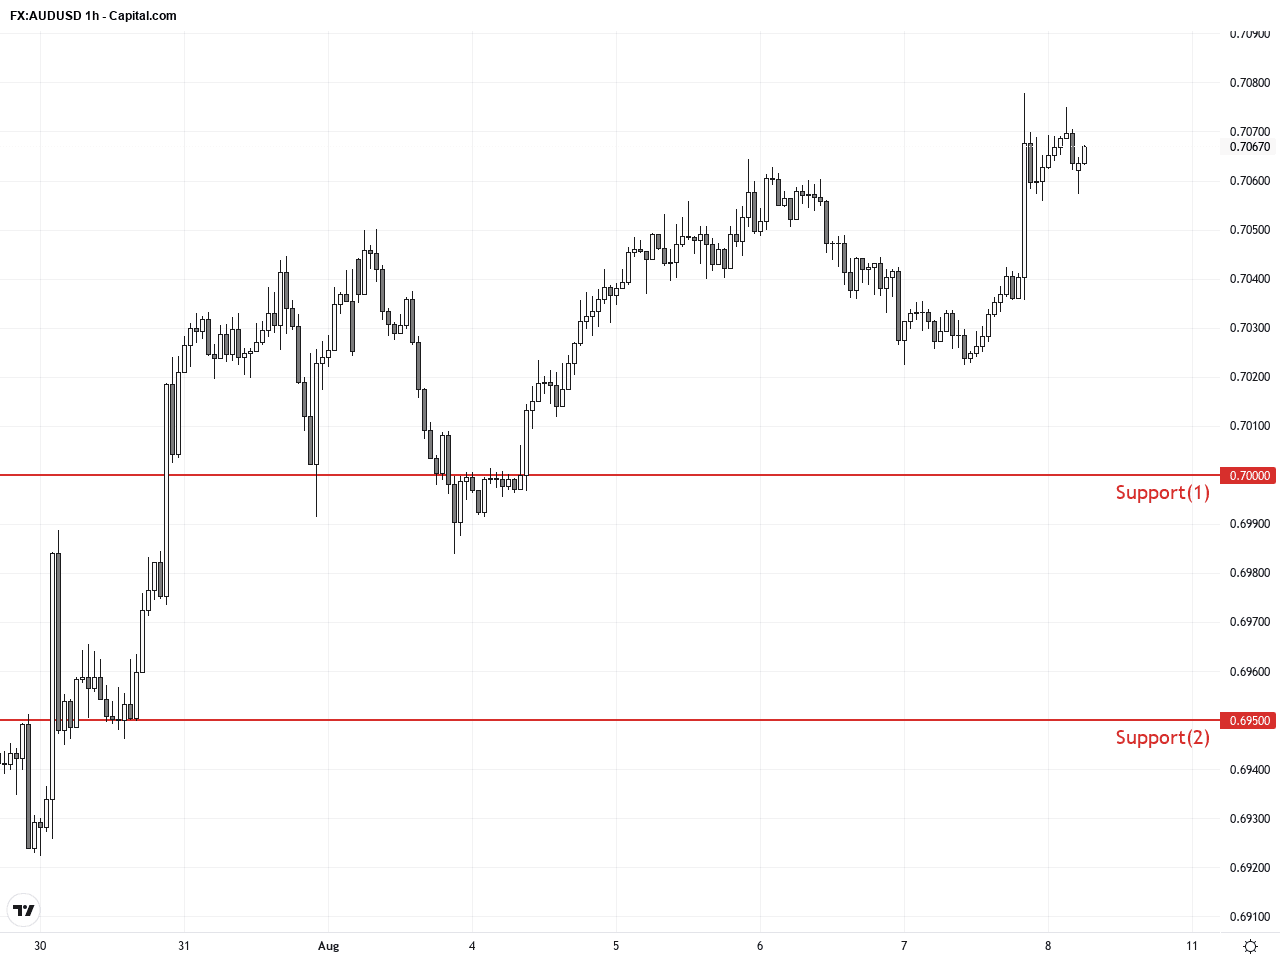
Technical analysis indicates bulls have reclaimed control by breaking above the key descending trendline on the daily chart, with closes sustained above critical support. The MACD crossover and expanding Bollinger Bands support ongoing buying interest. The bullish flag on the hourly chart reinforces positive momentum. Maintaining the 0.7000 psychological support and challenging 0.7140 resistance will be crucial. A breakout could extend the uptrend, while any pullback would likely be a healthy correction within a bullish scenario.Today’s economic events focus mostly on Asian and European data, with no major releases directly related to the Australian or US economies. China’s new loans and M2 money supply forecasts are expected weaker, which may exert mild pressure on regional currencies but have limited impact on AUDUSD. There are no significant US data events scheduled, so no direct market-moving releases for AUDUSD today.
Resistance & Support
The above financial market data, quotes, charts, statistics, exchange rates, news, research, analysis, buy or sell ratings, financial education, and other information are for reference only. Before making any trades based on this information, you should consult independent professional advice to verify pricing data or obtain more detailed market information. 1uptick.com should not be regarded as soliciting any subscriber or visitor to execute any trade. You are solely responsible for all of your own trading decisions.