


 |
| Gold V.1.3.1 signal Telegram Channel (English) |
WTI Crude Oil: Price Drops Below $70 Amid Iran Deal Optimism and Strait of Hormuz Stability, June 25, 2026
2026-06-25 @ 06:03
In the past 24 to 48 hours, WTI crude oil has experienced significant volatility, dropping from a closing price of $73.21 on June 23 to $69.87 on June 24, a decline of about 4.5%. This sharp move reflects the market’s reassessment of energy supply risks and global economic outlook.
Recent market news indicates a de-escalation in geopolitical tensions between the US and Iran, particularly with a potential US-Iran deal reducing the war premium priced into oil. Additionally, increased tanker traffic in the Strait of Hormuz has eased concerns over supply disruptions. Meanwhile, China’s crude imports have plunged to their lowest since 2018, showing weakening demand from the world’s largest oil consumer and exacerbating fears of oversupply.
These combined factors have driven WTI oil prices down from mid-May highs above $112 to around $70, reflecting a market that is stepping back from overly optimistic expectations while remaining cautious of supply and geopolitical risks. For the average investor, much like hot stocks undergoing large swings due to changing news sentiment, the oil market’s recent moves serve as a reminder that the energy sector remains fraught with uncertainties and trading opportunities.
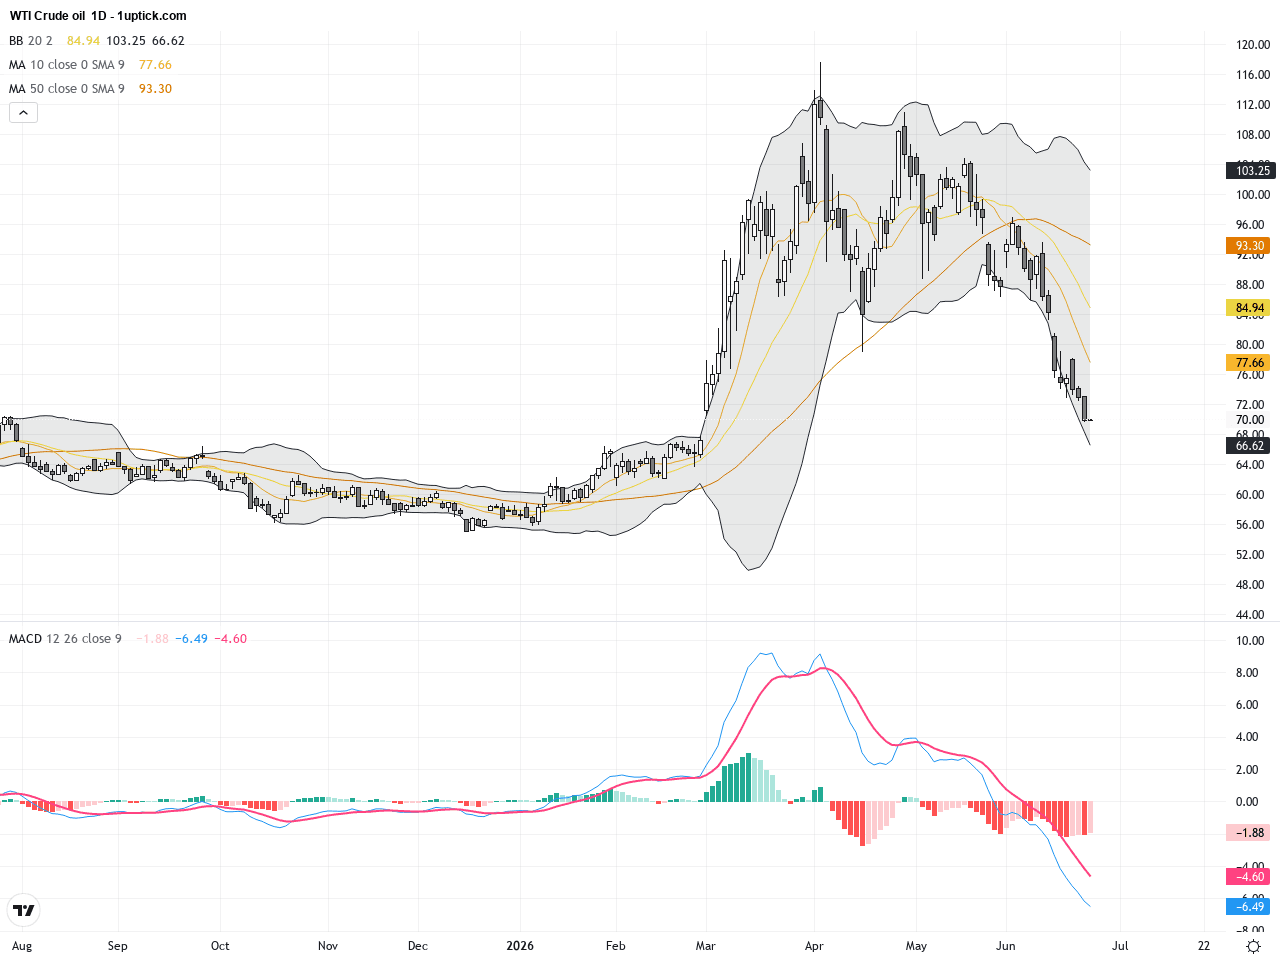
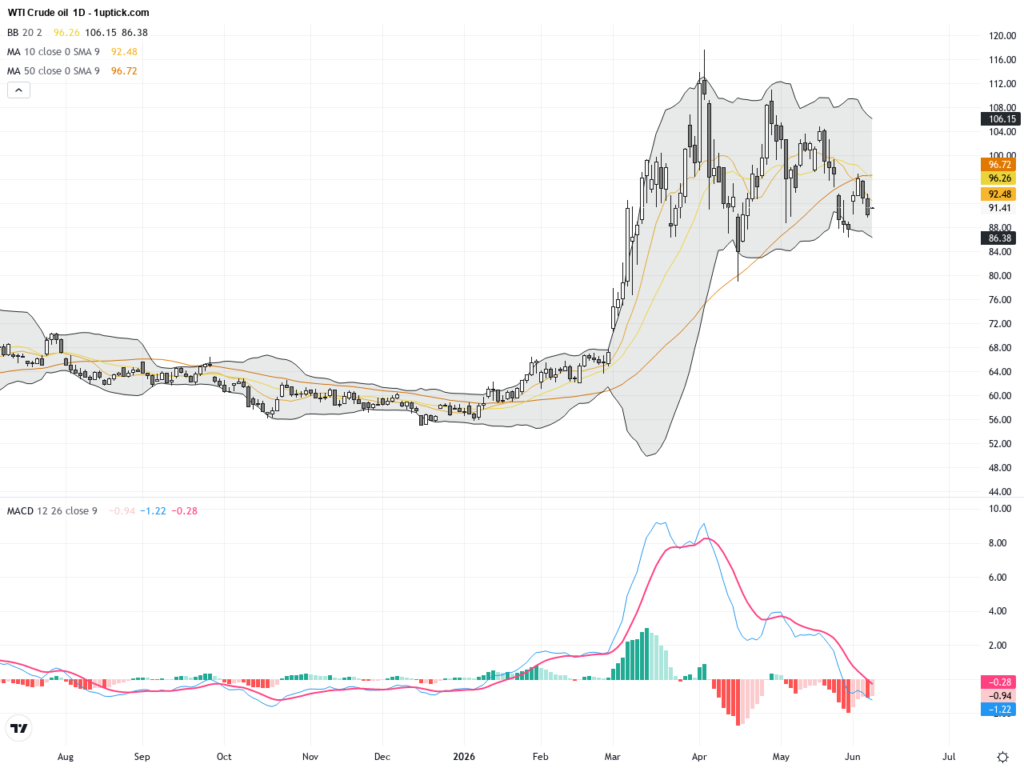
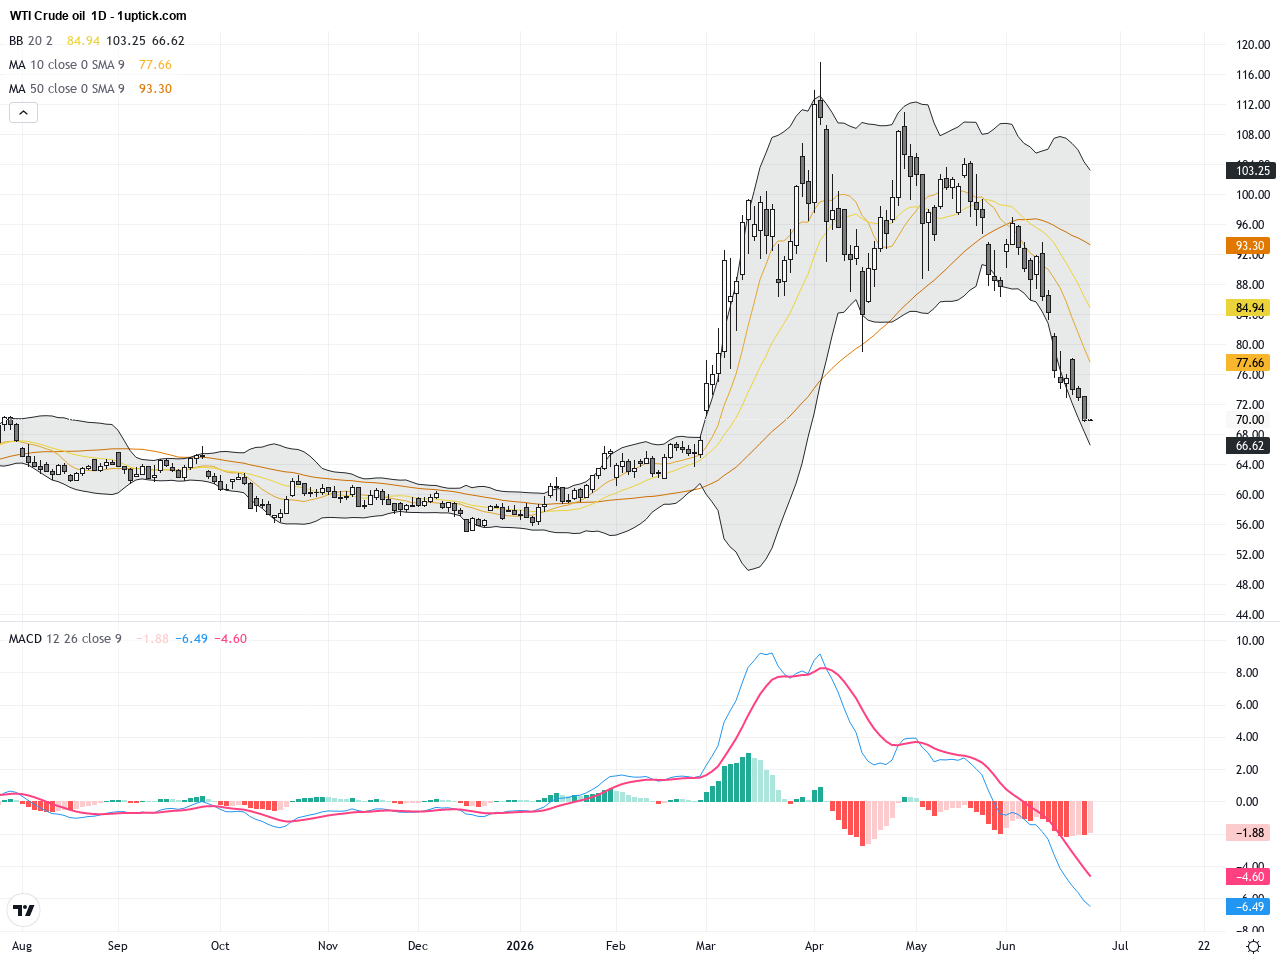
The daily chart shows a continued downtrend in WTI since the mid-May peak at $112.25. Candlesticks exhibit repeated lows, with moving averages in a bearish alignment and broadened Bollinger Bands indicating increased volatility. The MACD remains below the zero line, confirming dominant selling pressure. Overall, the daily technical pattern signals a strong bearish trend with critical attention needed on key support levels for potential stabilization.

The hourly chart over the last 3 to 5 days reveals sharp swings from around $74 down to a low near $69.63. WTI is consistently trading below the 50-hour moving average. Bollinger Bands show contraction followed by expansion, highlighting short-term volatility spikes. MACD is hinting at a potential bullish crossover, suggesting a possible short-term bounce, though confirmation via rising volume is necessary before concluding a trend reversal.
Technical Trend: WTI is currently in a volatile and pronounced downtrend in the short term.
WTI’s recent technical setup indicates a clear downtrend with increased volatility. The daily chart reveals sustained selling pressure corroborated by the MACD’s bearish momentum. The hourly chart’s potential bullish MACD crossover suggests a short-lived rebound possibility, but traders should watch for volume confirmation. No clear classic reversal patterns have formed, emphasizing caution around support breaks that could lead to further declines.There are no significant or directly relevant economic events scheduled today that would impact WTI Crude Oil prices. Market focus remains on geopolitical developments and supply-demand fundamentals, so investors should watch for any unexpected news that might cause rapid market reactions.
Resistance & Support

Run Live WTI Crude Oil Analysis
The above financial market data, quotes, charts, statistics, exchange rates, news, research, analysis, buy or sell ratings, financial education, and other information are for reference only. Before making any trades based on this information, you should consult independent professional advice to verify pricing data or obtain more detailed market information. 1uptick.com should not be regarded as soliciting any subscriber or visitor to execute any trade. You are solely responsible for all of your own trading decisions.