


 |
| Gold V.1.3.1 signal Telegram Channel (English) |
XAUUSD Technical & Fundamental Report: Triangle Consolidation Signals Short-Term Adjustment, June 26, 2026
2026-06-26 @ 05:04
Over the past 24 to 48 hours, gold prices (XAUUSD) have hovered around the $4,000 mark, closing at $4,024.92 on June 25, 2026, showing a marked shift from the more volatile moves seen in previous days. Recent market news highlights that prediction markets assign very slim odds for gold to surpass $4,200 by month-end, indicating general expectations for consolidation near $4,000 and a cautious investor stance.
Deutsche Bank recently slashed its gold price forecasts by up to 22%, reflecting Wall Street’s growing wariness about bullion’s bullish prospects. Rising U.S. Treasury yields driven by Federal Reserve rate hike bets, coupled with a strong U.S. dollar, have weighed heavily on gold’s safe-haven appeal.
Moreover, analyses suggest that the increase in central bank gold reserves is primarily a mark-to-market effect from rising prices, rather than genuine physical demand, leaving fundamental confidence in gold somewhat shaky. Investors increasingly perceive gold as a high-beta asset rather than a traditional safe haven. The market is keenly watching potential U.S.-Iran diplomatic outcomes, which could alleviate geopolitical tensions and help lift gold in the near term.
In summary, gold markets have exhibited sideways trading in recent sessions with no significant bullish catalysts. Retail investors should remain cautious and closely monitor Federal Reserve policy signals and geopolitical developments, as these will largely shape gold’s price trajectory moving forward.

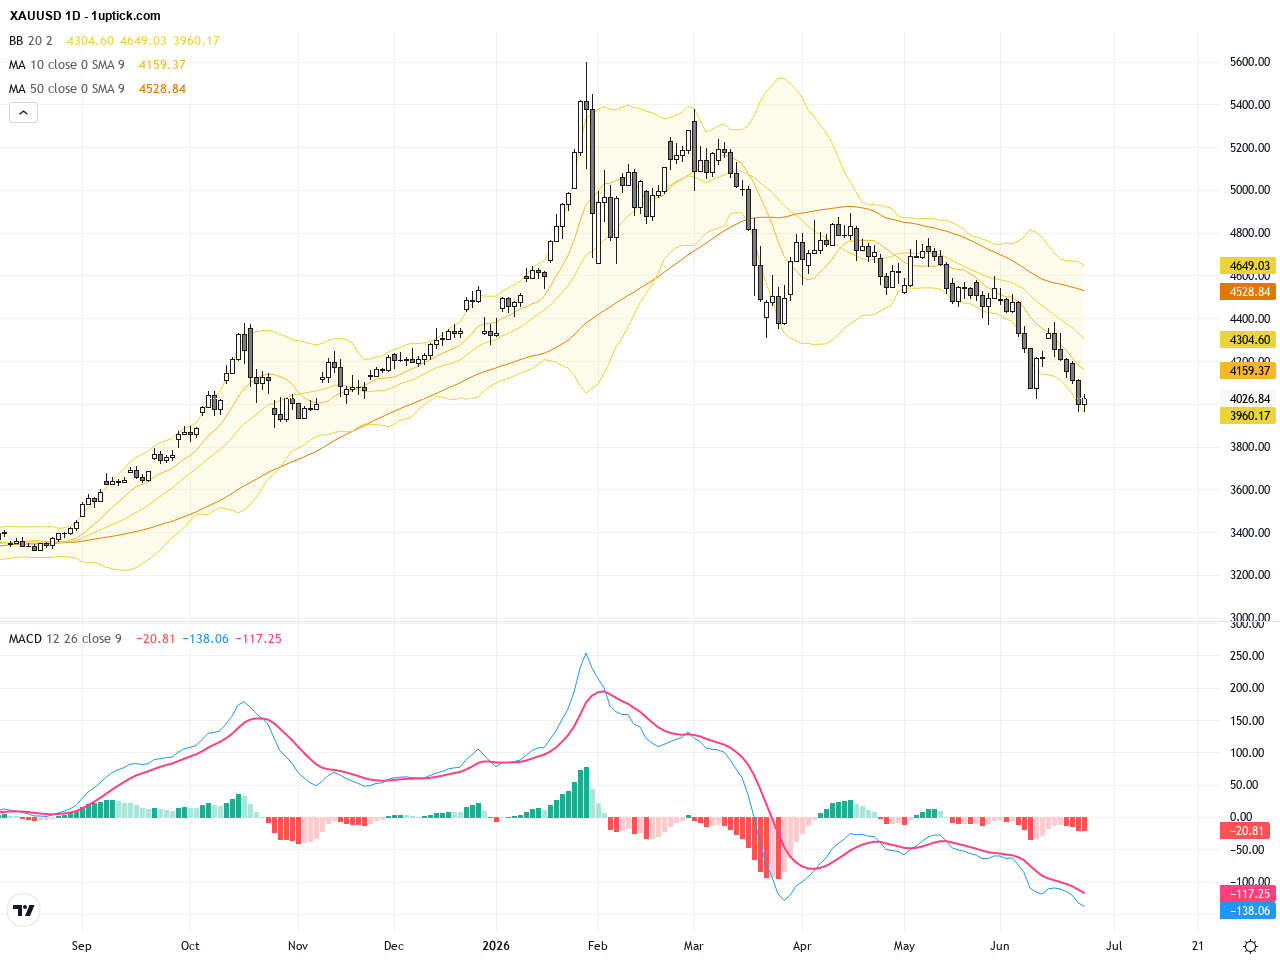
On the daily chart, XAUUSD has trended downwards from a recent high near $4192, forming a contracting triangle consolidation pattern that suggests equilibrium between bulls and bears. Moving averages show a short-term downward tilt, while Bollinger Bands narrow, signaling decreased volatility. The MACD hovers near the zero line without a decisive trend but could soon generate a crossover signal. Overall, the trend signals a market correction phase awaiting new drivers for breakout.
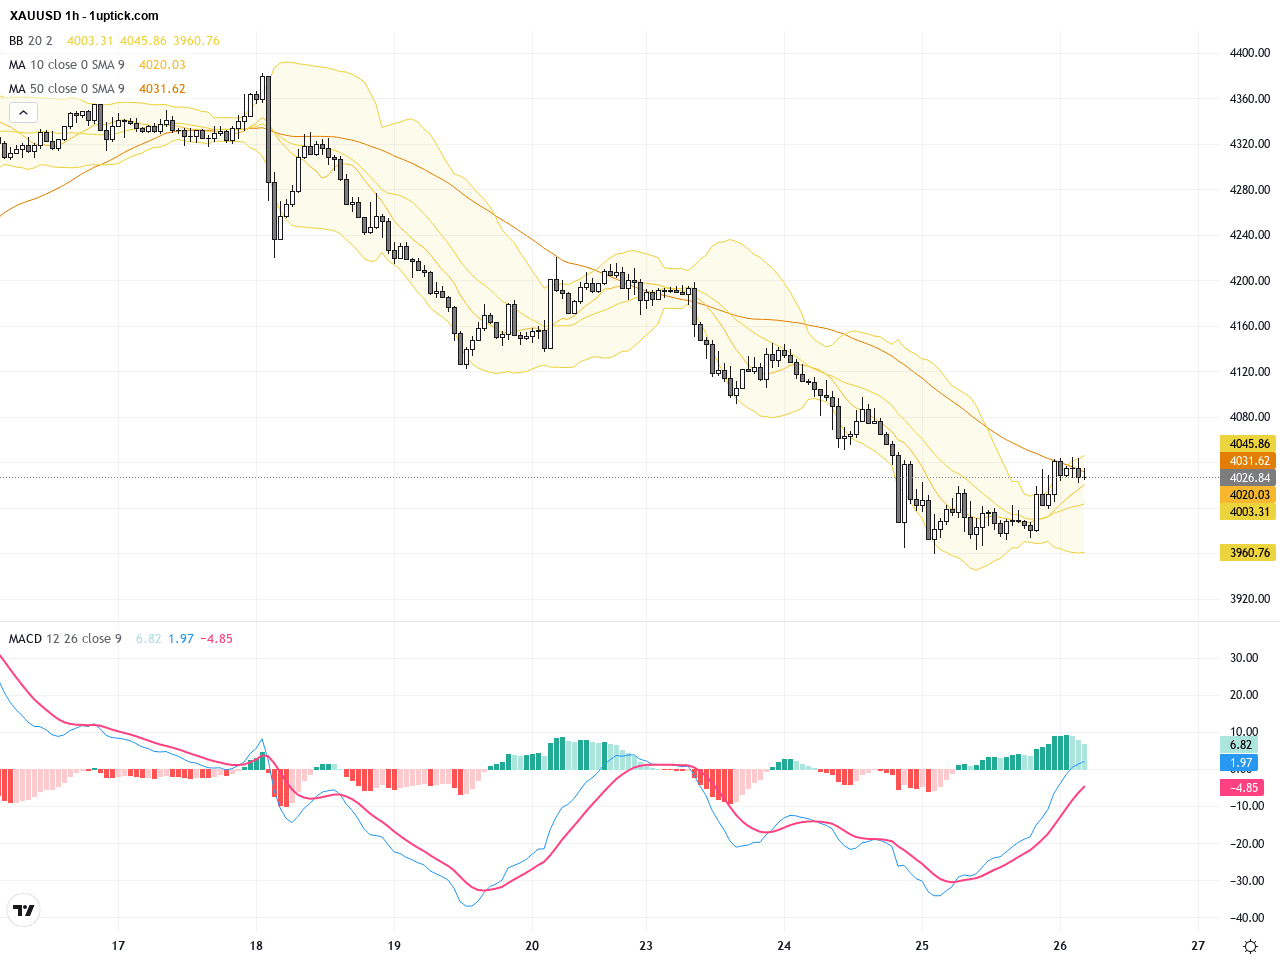
The hourly chart shows price movement in a tight range between $4000 and $4050 over the past 3-5 days. The 50 and 200-hour moving averages are converging, indicating sideways momentum. Bollinger Bands slightly widen, suggesting mild short-term volatility increase. MACD remains flat near the zero axis, showing no immediate bullish or bearish dominance. Notably, a recent hammer candlestick hints at stronger short-term support and potential rebound within the next 24 hours.
Technical Trend: The current trend is cautiously sideways with a slight bearish bias as the market awaits clear directional cues.
Technically, XAUUSD’s current triangle consolidation is critical, indicating compression of momentum ahead of a breakout. The daily MACD’s potential crossover is a key indicator to watch: a bullish crossover may trigger renewed upside momentum. The recent hammer candlestick pattern reinforces short-term support strength, presenting a buying opportunity on dips. Low trading volume reflects market caution, emphasizing the need to monitor for major news catalysts.Today’s economic calendar features strong Australian employment data early in the session, which supports the US dollar and adds pressure on gold. Key US data releases, including Personal Consumption Expenditures (PCE), GDP, and jobless claims, are scheduled for the evening (around 20:30 HKT). Positive surprises in these figures could strengthen the dollar further, likely pushing XAUUSD lower. While there are no gold-specific events, dollar-related data today remain the primary drivers of short-term gold price volatility.
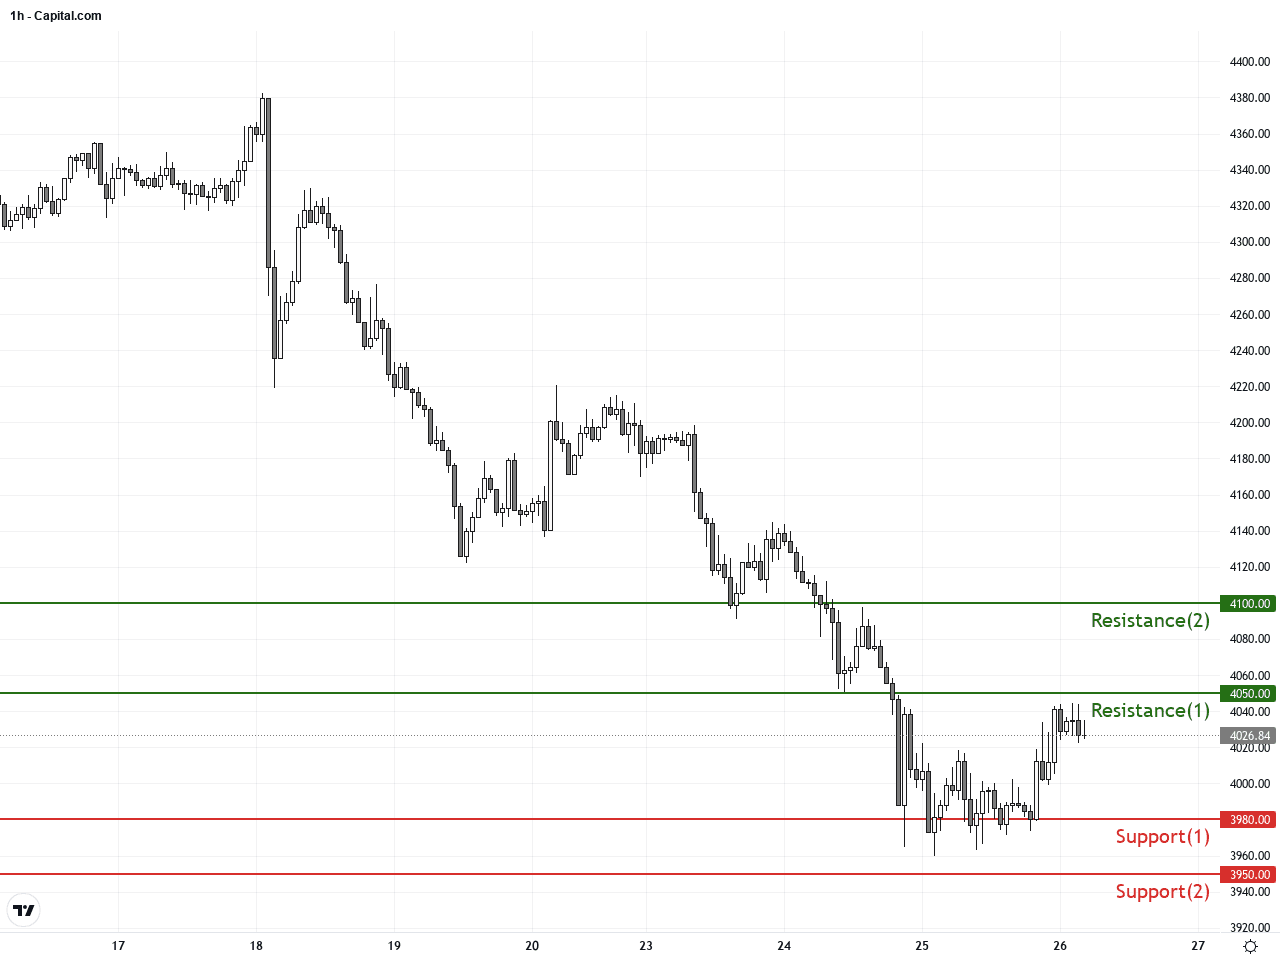
Resistance & Support
The above financial market data, quotes, charts, statistics, exchange rates, news, research, analysis, buy or sell ratings, financial education, and other information are for reference only. Before making any trades based on this information, you should consult independent professional advice to verify pricing data or obtain more detailed market information. 1uptick.com should not be regarded as soliciting any subscriber or visitor to execute any trade. You are solely responsible for all of your own trading decisions.