



 |
| Gold V.1.3.1 signal Telegram Channel (English) |
EURUSD: Eurozone Inflation Dip Weakens EUR/USD Below Key Support, July 3, 2026
2026-07-03 @ 09:01
Over the past 24 to 48 hours, the EUR/USD pair exhibited volatility, closing yesterday near 1.14308, fluctuating between roughly 1.1420 and 1.1440. The euro weakened mainly due to softer Eurozone inflation data, which trimmed expectations for more aggressive ECB rate hikes, pushing the pair below the 1.1450 level during early Asian trading.
Conversely, weaker US employment data, with June nonfarm payrolls forecast lowered to 110K from a stronger prior reading, pressured the US dollar and allowed EUR/USD to climb to an eight-session high. This clash of economic signals has left investors cautious about the future monetary policy path.
For the average investor, the recent market movements can be seen as a tug-of-war: the euro is pressured by sluggish regional growth, while the US dollar softens amid disappointing US labor data. This unsettled environment means keeping a close eye on upcoming US inflation and GDP releases, which will be key for determining future central bank actions and currency moves.
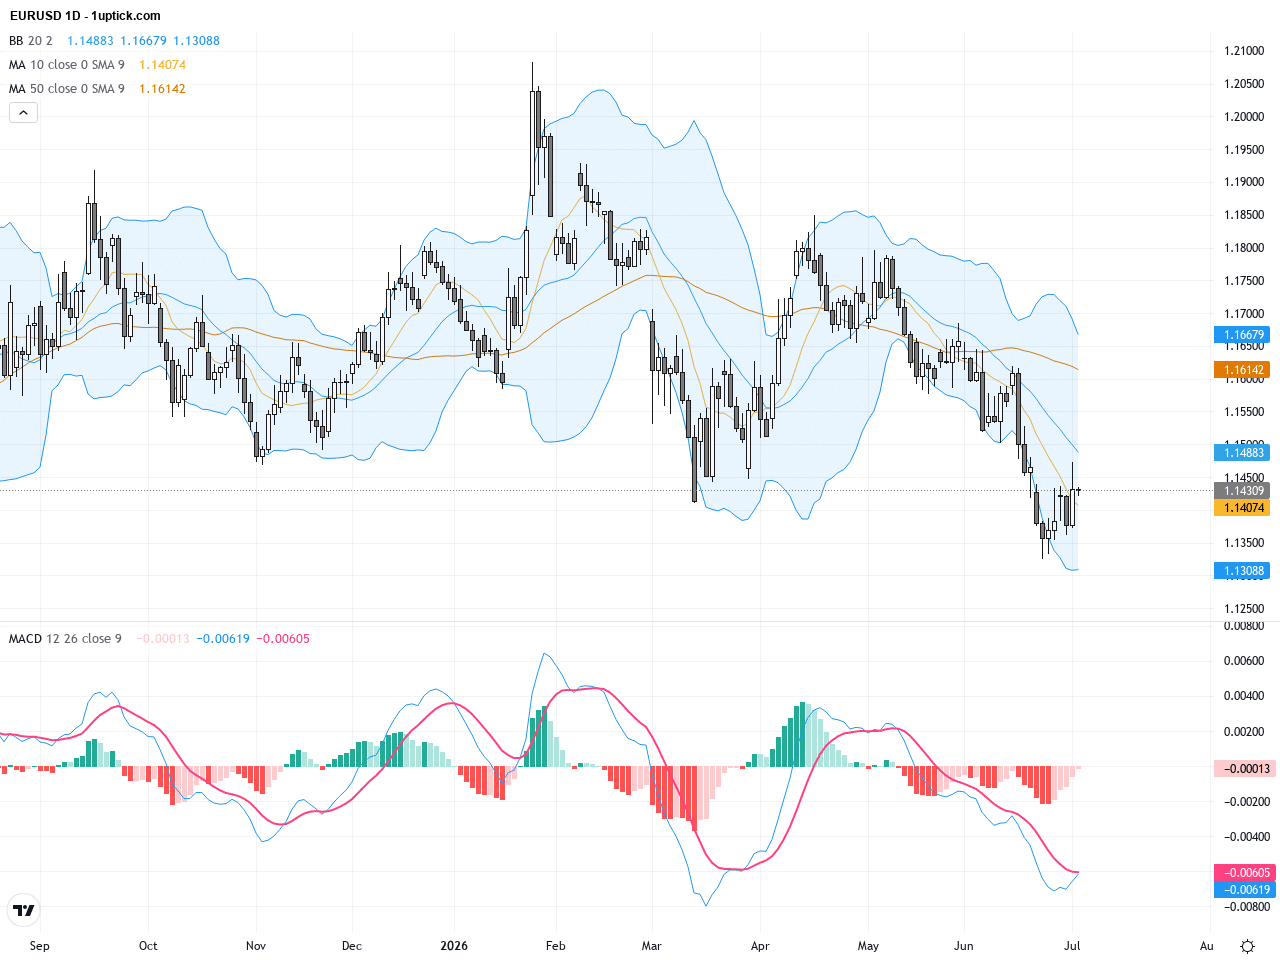
The daily chart highlights a sustained downtrend since earlier in the year, with EURUSD trading below its 50-day and 200-day moving averages, signaling bearish momentum. Bollinger Bands are tightening, with price hugging the lower band, indicating low volatility but persistent selling pressure. The MACD recently formed a bearish crossover, reinforcing the negative momentum. Overall, the longer-term trend remains downside-biased until a confirmed break above major moving averages.
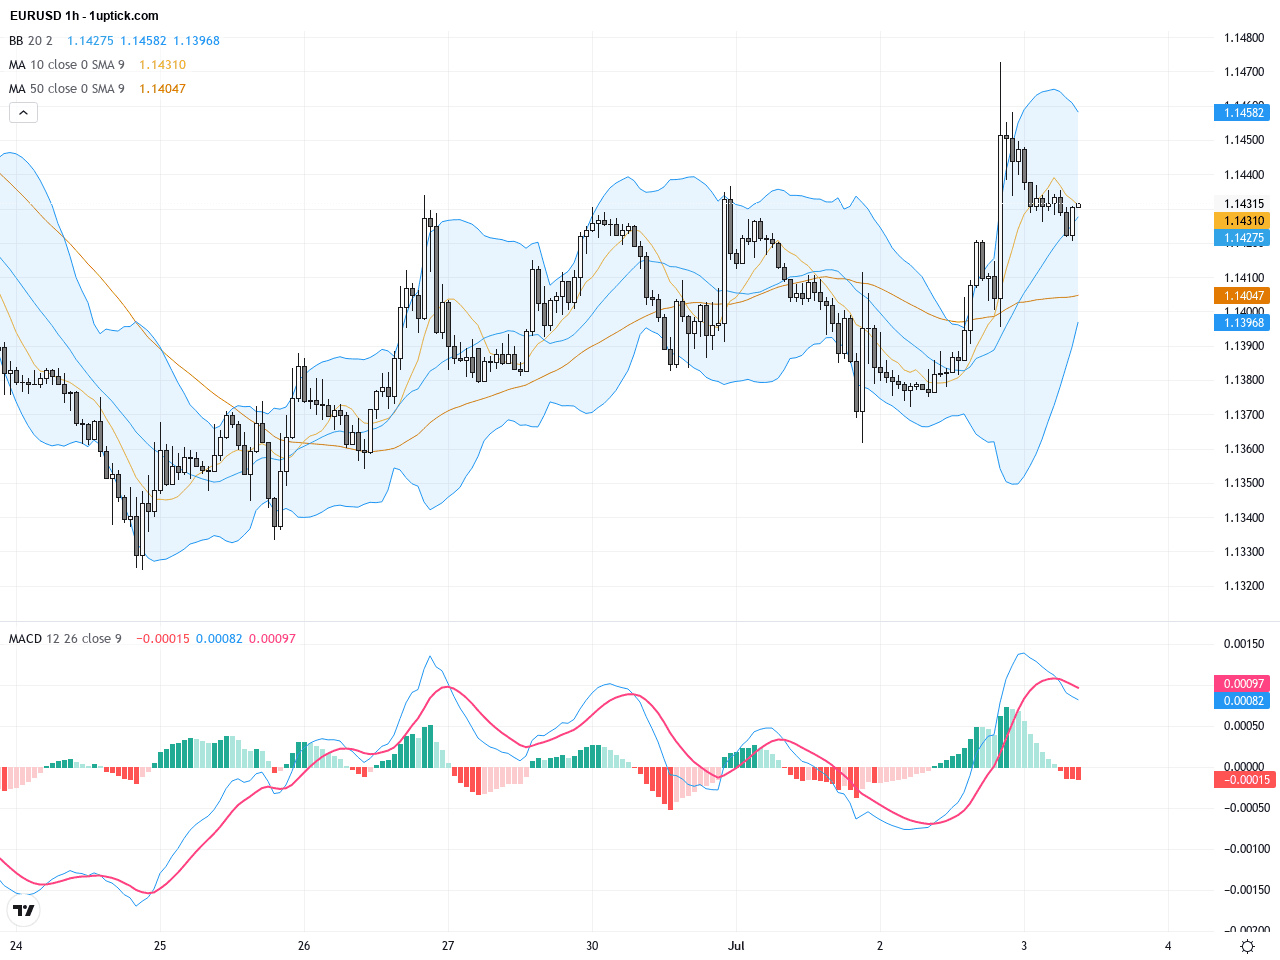
The hourly chart over the past 3-5 days shows an expanding wedge formation near the 1.1420 support zone, reflecting indecision amid volatility. Short-term moving averages have crossed bearish, and price has repeatedly tested the 1.1420 support, briefly breaking below but failing to sustain. A recent bearish engulfing candlestick pattern suggests continuation of downward pressure in the next 24 hours. Traders should watch if 1.1420 can hold or if a decisive breakdown ensues.
Technical Trend: Cautiously Bearish
Technically, EURUSD remains in a critical short-term consolidation marked by the expanding wedge and bearish engulfing candlestick. The MACD and moving averages suggest weakening momentum. A break below 1.1420 would accelerate the downside move. Investors should monitor today’s PMI prints and ECB comments for catalysts that could trigger significant volatility, offering potential high-probability trading opportunities.Today’s GMT+1 economic calendar for the Eurozone includes multiple PMI releases, industrial production, retail sales, and a scheduled speech by the ECB Chairman, all likely to impact EURUSD price action. While there are no major direct US events scheduled today, the market remains attentive to upcoming US jobs and inflation figures that will influence the dollar’s strength in the coming days. The ECB Chairman’s remarks will be especially important for near-term euro trend direction.
Resistance & Support

The above financial market data, quotes, charts, statistics, exchange rates, news, research, analysis, buy or sell ratings, financial education, and other information are for reference only. Before making any trades based on this information, you should consult independent professional advice to verify pricing data or obtain more detailed market information. 1uptick.com should not be regarded as soliciting any subscriber or visitor to execute any trade. You are solely responsible for all of your own trading decisions.