








 |
| Gold V.1.3.1 signal Telegram Channel (English) |
WTI Crude Oil: Technical Patterns Signal Strong Uptrend Amid Middle East Tensions, July 9, 2026
2026-07-09 @ 06:03
Over the past 24 to 48 hours, WTI Crude Oil prices experienced notable volatility, closing yesterday at $73.52 per barrel, a clear increase from prior levels. Market attention has been sharply focused on escalating tensions between the US and Iran. Following President Trump’s announcement to end the cease-fire with Iran, concerns about supply disruptions surged, driving up demand and prices for crude oil.
Among major Western oil companies, Occidental Petroleum bucked the trend, rising 4% intraday to $53.90, reflecting investor optimism that higher oil prices will bolster energy stocks. Conversely, ExxonMobil and Chevron lagged behind, highlighting some market divergences amid the volatility. US crude oil futures extended gains for a second consecutive day with roughly 3% increases, reaching multi-week highs amid revived US-Iran conflict risks.
This clearly shows that recent geopolitical risks are the main catalysts behind the WTI crude price rally. For everyday investors, this means markets remain highly sensitive to supply security concerns, and any international developments can quickly impact energy prices—especially amid already tight global energy supplies. Investors should closely monitor developments in affected regions as sharp oil price swings could significantly affect overall portfolio risk and returns.
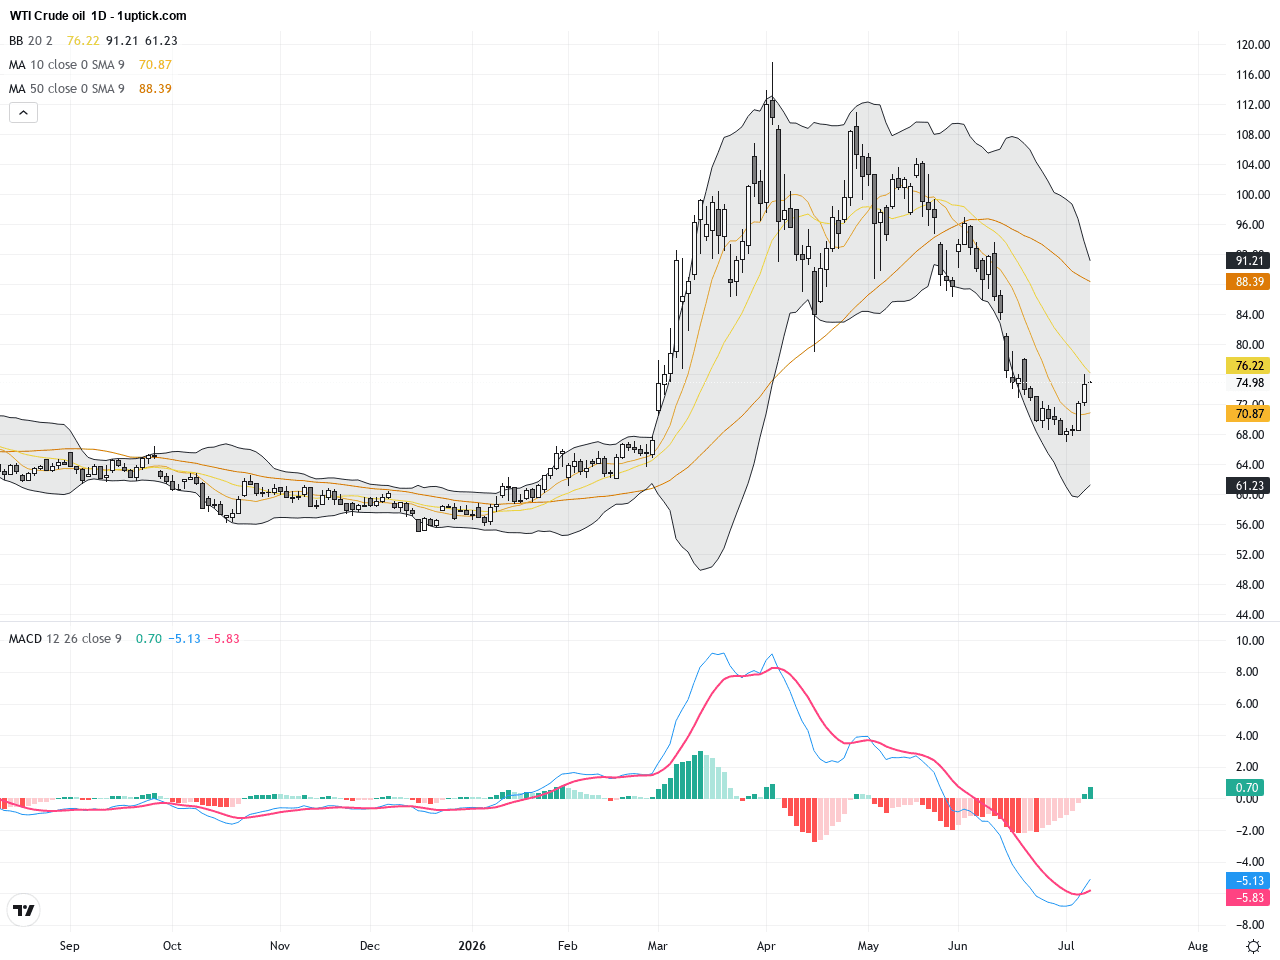
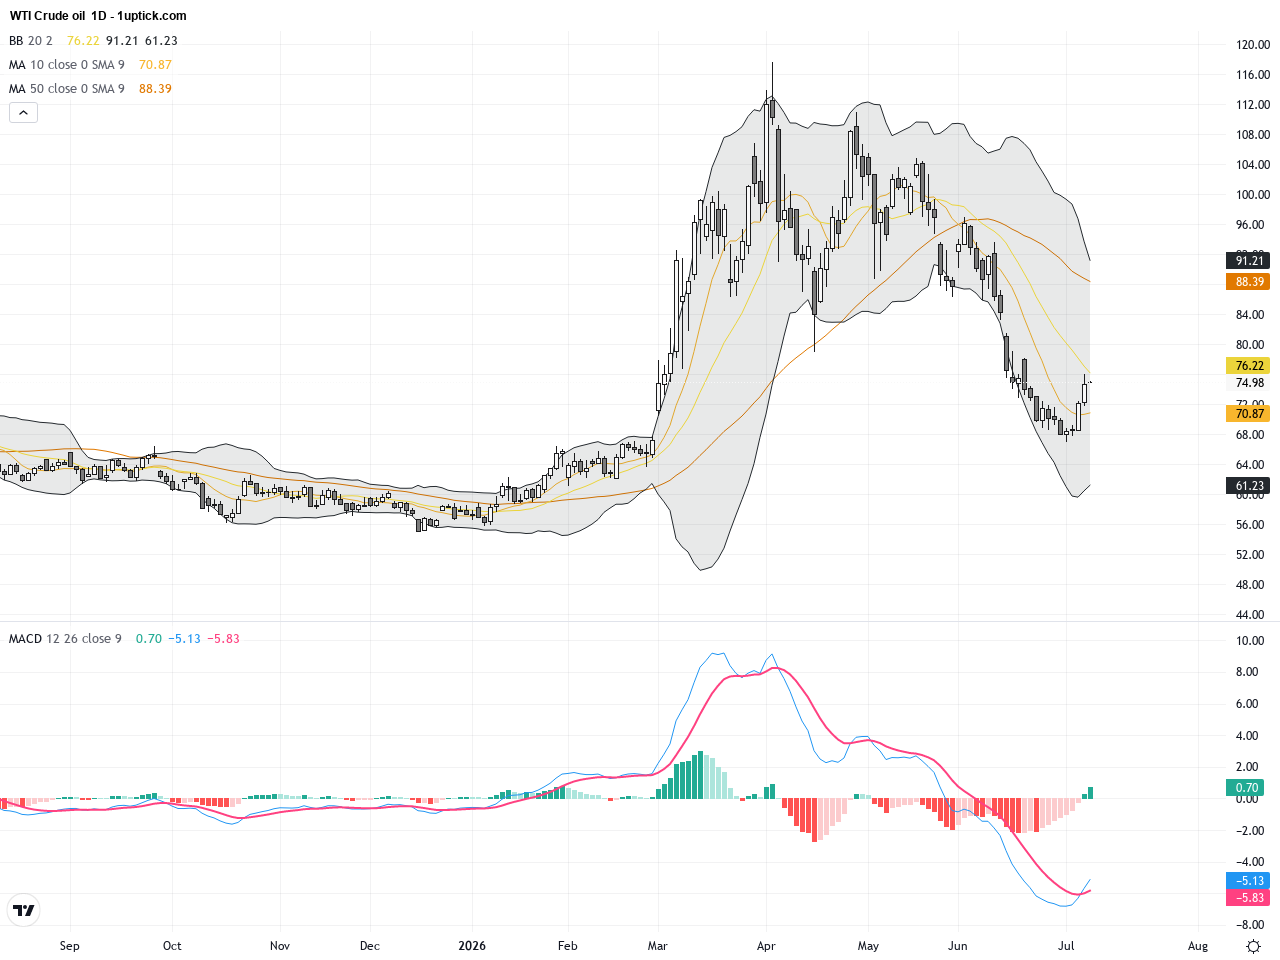
The daily chart shows WTI crude oil maintaining a strong bullish rebound since late June, breaking above the key resistance near $72. The 20-day moving average is trending upward alongside expanding Bollinger Bands, indicating rising volatility and sustained buying pressure. The MACD remains positive with growing histogram bars, supporting a robust upward trend without noticeable divergence. Overall, the daily technical pattern favors continued gains above the $73.5 level, reinforcing bullish momentum.
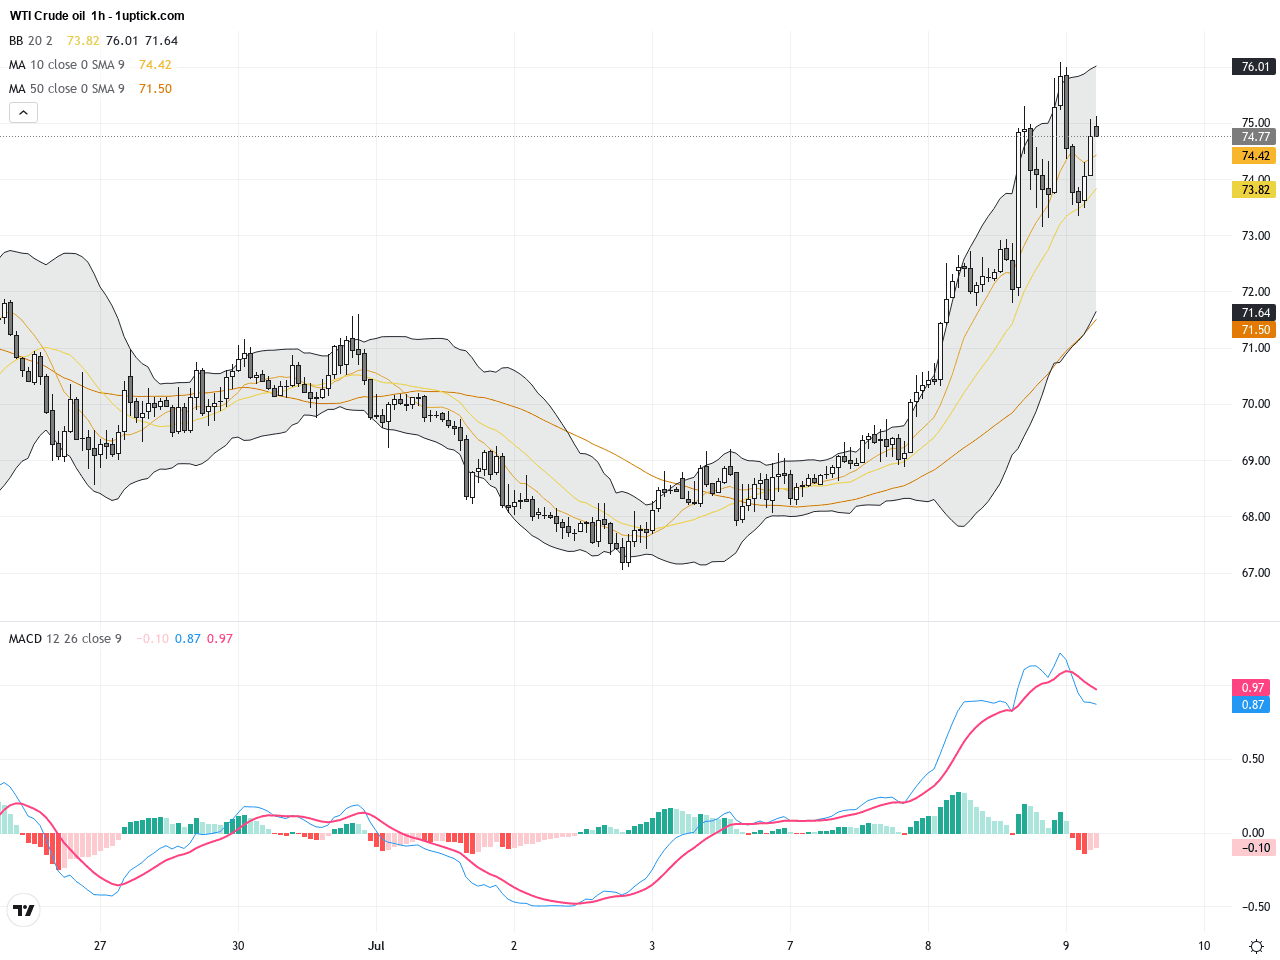
On the hourly chart over the past five days, WTI has experienced consolidation before recently breaking decisively above $75, entering a short-term uptrend. The 20- and 50-period moving averages formed a golden cross, signaling enhanced buying strength. Bollinger Bands expanded after a prior squeeze, and the MACD above zero aligns with several recent bullish engulfing candlesticks suggesting positive momentum over the next 24 hours. Short-term support is seen near $73.5, while resistance targets cluster around $77.
Technical Trend: WTI oil currently exhibits a decisively bullish trend, signaling strong upward momentum in the short to medium term.
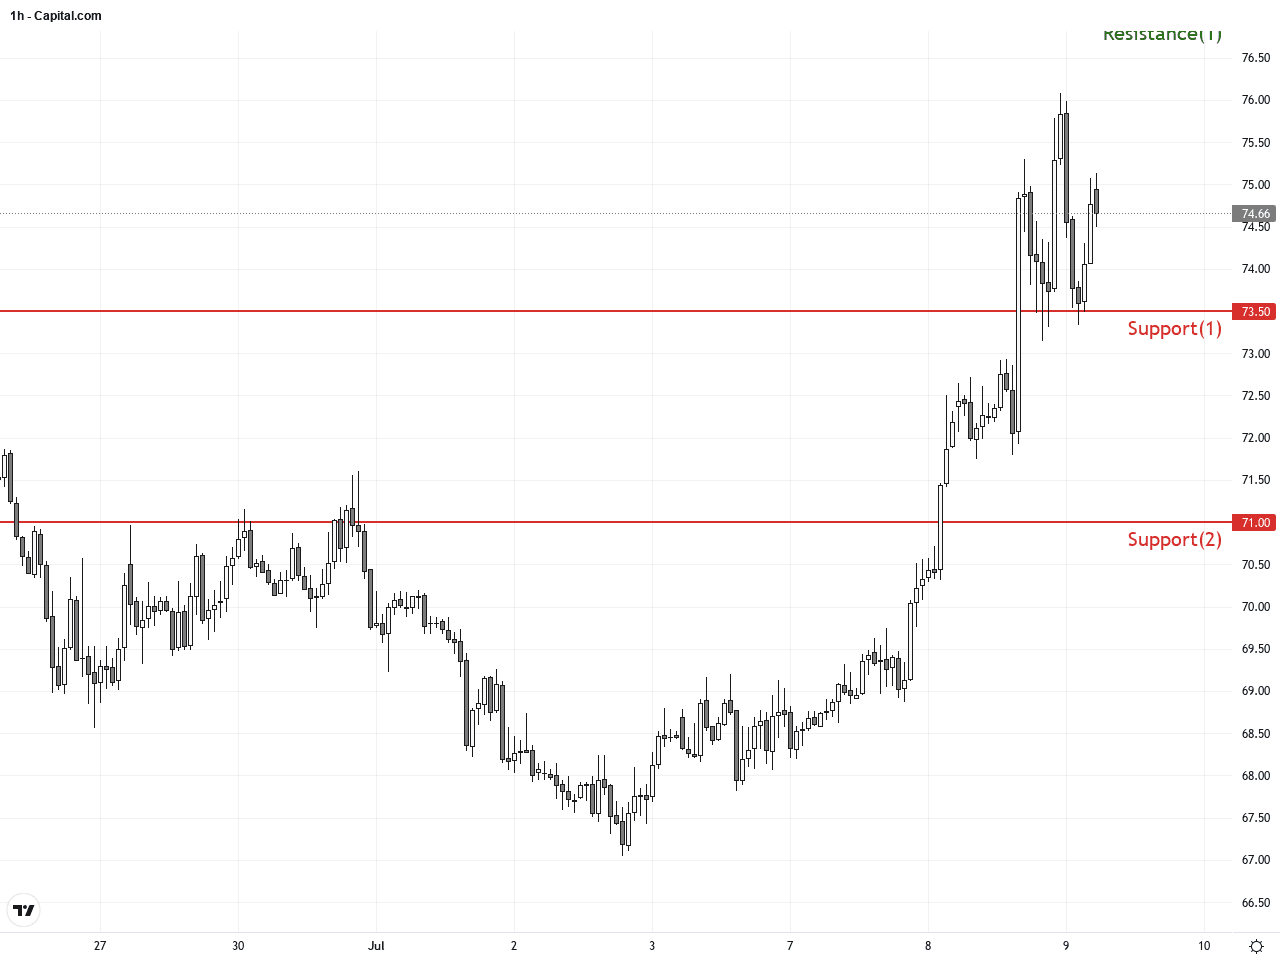
Technically, WTI crude has surged past multiple resistance levels with sustained bullish momentum. The MACD is in a strong long position with a recent golden cross on the hourly chart confirming underlying strength. The recent gap-up driven by US-Iran geopolitical risk suggests continuation of momentum and supports a buy-on-dips approach. Key levels to watch are $73.5 for support and $77 for potential breakout. This technical context provides actionable signals for traders aiming to capitalize on ongoing strength.There are no significant or direct economic events scheduled today that would impact WTI crude oil markets. The price action remains primarily influenced by existing geopolitical tensions and market sentiment rather than fresh economic data releases.
Resistance & Support
Run Live WTI Crude Oil Analysis
The above financial market data, quotes, charts, statistics, exchange rates, news, research, analysis, buy or sell ratings, financial education, and other information are for reference only. Before making any trades based on this information, you should consult independent professional advice to verify pricing data or obtain more detailed market information. 1uptick.com should not be regarded as soliciting any subscriber or visitor to execute any trade. You are solely responsible for all of your own trading decisions.