









 |
| Gold V.1.3.1 signal Telegram Channel (English) |
XAUUSD Gold: Key Technical Reversal Signal as Price Eyes 52-Week Moving Average Breakout, July 9, 2026
2026-07-09 @ 05:04
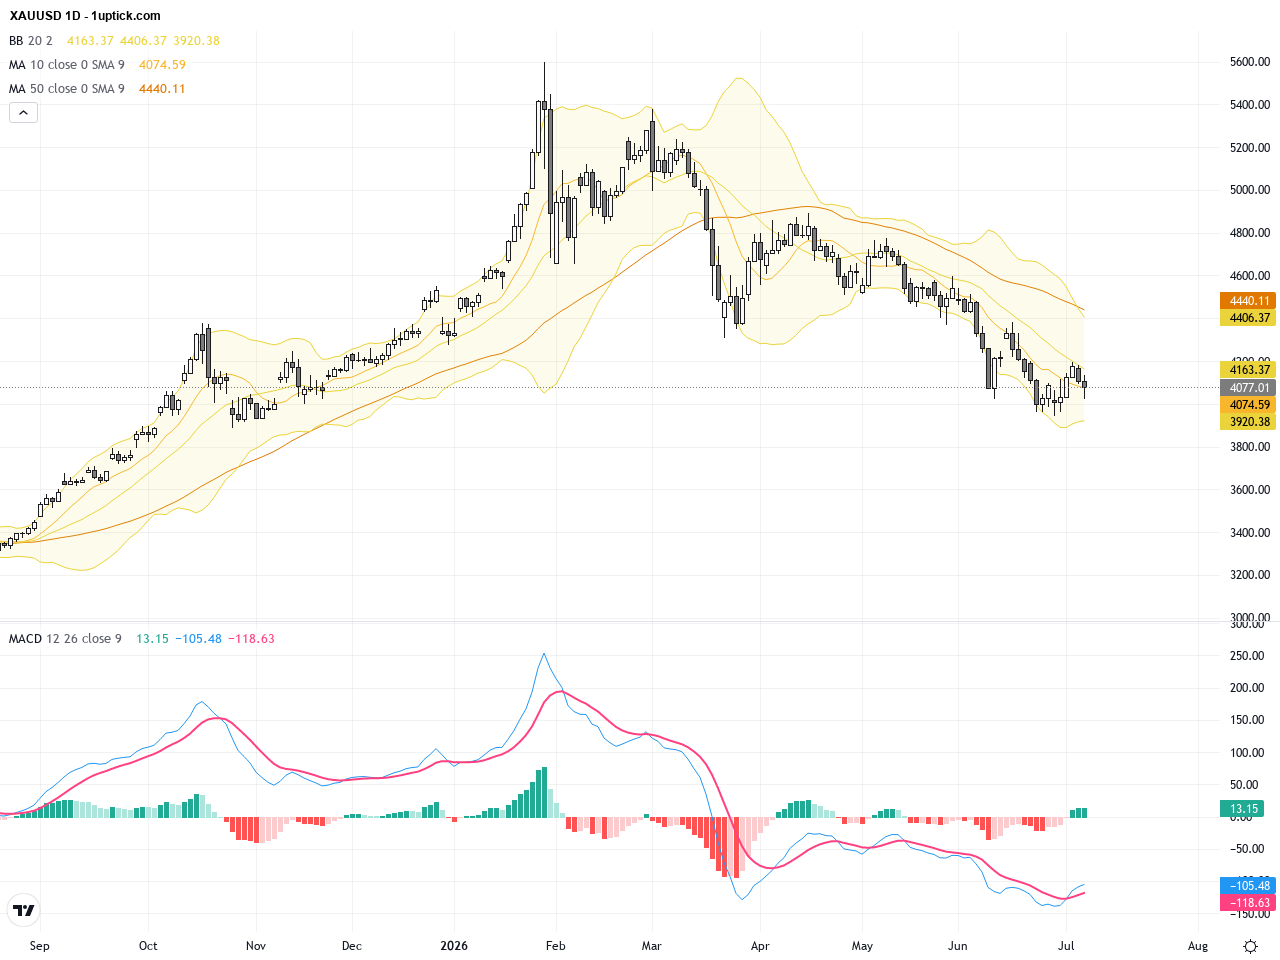
Over the past 24 to 48 hours, the gold market (XAUUSD) experienced notable volatility, with prices rebounding slightly from yesterday’s close at $4,076.34. The market has been keenly focused on whether the latest Federal Reserve minutes could propel gold above its 52-week moving average, a technical milestone seen as potentially confirming a bottom reversal and triggering a new rally.
Meanwhile, a strong rally in oil prices, climbing over 3.5%, exerted some pressure on gold, causing a pullback. However, a weak U.S. June payroll report reduced market bets on further Fed rate hikes, supporting gold prices by weighing down the U.S. dollar and boosting gold’s safe-haven appeal.
For the average investor, the past two days in gold reflect a complex interplay of macroeconomic uncertainty and energy price swings. The soft U.S. jobs data has shifted expectations towards a slower monetary tightening, while soaring oil prices highlight ongoing inflationary pressures and cost concerns. Together, these factors have driven gold’s choppy price action but also underscore gold’s role as a robust hedge asset amid market jitters.
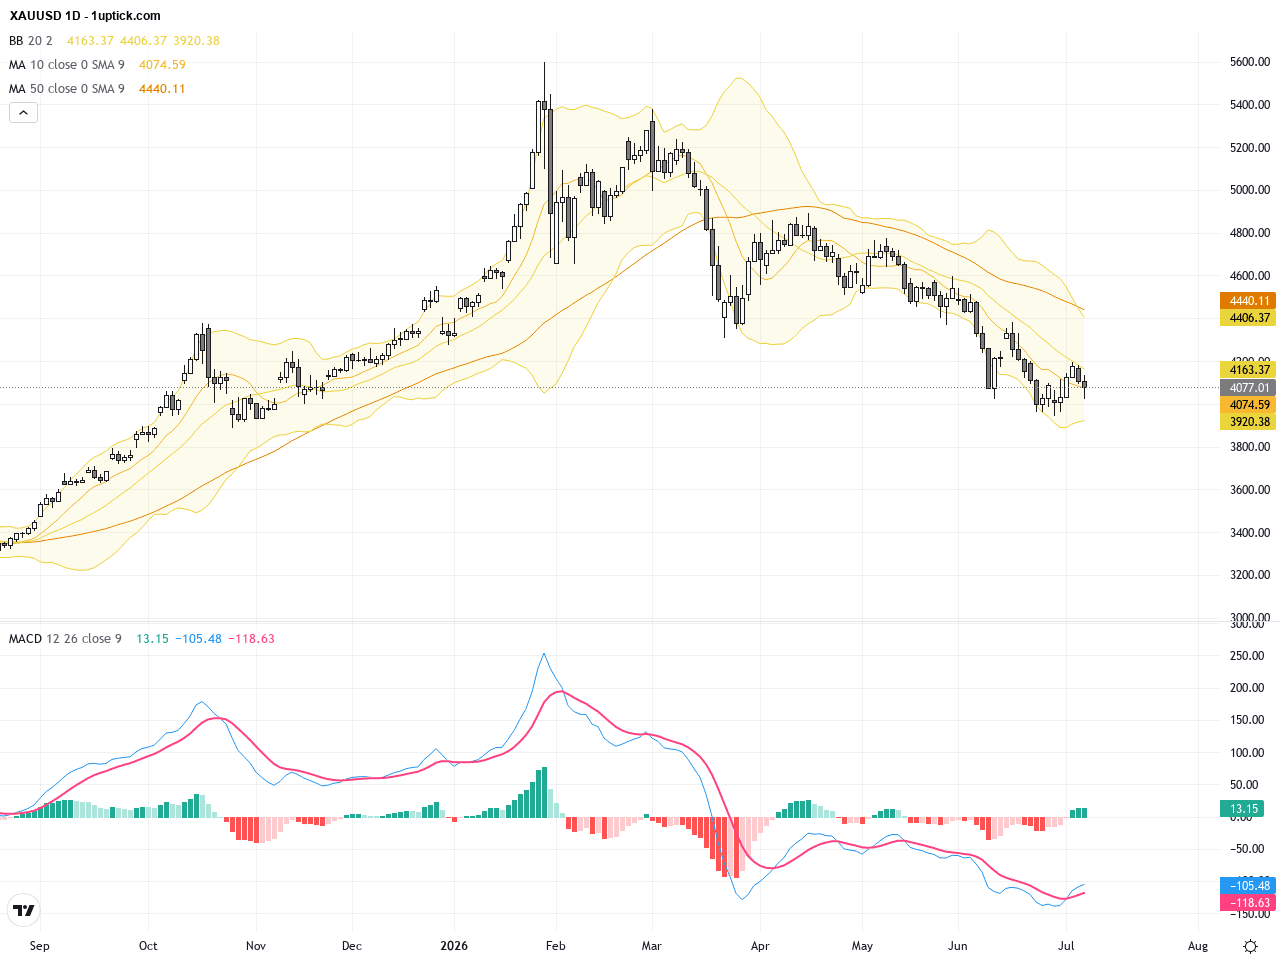
On the daily chart, XAUUSD has retreated from around 4200 USD, entering a consolidation phase between 4000 and 4100 USD. Bollinger Bands are tightening, indicating reduced volatility but signaling potential for an upcoming breakout. Both the 20 and 50-day moving averages are flattening, showing a tug-of-war between bulls and bears. The MACD has formed a bearish crossover, denoting weakening short-term momentum and further range-bound trading until a decisive break above the 52-week moving average occurs.
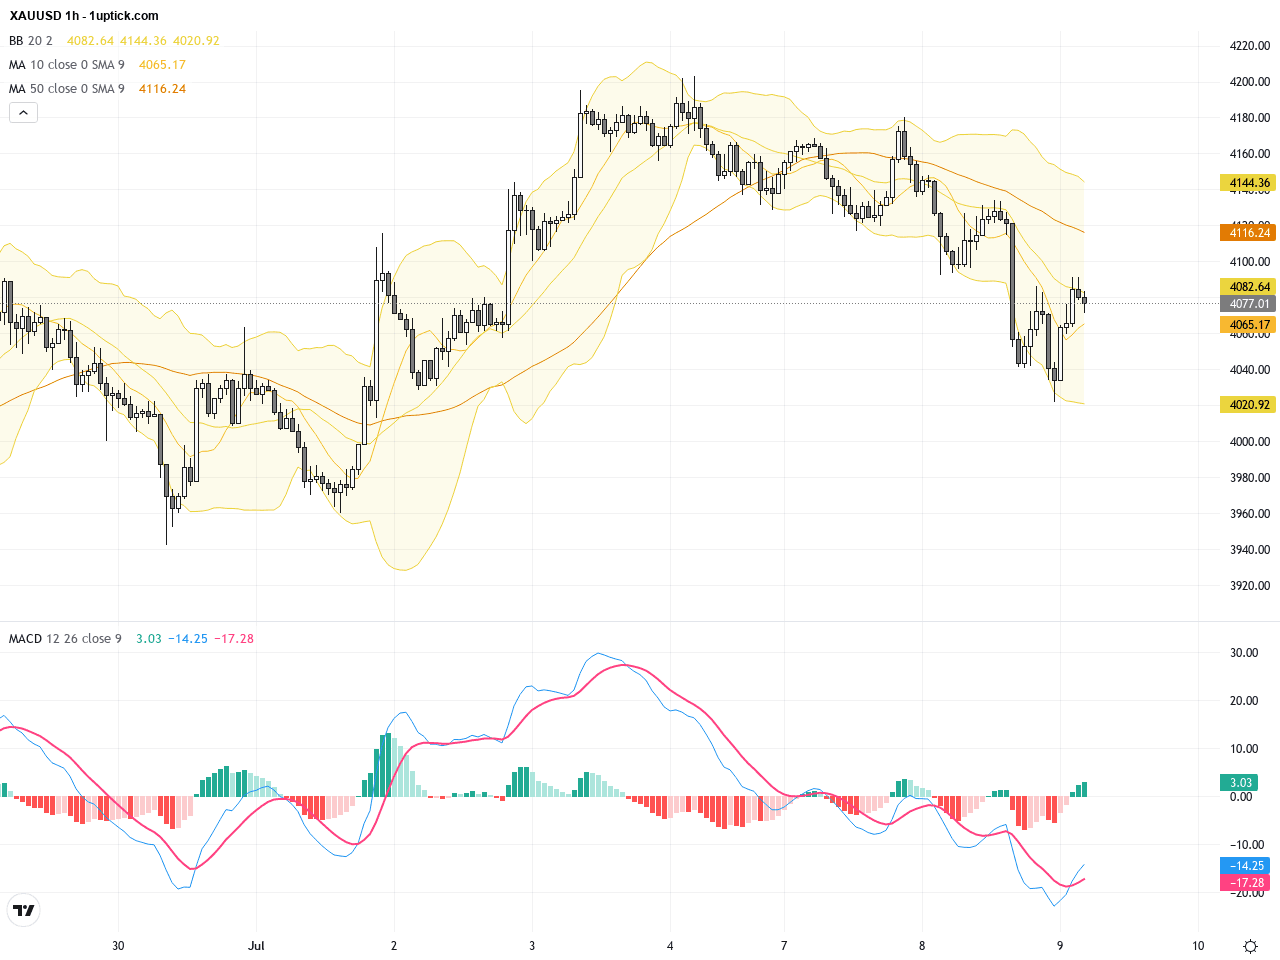
The hourly chart shows a descending channel forming over the past 3 to 5 days with a bearish flag pattern emerging, reflecting short-term selling pressure. Prices oscillate between key 50 and 100-period moving averages, with the lower Bollinger Band providing important support. MACD is showing bullish divergence, suggesting a possible short-term rebound. A recently formed hammer candlestick pattern signals a short-term bullish sentiment, pending confirmation by volume within the next 24 hours.
Technical Trend: Consolidation with cautious upward bias
Technically, XAUUSD is at a pivotal point where breaching the 52-week moving average resistance could trigger a new bullish trend. However, recent daily MACD bearish crossover and the short-term bearish flag pattern caution for ongoing consolidation. The hammer pattern on the hourly chart and bullish MACD divergence point to a potential rebound. Risk-conscious traders should wait for confirmation of breakout or trend reversal signals before committing. Overall, it’s a wait-and-watch scenario with opportunities for disciplined entries on dips.Today’s GMT+1 economic calendar highlights the US Federal Open Market Committee (FOMC) minutes release at 20:00 as the main event relevant to XAUUSD. The market will scrutinize the minutes for clues on rate policy, potentially causing sharp gold price fluctuations. Additionally, US crude oil and gasoline inventory data released at 16:30 could have indirect effects on gold prices. Other listed events from Japan and New Zealand are less likely to directly impact XAUUSD. Traders should be alert around the FOMC minutes announcement for possible volatility.
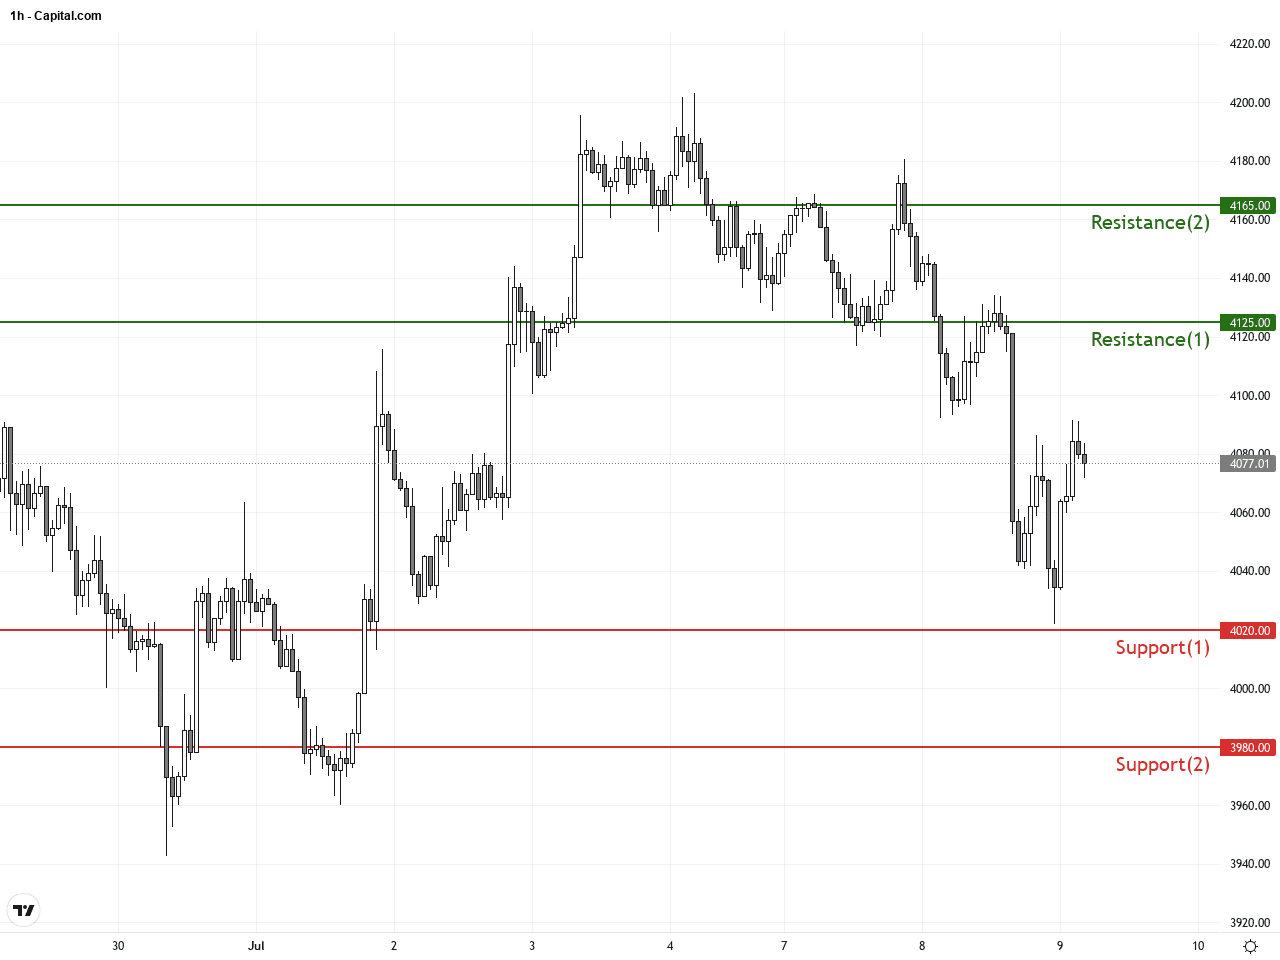
Resistance & Support
The above financial market data, quotes, charts, statistics, exchange rates, news, research, analysis, buy or sell ratings, financial education, and other information are for reference only. Before making any trades based on this information, you should consult independent professional advice to verify pricing data or obtain more detailed market information. 1uptick.com should not be regarded as soliciting any subscriber or visitor to execute any trade. You are solely responsible for all of your own trading decisions.