






 |
| Gold V.1.3.1 signal Telegram Channel (English) |
EURUSD: Key Consolidation Pattern Amid Dollar Strength Signals Potential Decline, July 17, 2026
2026-07-17 @ 09:01
Over the past 24 to 48 hours, EUR/USD has hovered around 1.1440, showing little deviation from yesterday’s closing price of 1.14472, indicating a relatively stable range. However, HSBC’s recent forecast points to further weakness ahead for the euro as a strengthening US dollar is expected to push EUR/USD lower towards 1.10. Ongoing US monetary policies and economic data continue to bolster the dollar, making it the key driver behind recent market moves.
Meanwhile, fluctuations in European energy prices, notably gas, stand out as a significant risk factor. If the energy shock prolongs, market attention may shift away from interest rate expectations toward recession risks, which could weigh further on the euro. For average investors, this highlights a cautionary note: although the euro has held fairly steady recently, the dual pressures of a strong dollar and volatile European energy prices mean your euro investments could face increased volatility and risk, warranting careful monitoring.
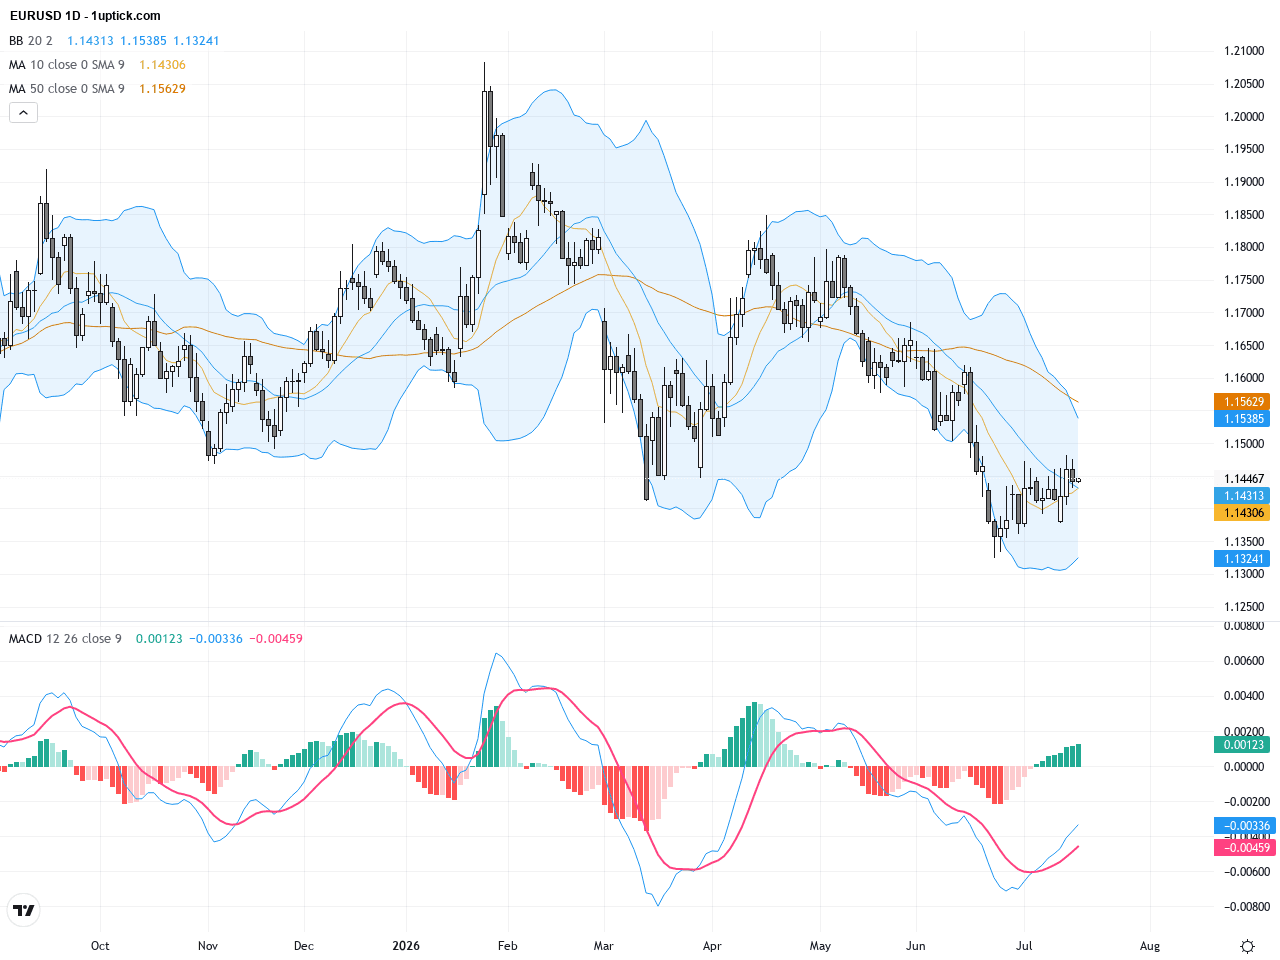
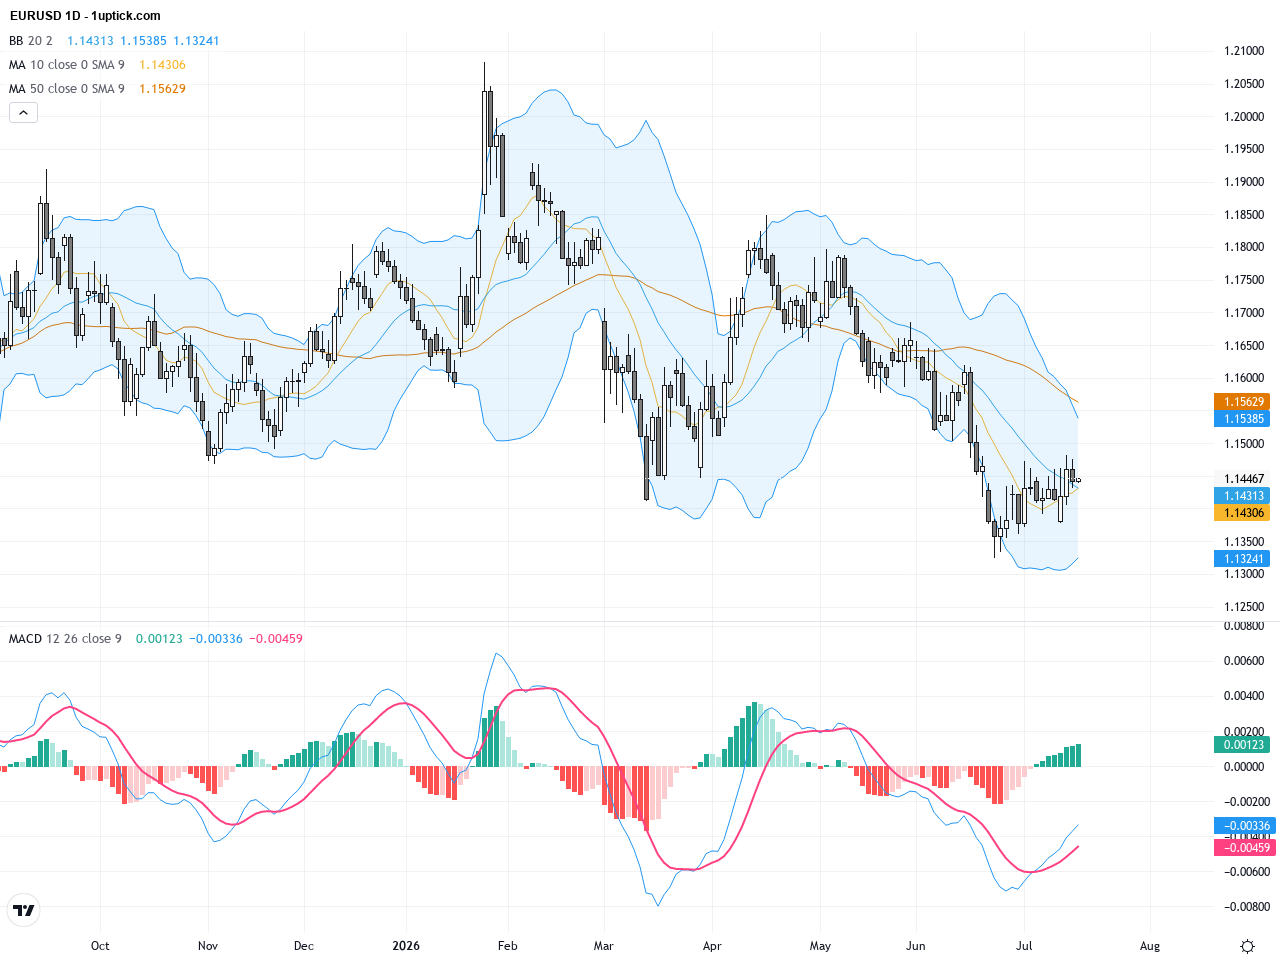
The daily chart reveals that EURUSD has been trending downward over recent months, consistently trading below the 200-day moving average (~1.16414). Price action has formed a consolidation zone between roughly 1.1325 and 1.1500, reflecting a battle between bulls and bears within this range. The MACD remains in negative territory, supporting the bearish longer-term trend. Bollinger Bands are contracting, indicating a decrease in volatility that often precedes a breakout. Overall, the daily trend favors bears but short-term technical rebounds are possible.
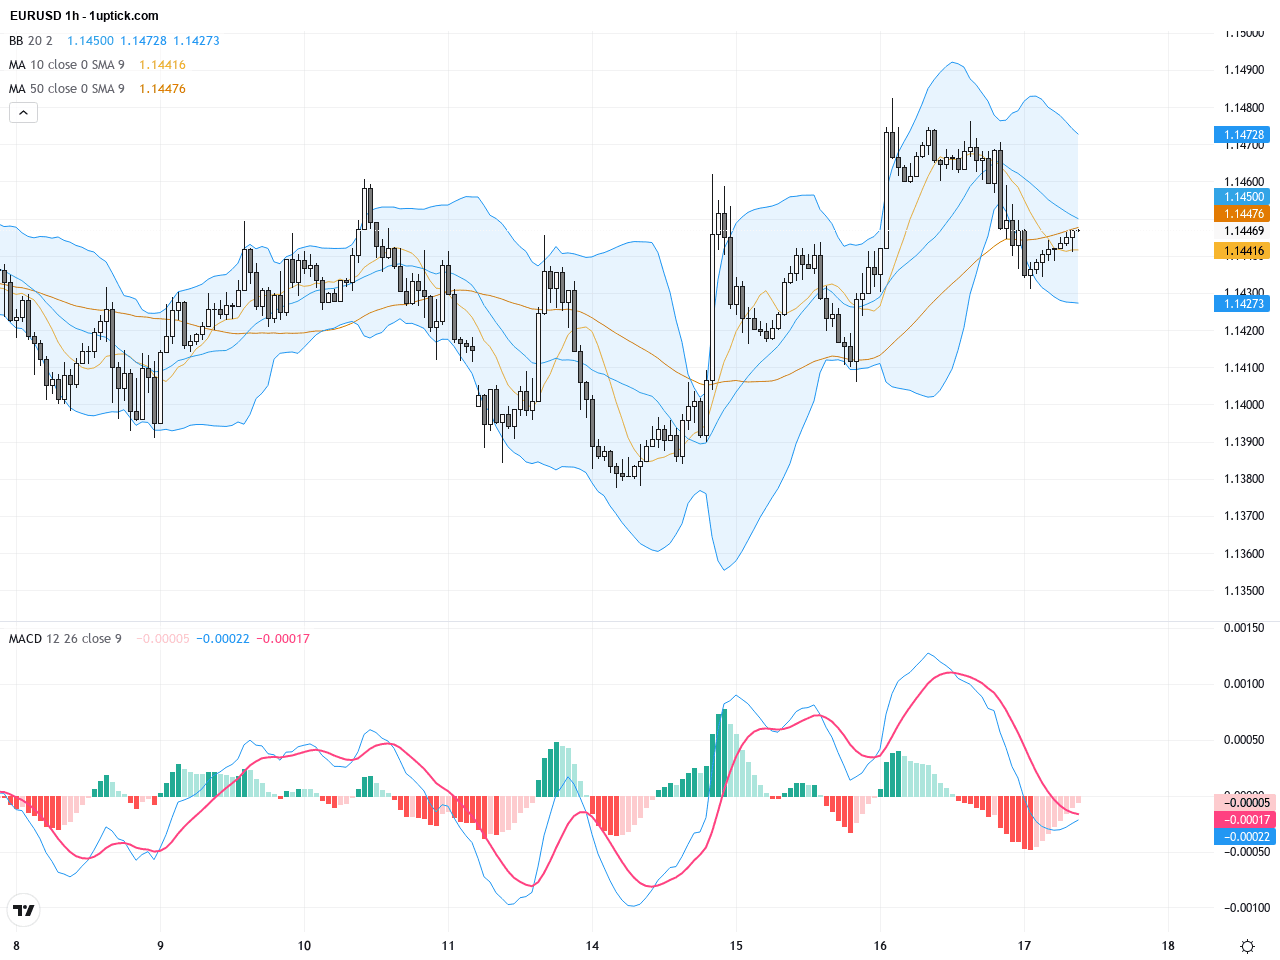
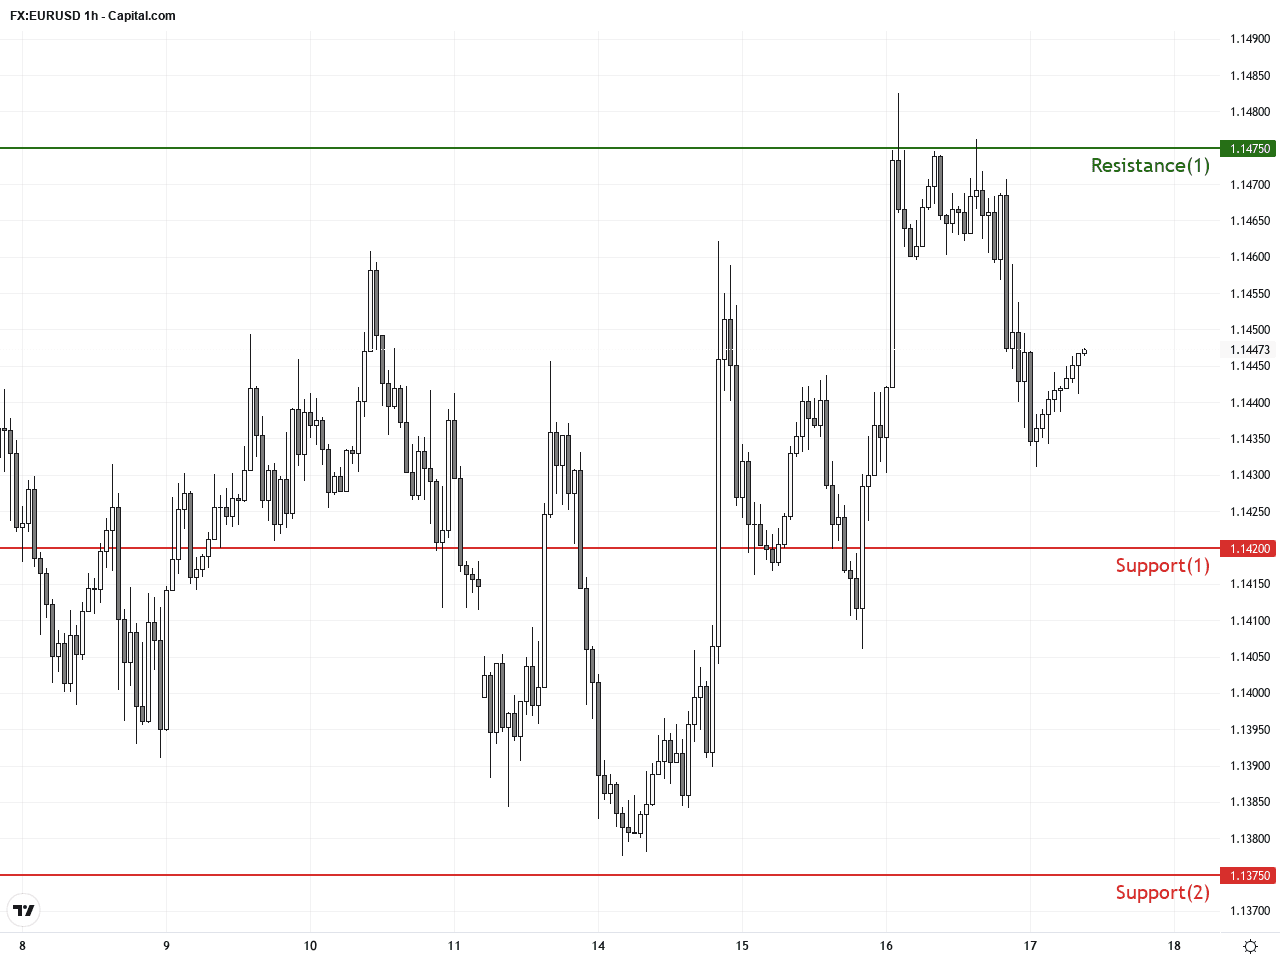
Examining the last five days on the hourly chart, EURUSD fluctuates within a horizontal range of 1.1420 to 1.1475, showing clear sideways movement. The short-term 50 and 200-period moving averages are converging, signaling indecision. A minor bullish MACD crossover suggests emerging short-term momentum. The dominant technical pattern is a rectangle consolidation forming since early July, with a breakout above 1.1475 potentially triggering a bullish move. Conversely, a drop below 1.1420 would likely accelerate downward pressure.
Technical Trend: The current trend of EURUSD is cautiously sideways with an underlying bearish bias. The daily chart remains in a downtrend while short-term movement shows consolidation with possible rebound attempts.
Technically, the daily MACD remains negative, aligned with price trading below the 200-day moving average, signaling a bearish bias. However, the hourly MACD has recently formed a bullish crossover, indicating potential short-term rebound momentum. Price is consolidating within a rectangle pattern, showing market hesitancy but also setting the stage for an impending breakout. Recently, a bullish engulfing candle on the short-term chart suggests buyers are attempting a recovery. Key will be whether price can break past the 1.1475 resistance. Failure to do so may see a retest of support near 1.13.Today’s European session features multiple important economic releases, including Producer Price Index and Harmonised Consumer Price Indices from the Czech Republic and Slovakia, expected to show moderating inflationary pressures. The EU is set to publish May current account data with forecasts for increased surplus, reflecting external demand dynamics. Meanwhile, the US will release key figures such as export/import prices, housing starts, and industrial production, which will influence USD strength. Positive surprises in US data could reinforce the USD’s upward momentum, pushing EURUSD lower. Traders should closely watch data releases between 09:00 and 16:00 GMT+1 to gauge market reaction.
Resistance & Support
The above financial market data, quotes, charts, statistics, exchange rates, news, research, analysis, buy or sell ratings, financial education, and other information are for reference only. Before making any trades based on this information, you should consult independent professional advice to verify pricing data or obtain more detailed market information. 1uptick.com should not be regarded as soliciting any subscriber or visitor to execute any trade. You are solely responsible for all of your own trading decisions.