








 |
| Gold V.1.3.1 signal Telegram Channel (English) |
WTI Crude Oil: U.S. Iran Blockade Spurs Strong Bullish Technical Setup, July 16, 2026
2026-07-16 @ 06:03
Over the past 24 to 48 hours, WTI crude oil has experienced notable volatility, continuing to climb from the July 15 closing price of $79.6. The U.S. reinstated its blockade on Iranian ports, especially targeting the Strait of Hormuz, slowing down shipping activities in this strategic waterway and putting upward pressure on global oil supply concerns.
Simultaneously, Iran’s Revolutionary Guard re-closed the Strait of Hormuz, intensifying fears of an oil supply disruption worldwide, which directly boosted crude prices. The market also noted a 1.7 million barrel drop in U.S. crude inventories, reinforcing the narrative of tightening supply. Although some brief price declines occurred on July 15, the overall trend reflects rising prices amid escalating geopolitical tensions and anticipated supply constraints.
For the average investor, this situation is akin to a traffic jam at a critical highway choke point causing transportation costs to surge and ripple through prices downstream. The dual forces of geopolitical pressure on vital shipping lanes and shrinking stockpiles have combined to propel WTI crude prices higher in the last couple of days.
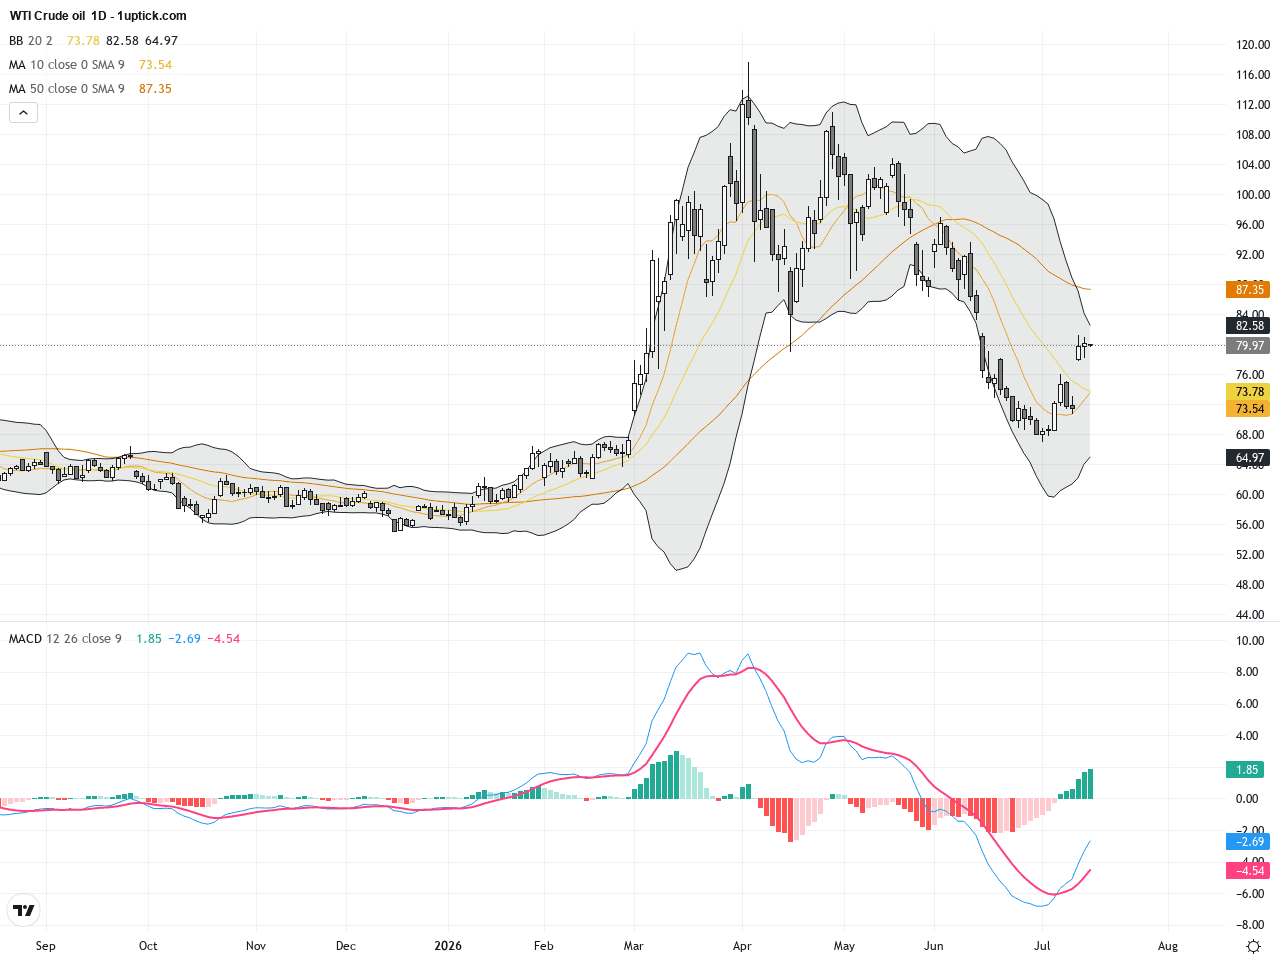
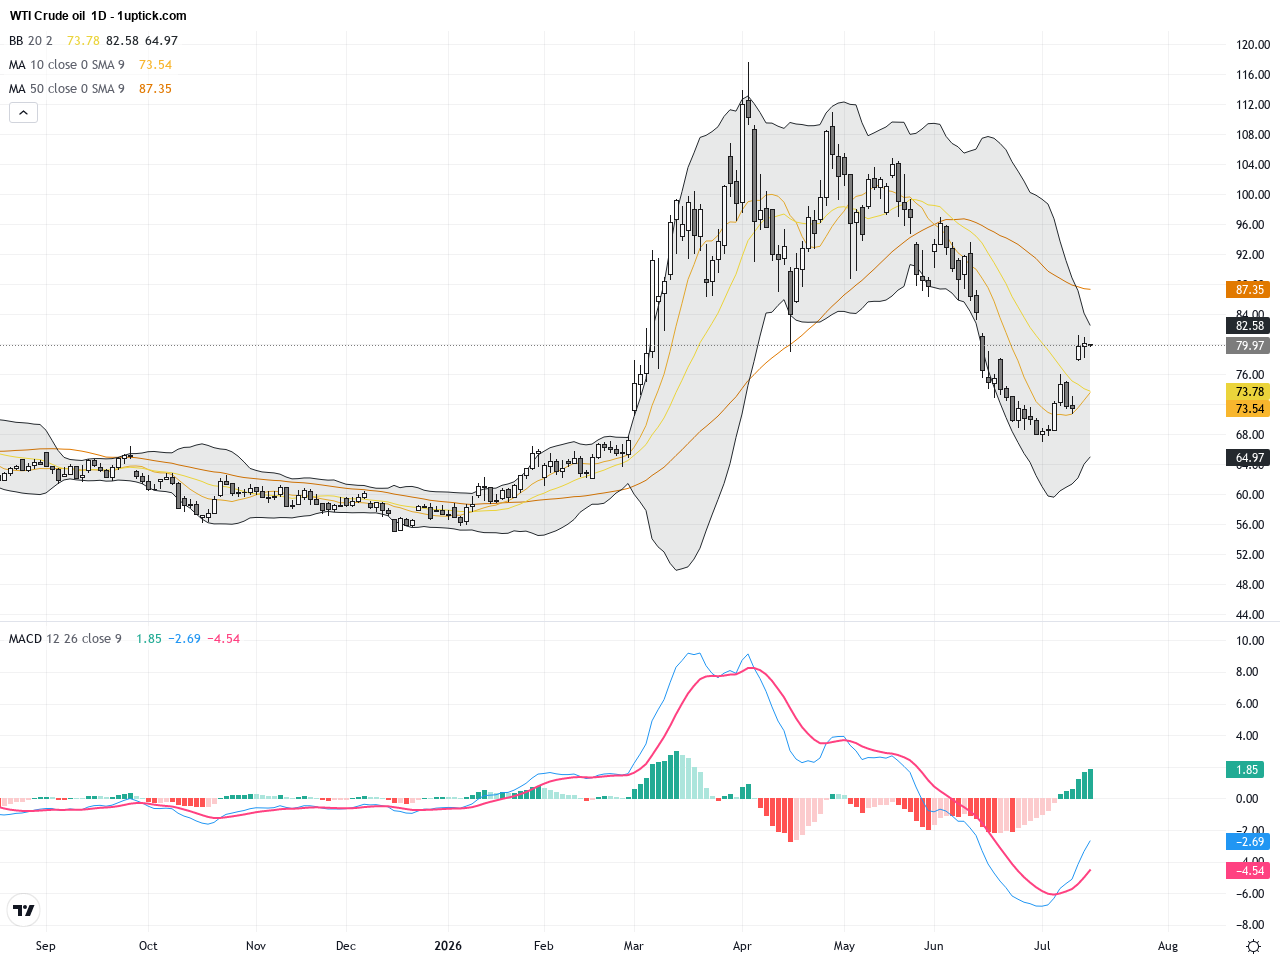
The daily chart shows WTI oil steadily rebounding from mid-June lows and maintaining an upward channel, with prices fluctuating between $79 and $80. The price has consistently broken above and stayed over the 20 and 50-day moving averages, signaling a bullish trend. Bollinger Bands are expanding, indicating increased volatility, while the MACD shows a golden cross affirming strong momentum. This technical setup points to a potential significant breakout if the resistance zone is breached.
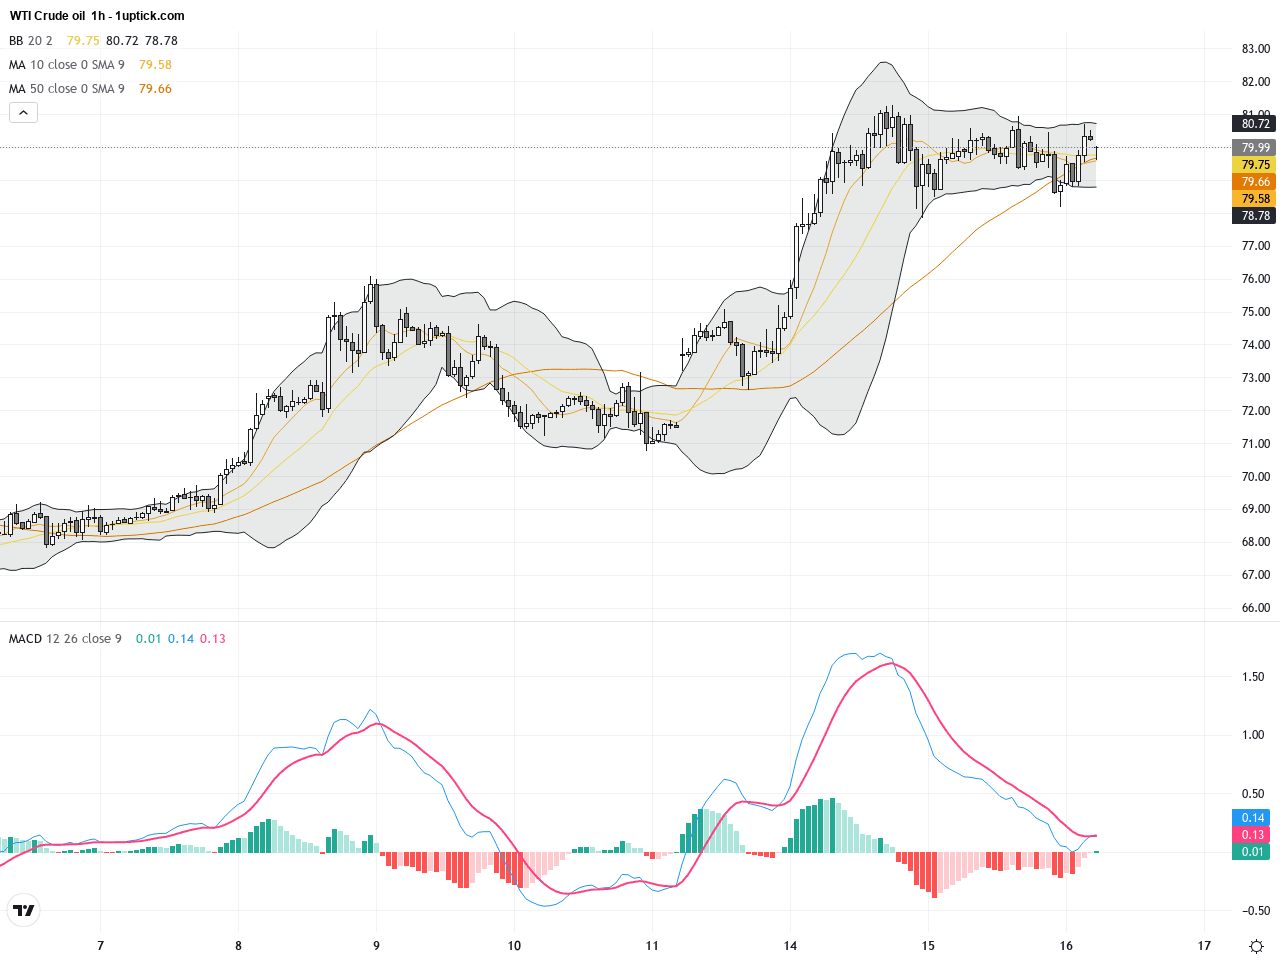
On the hourly chart for the past 3-5 days, WTI has shown multiple short-term rallies and pullbacks, holding above the middle Bollinger Band and using the 50-hour moving average as key support. The MACD remains positive but shows signs of divergence, warning of potential short-term consolidation. An ascending triangle has formed recently; a breakout above the neckline would confirm bullish momentum, whereas failure could lead to price retracement.
Technical Trend: WTI Crude Oil is currently in a decisively bullish trend, consolidating with upward momentum development.
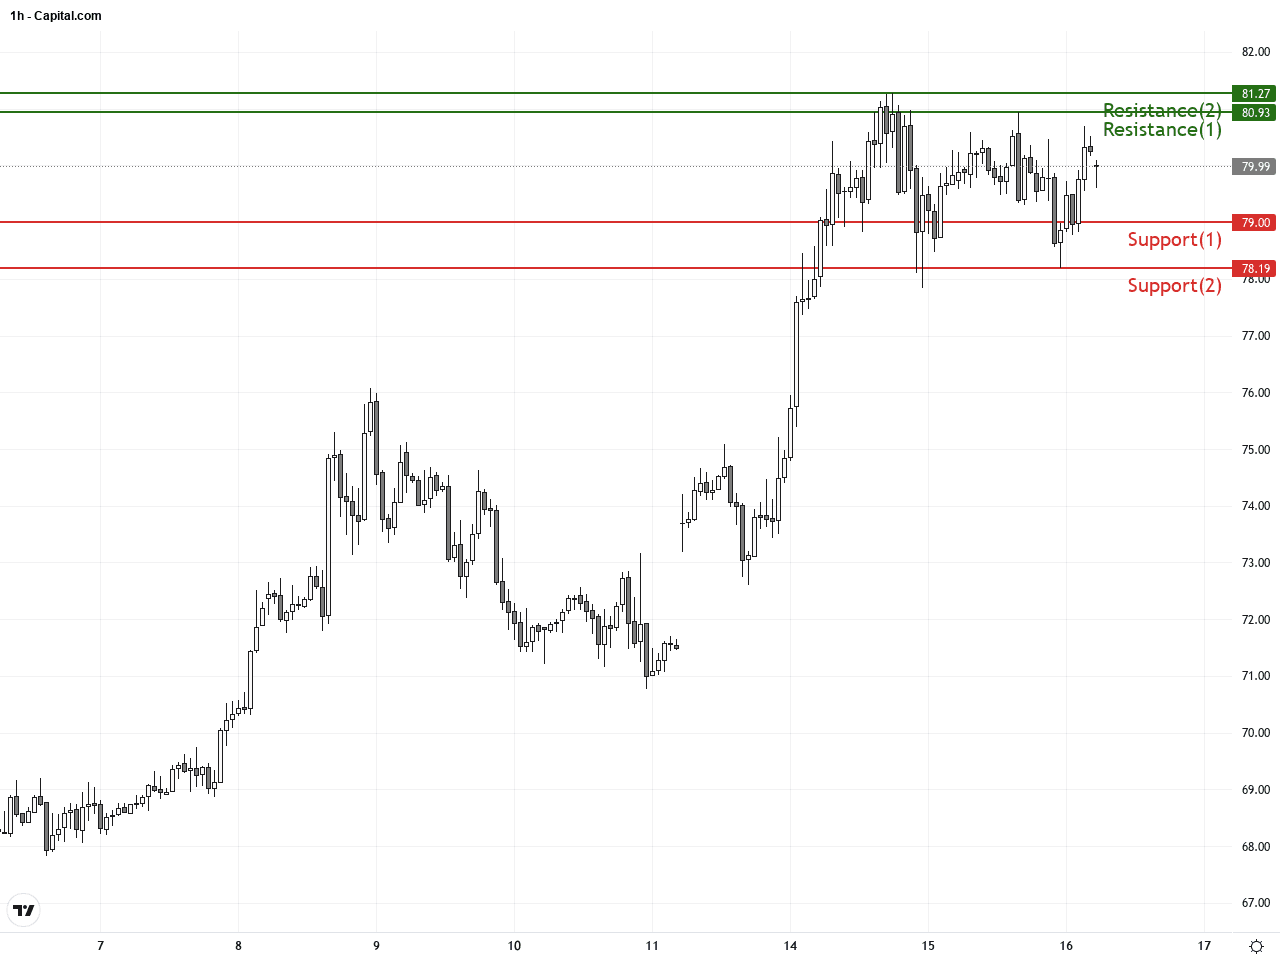
WTI Crude Oil displays a clear bullish technical outlook with strong momentum confirmed by the daily MACD golden cross and expanding Bollinger Bands. The ascending triangle on the hourly chart suggests a possible breakout is imminent. Volume trends and USD strength should also be monitored for confirmation. Fundamentally and technically, WTI presents a high-probability trade opportunity to the upside with careful attention on key resistance levels.There are no significant or directly relevant economic events scheduled today that would impact WTI Crude Oil. Current price action remains primarily influenced by geopolitical developments and supply concerns.
Resistance & Support
Run Live WTI Crude Oil Analysis
The above financial market data, quotes, charts, statistics, exchange rates, news, research, analysis, buy or sell ratings, financial education, and other information are for reference only. Before making any trades based on this information, you should consult independent professional advice to verify pricing data or obtain more detailed market information. 1uptick.com should not be regarded as soliciting any subscriber or visitor to execute any trade. You are solely responsible for all of your own trading decisions.