








 |
| Gold V.1.3.1 signal Telegram Channel (English) |
EURUSD Breaks Critical Resistance: Technical Patterns and Trading Outlook, July 20, 2026
2026-07-20 @ 09:01
Over the past 24 to 48 hours, the EUR/USD pair has traded cautiously with limited volatility, closing yesterday near 1.14336. The market is in a holding pattern awaiting the upcoming US Consumer Price Index (CPI) release, while keeping a close eye on Federal Reserve officials’ comments.
Despite escalating tensions in the Middle East, the US dollar has weakened overall, pushing the Euro above the 1.1350 to 1.1450 range. Market sentiment favors the European Central Bank’s expectation to maintain a more aggressive tightening stance than the Fed, which is underpinning the Euro’s strength.
For the average investor, this means there is short-term pressure on the dollar, lifting the Euro’s appeal in forex markets. While uncertainty remains, the Euro’s resilience so far reflects a defensive posture for Euro-denominated assets. Volatility may rise further as investors await crucial US economic data to guide the next directional move.
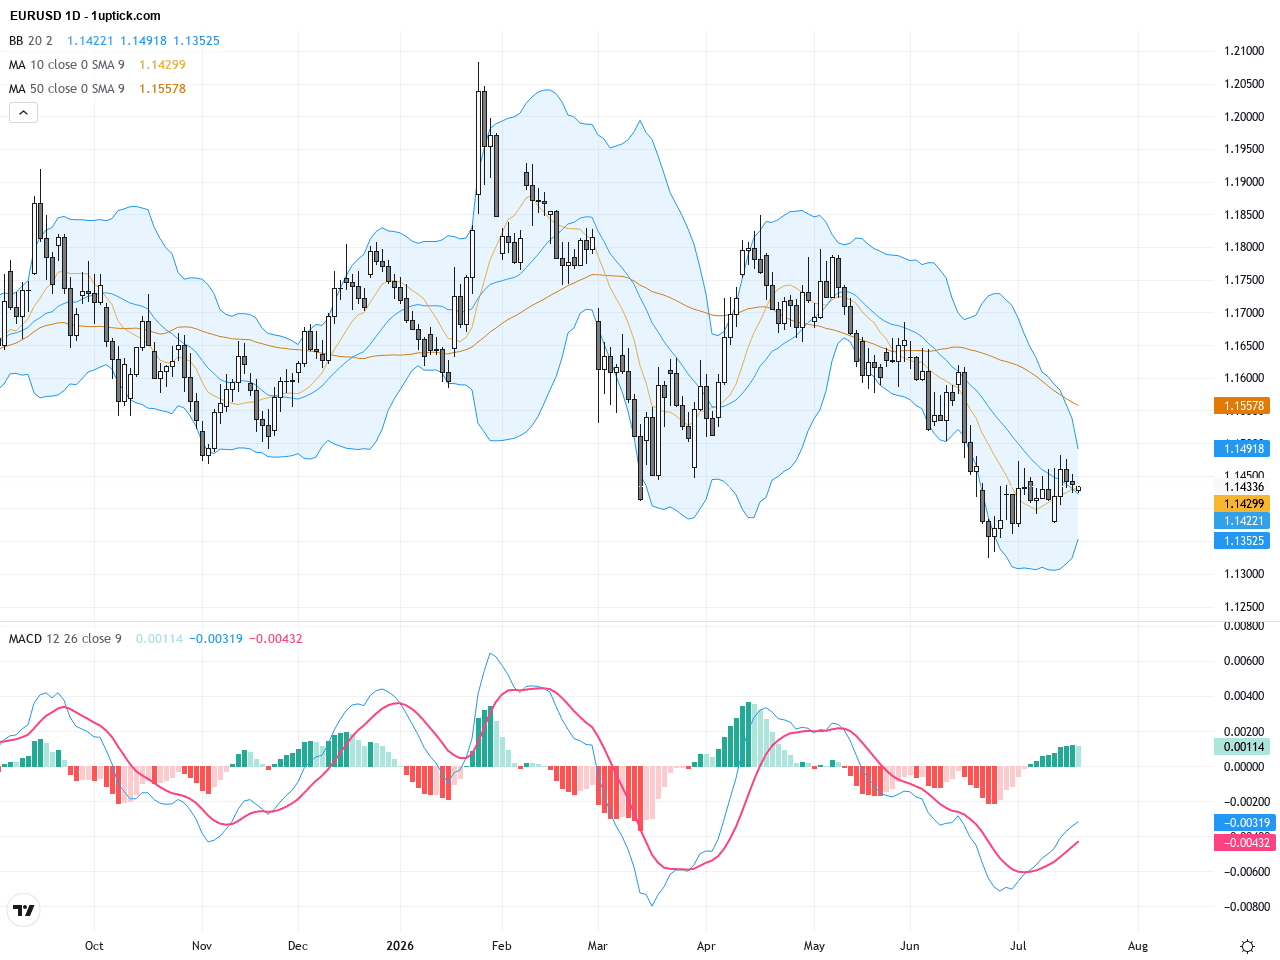
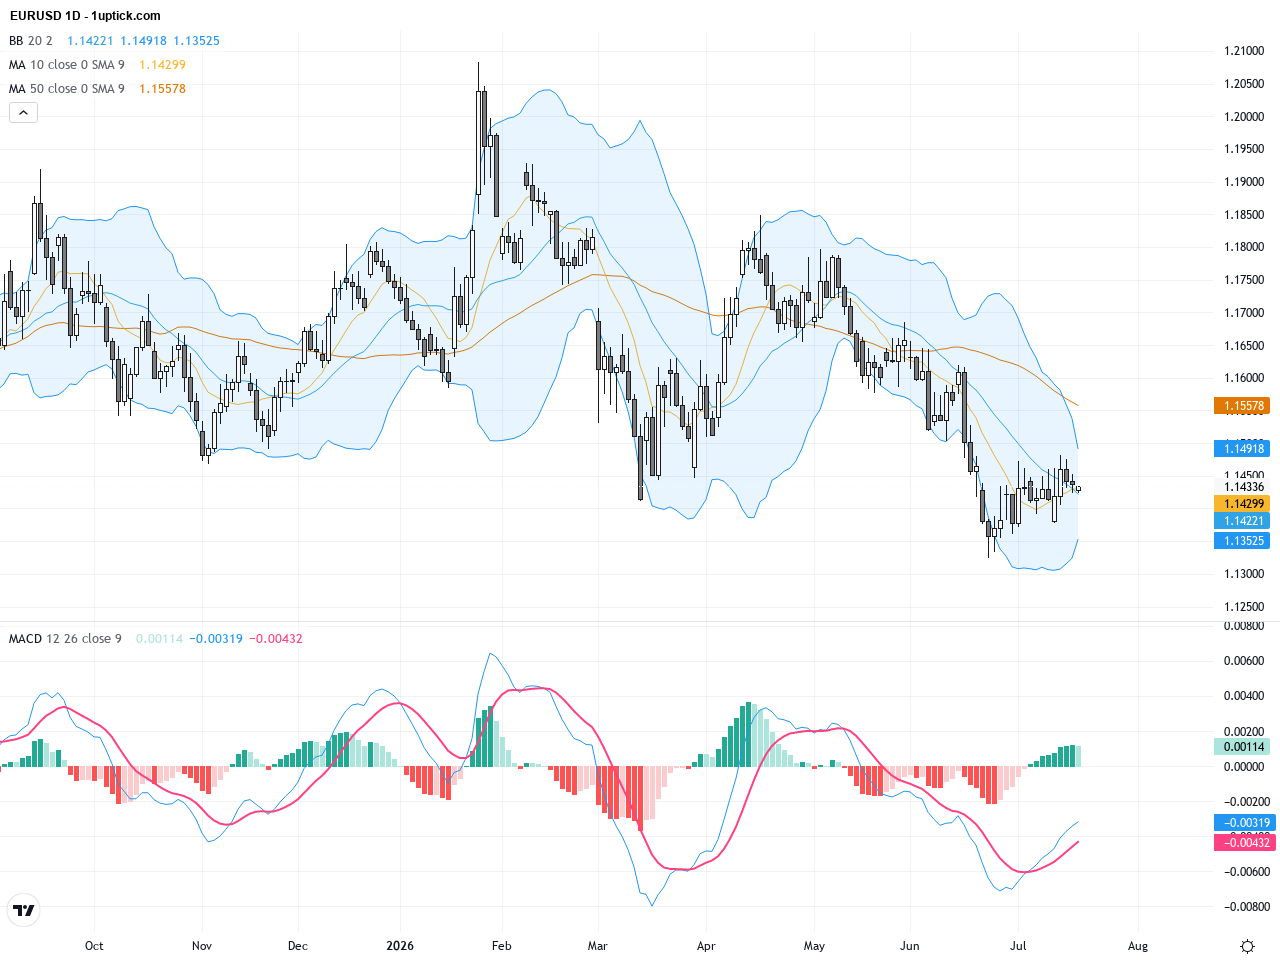
The daily chart reveals a longer-term oscillating uptrend, with EURUSD price remaining below its 50-day and 200-day moving averages—signaling an overall bearish medium to long term trend. Recently, the price has tested the lower boundary of an expanding wedge pattern between 1.1350 and 1.1500 multiple times. Bollinger Bands narrowing suggest upcoming volatility expansion. The MACD is nearing a bullish crossover, indicating accumulating momentum, though confirmation is pending. Overall, daily technicals suggest short-term room for recovery with key resistance near 1.1500.
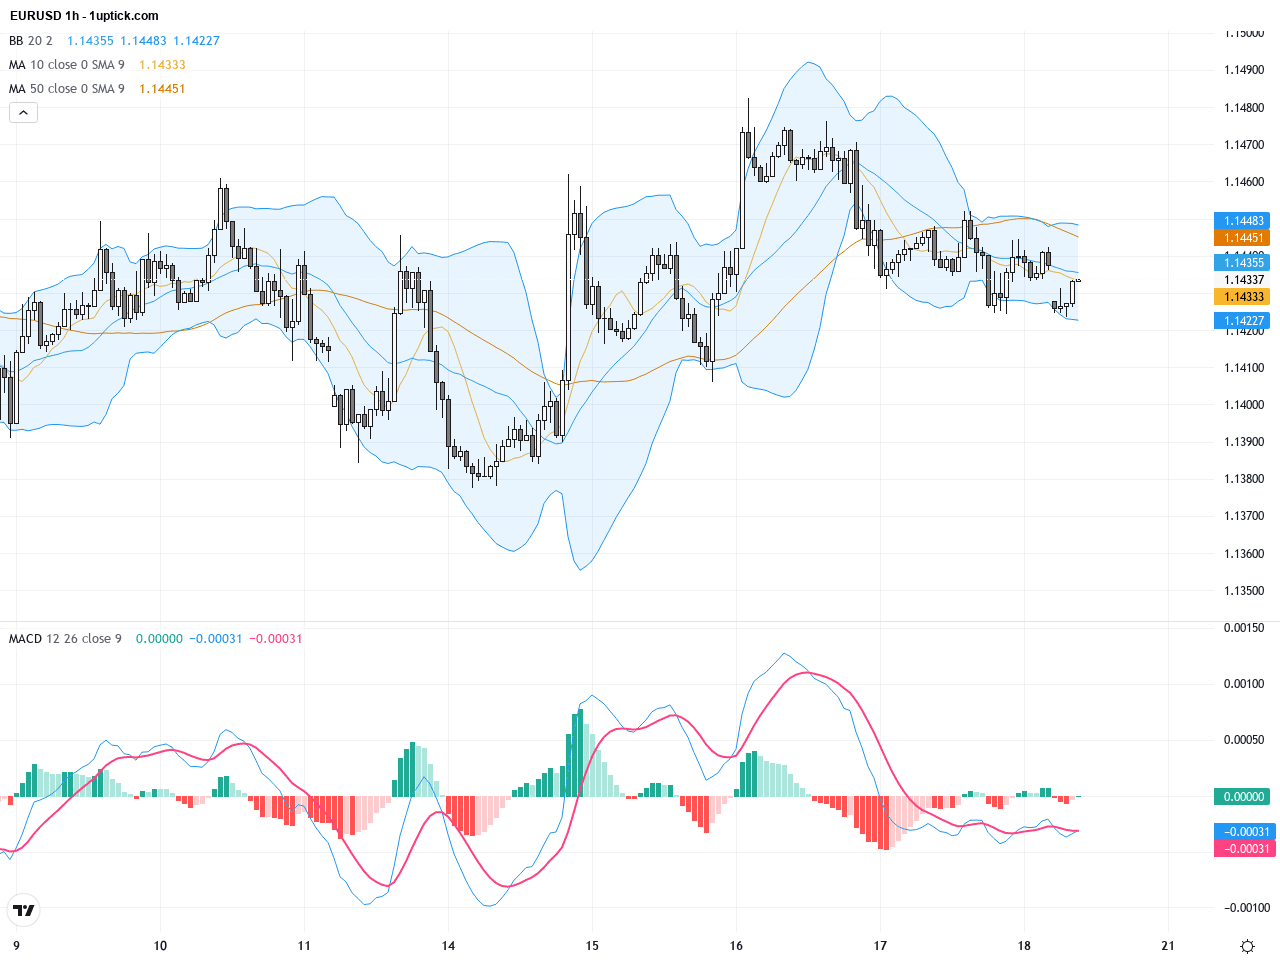
Examining the last 3-5 days on the hourly chart, EURUSD shows a clear short-term bounce, forming a double bottom and breaking above the 20 and 50 hourly moving averages. Bollinger Bands are widening, signaling increased volatility. The MACD has turned positive from negative territory, demonstrating strong short-term momentum. Notably, a bullish engulfing candle developed on July 19 afternoon, strongly signaling near-term buying pressure likely to sustain in the next 24 hours. Short-term traders should watch for a sustained move above 1.1450.
Technical Trend: Trend Direction: Cautiously Bullish
From a technical perspective, EURUSD shows clear short-term bullish momentum, supported by MACD and Bollinger Bands suggesting potential for a breakout. The expanding wedge pattern on the daily chart represents a key decision zone: a move above 1.1500 could spark further gains. The recent bullish engulfing candle on the hourly chart provides immediate confirmation of buyers’ strength. Combined with ongoing USD weakness, cautious long entries with well-placed stops could be effective strategies.Today’s GMT+1 economic calendar features several Polish and Canadian releases, including industrial production and construction output, which are unlikely to have a direct significant impact on EURUSD. There are no major US data events scheduled, so EURUSD movements will mostly depend on market sentiment and macroeconomic outlook. Traders should continue to monitor ECB and Fed policy signals, which remain primary drivers for EURUSD price action.
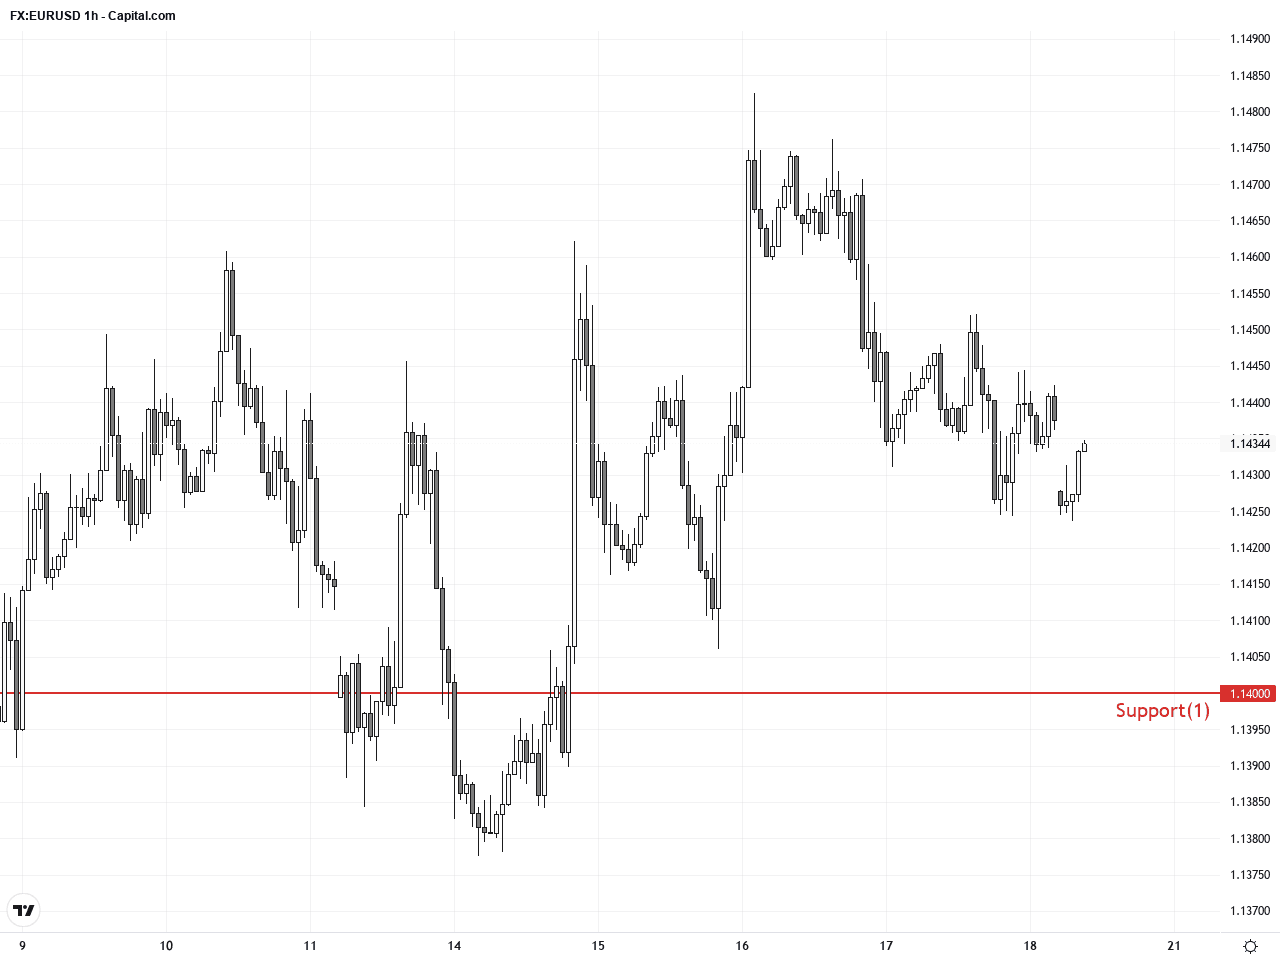
Resistance & Support
The above financial market data, quotes, charts, statistics, exchange rates, news, research, analysis, buy or sell ratings, financial education, and other information are for reference only. Before making any trades based on this information, you should consult independent professional advice to verify pricing data or obtain more detailed market information. 1uptick.com should not be regarded as soliciting any subscriber or visitor to execute any trade. You are solely responsible for all of your own trading decisions.