

 |
| Gold V.1.3.1 signal Telegram Channel (English) |
WTI Crude Oil: Middle East Tensions Spark Supply Concerns Amid Strong Technical Uptrend, July 21, 2026
2026-07-21 @ 06:03
Over the past 24 to 48 hours, WTI crude oil exhibited significant volatility, closing yesterday at $82.48. The market has been pushed higher amid escalating tensions in the Middle East, with Brent crude surpassing the $90 mark. The recent price surge is primarily driven by increased concerns over supply disruptions in the region, notably Chevron’s temporary halt of production at its Petronius Gulf platform, tightening global oil supply. Furthermore, Ukrainian strikes have sidelined over 58% of Russian refining capacity, exacerbating supply constraints and supporting the upward price momentum.
However, reports of potential 10-day ceasefire talks between the US and Iran have eased some risk premiums, leading to a $550 billion gain in US stock markets and a brief dip in oil prices. Despite this, ongoing supply concerns keep crude prices elevated. This sequence of events illustrates how geopolitical tensions directly impact energy prices, creating a volatile environment for investors. For the average trader or investor, this means navigating a market marked by supply uncertainty and potentially sharp price swings in the near term.
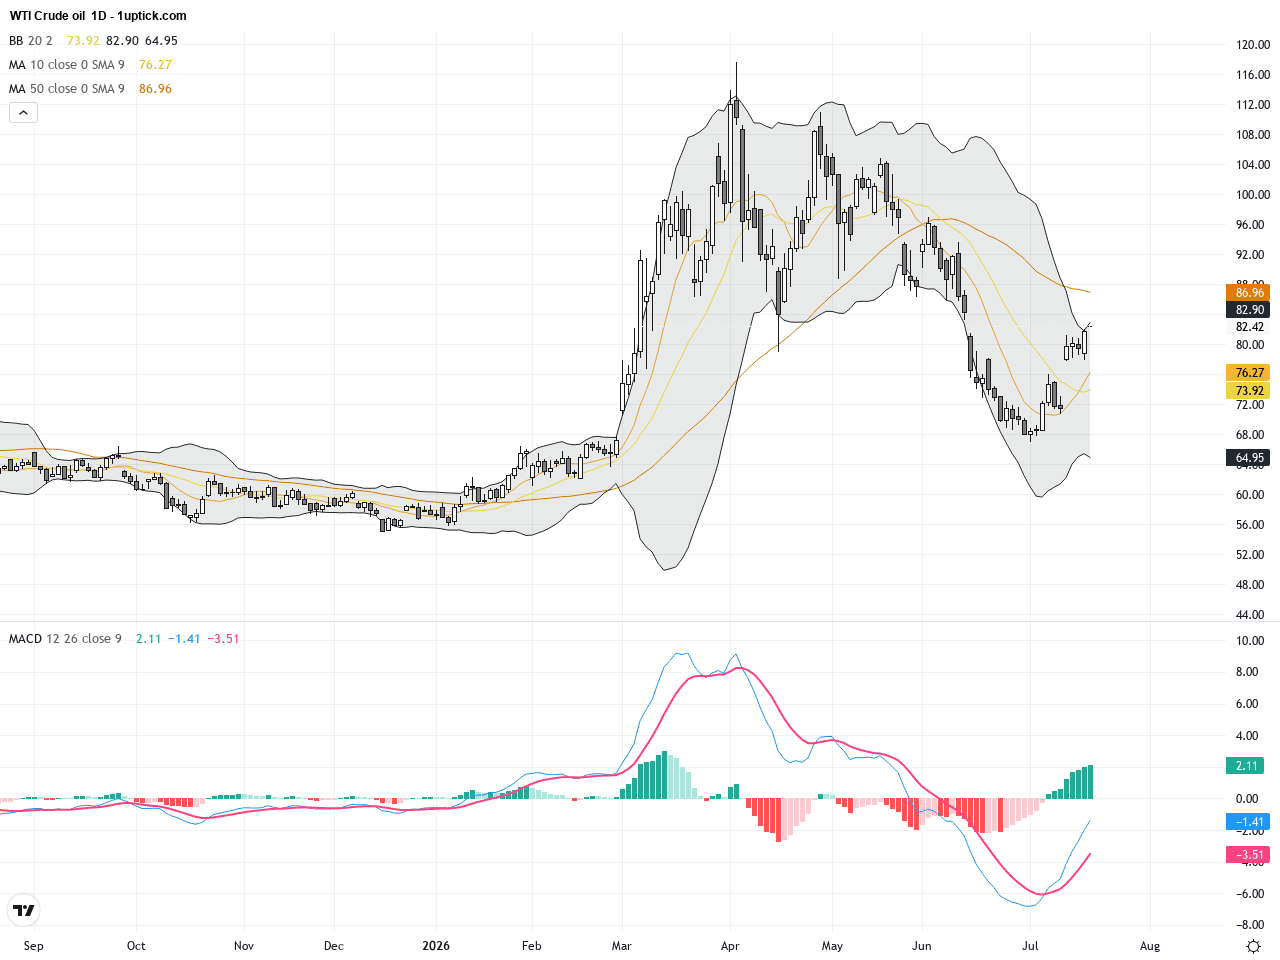
The daily chart reveals a clear uptrend in WTI Crude Oil, with prices steadily climbing from around $75 to above $82 recently. The price has broken above significant moving averages, while Bollinger Bands indicate expanding volatility. The MACD shows strong bullish momentum with a sustained positive crossover, signaling a solid mid-term uptrend. This structure implies firm support and growing bullish conviction over the recent weeks, favoring continued upside exploration.
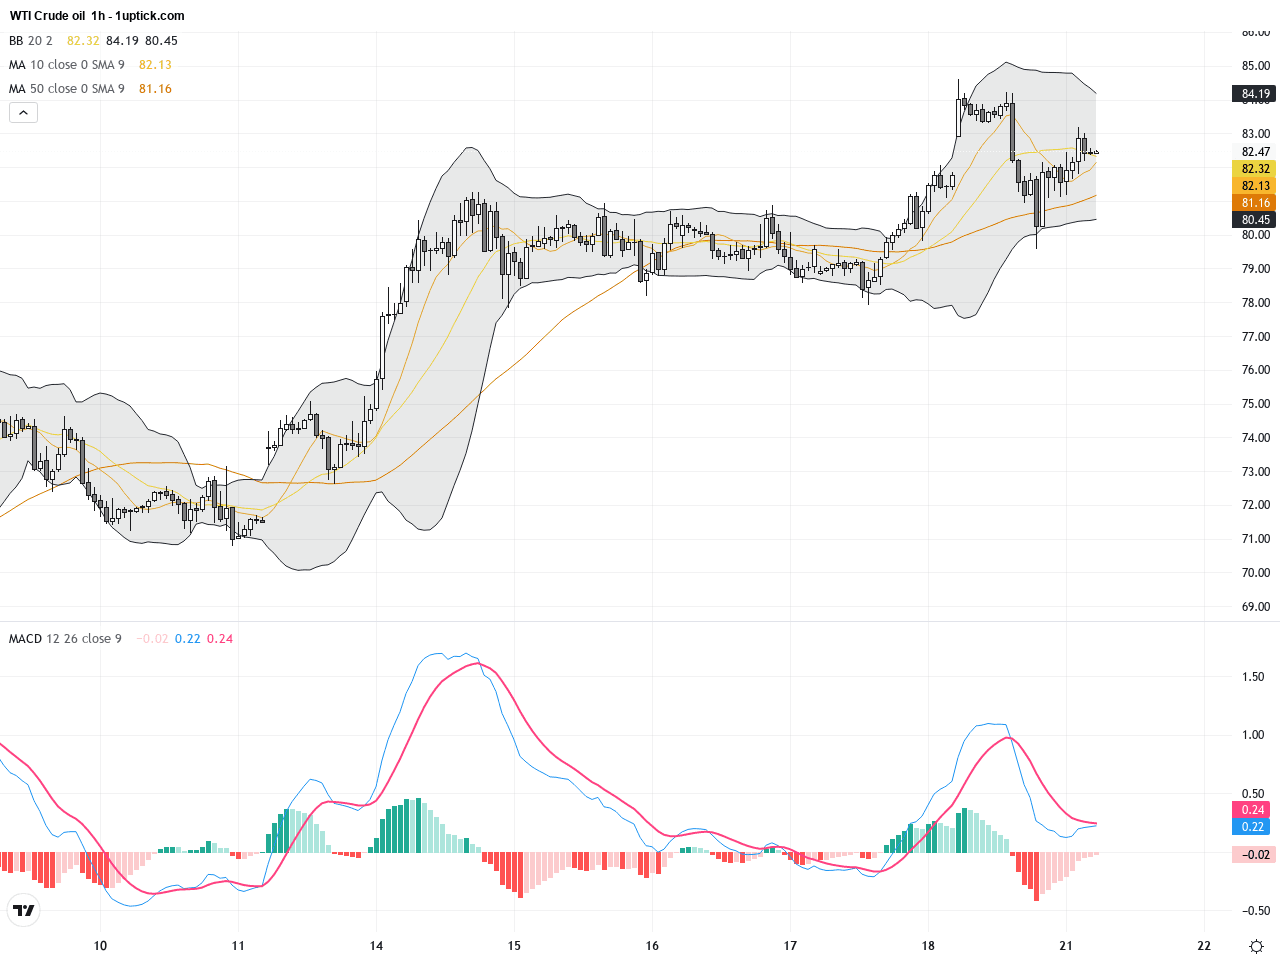
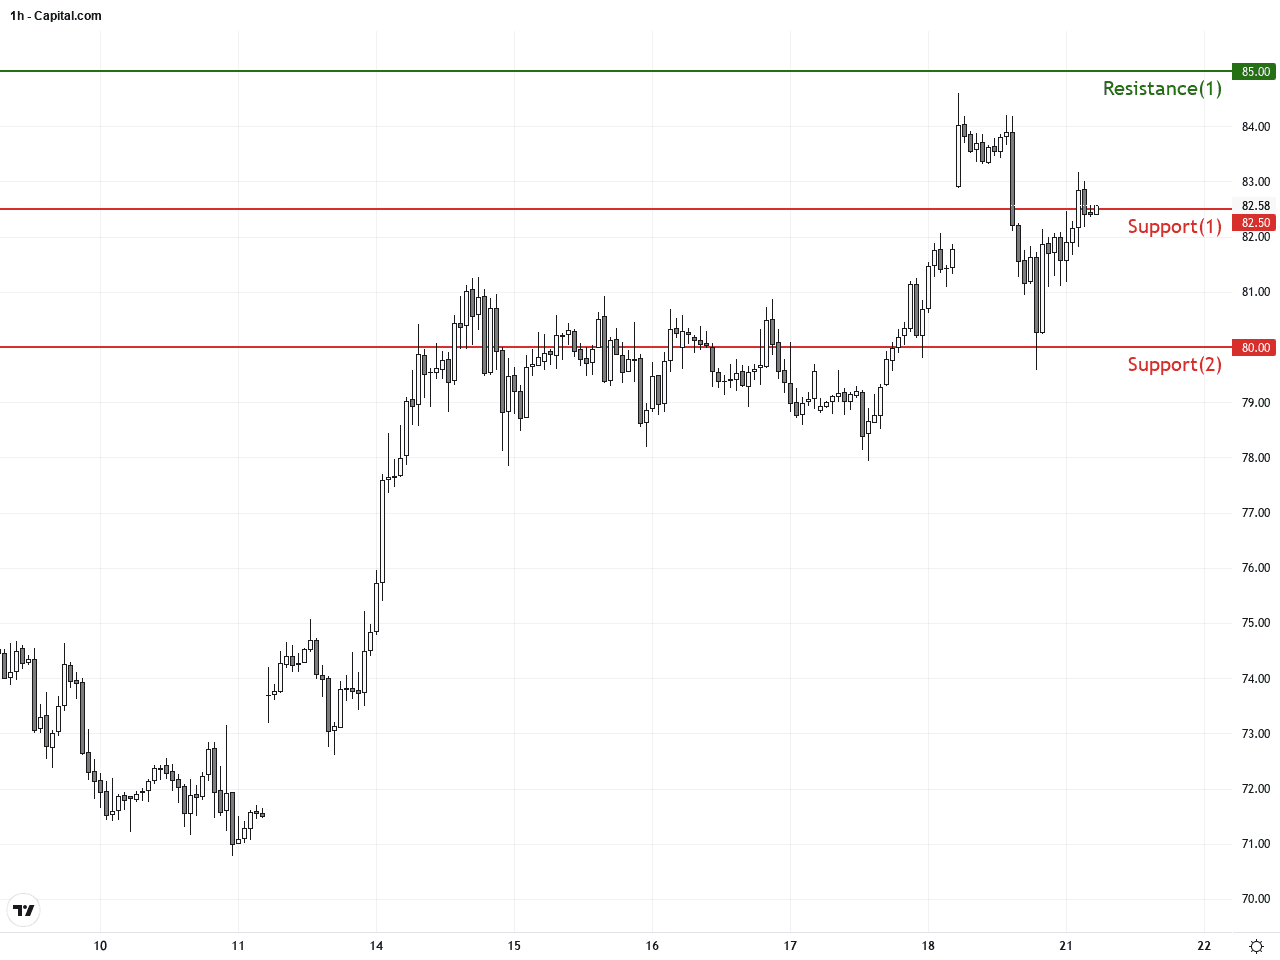
The hourly chart for the past 5 days illustrates a volatile tug-of-war, with short-term pullbacks quickly followed by rebounds. Moving averages are aligned bullishly, but price struggles near the upper Bollinger Band, denoting near-term resistance. A recent MACD golden cross and a bullish engulfing candlestick pattern suggest momentum is poised to continue upwards over the next 24 hours.
Technical Trend: WTI Crude Oil is currently in a strong and decisive bullish trend characterized by increased volatility.
Technically, WTI Crude Oil’s daily chart confirms a strong bullish trend supported by a positive MACD alignment and a recent bullish engulfing candle signaling short-term buying strength. The price is likely to test recent highs, though near-term resistance should be monitored closely for potential pullbacks. Increasing volume corroborates this bullish setup, increasing the probability of breakouts.There are no significant or directly relevant economic events today in the GMT+1 timezone impacting WTI Crude Oil. The price driver remains geopolitical tensions and supply-side developments rather than scheduled economic data.
Resistance & Support
Run Live WTI Crude Oil Analysis
The above financial market data, quotes, charts, statistics, exchange rates, news, research, analysis, buy or sell ratings, financial education, and other information are for reference only. Before making any trades based on this information, you should consult independent professional advice to verify pricing data or obtain more detailed market information. 1uptick.com should not be regarded as soliciting any subscriber or visitor to execute any trade. You are solely responsible for all of your own trading decisions.