

 |
| Gold V.1.3.1 signal Telegram Channel (English) |
GBPUSD Technical Analysis & Trading Outlook: Key Support at 1.33 Amid US-Europe Geopolitical Risks, July 24, 2026
2026-07-24 @ 13:01
Over the past 24 to 48 hours, the GBP/USD pair exhibited notable volatility, slightly dipping below yesterday’s closing price of 1.33105, reflecting a generally weaker trend. The market’s movement was primarily driven by two key factors: strong US economic data bolstering the US Dollar Index (DXY), and rising oil prices fueled by escalating geopolitical tensions in the Middle East, which dampened risk appetite.
Recent UK inflation data came in cooler than expected, putting additional pressure on the pound and keeping GBP/USD below the 1.3400 mark. In the US, robust retail sales and lower jobless claims reinforced expectations the Federal Reserve may maintain its higher interest rate stance for longer, thereby supporting the US dollar. This backdrop curbed confidence in the pound, resulting in underperformance for the currency pair.
For the average investor, the recent market action feels like a “double test” from economic data and geopolitical risk. Strong US economic resilience paired with rising energy prices amid Middle East tensions has reduced overall risk appetite, making it challenging for the pound to rebound. Investors should carefully evaluate global economic indicators alongside emerging geopolitical developments to manage currency risk effectively.
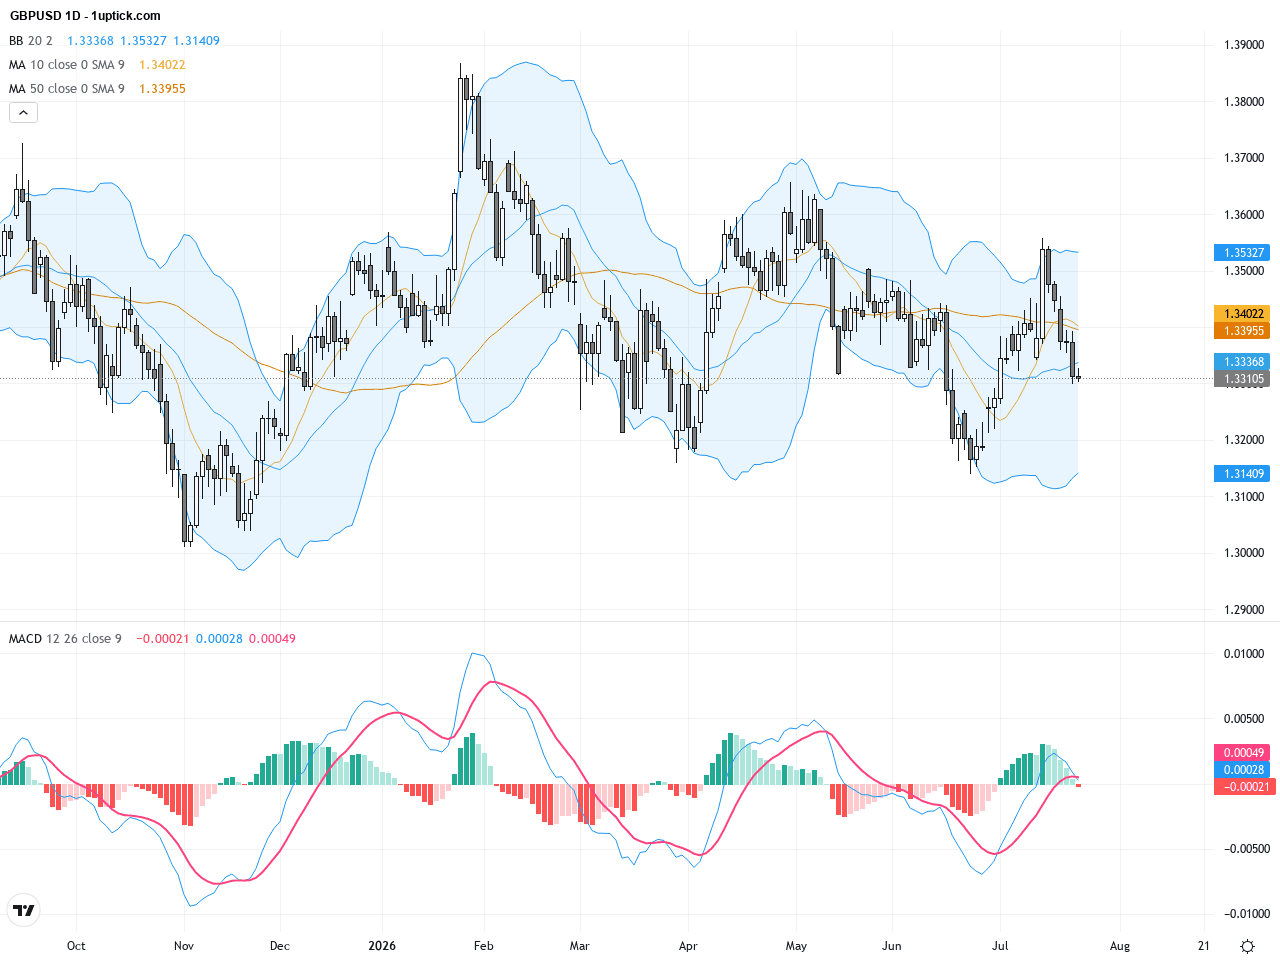
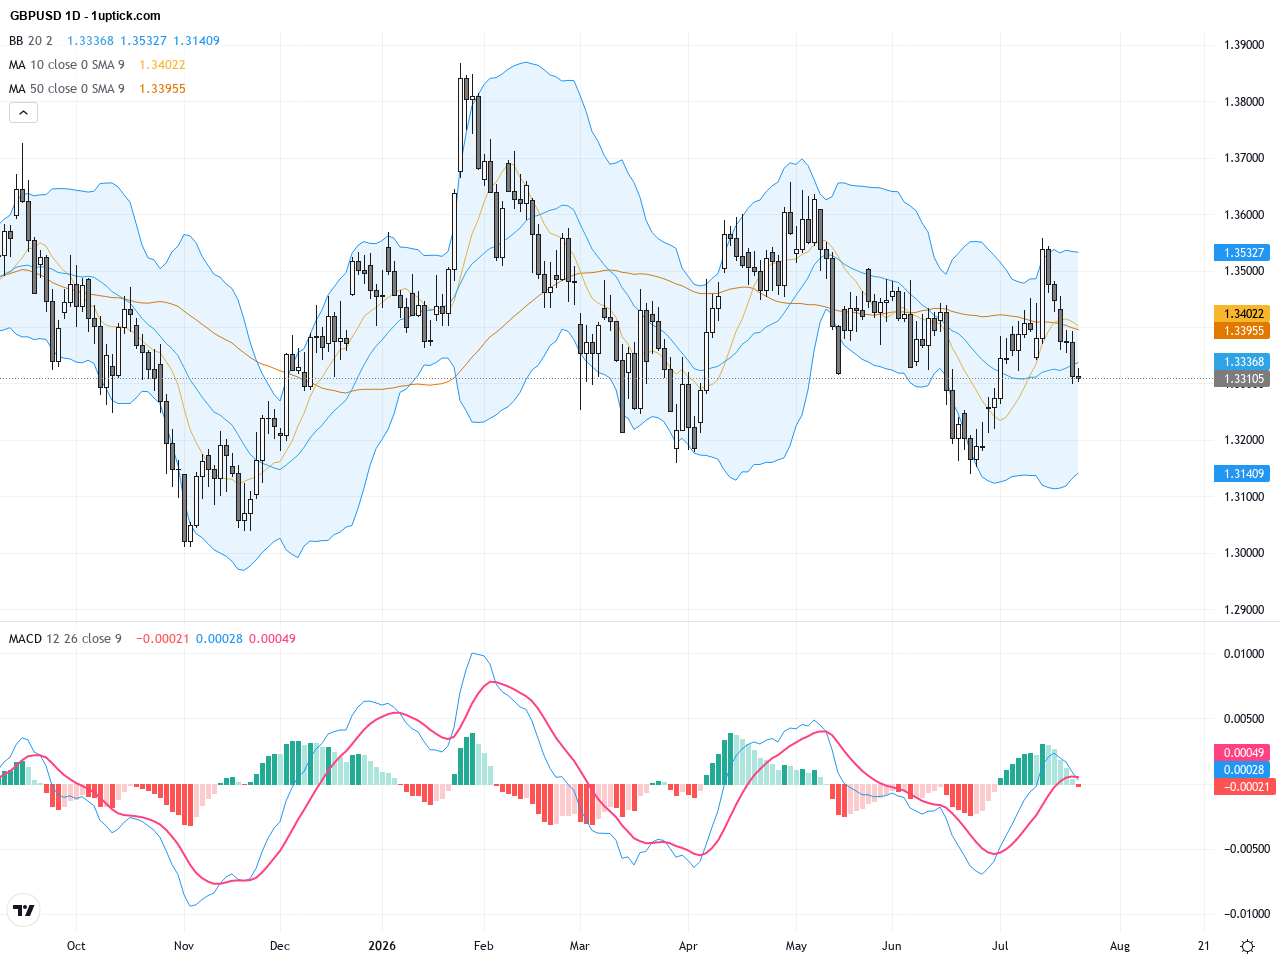
The daily chart reveals a downtrend for GBPUSD since early 2026, with recent prices consolidating around 1.33 and failing to break the 50-day and 200-day moving averages near 1.34. The Bollinger Bands are contracting but skewed lower, indicating reduced volatility but a risk of downward breakout. The MACD remains in negative territory with a mild rebound signal, implying a potential short-term bounce amid an overall bearish medium-term trend.
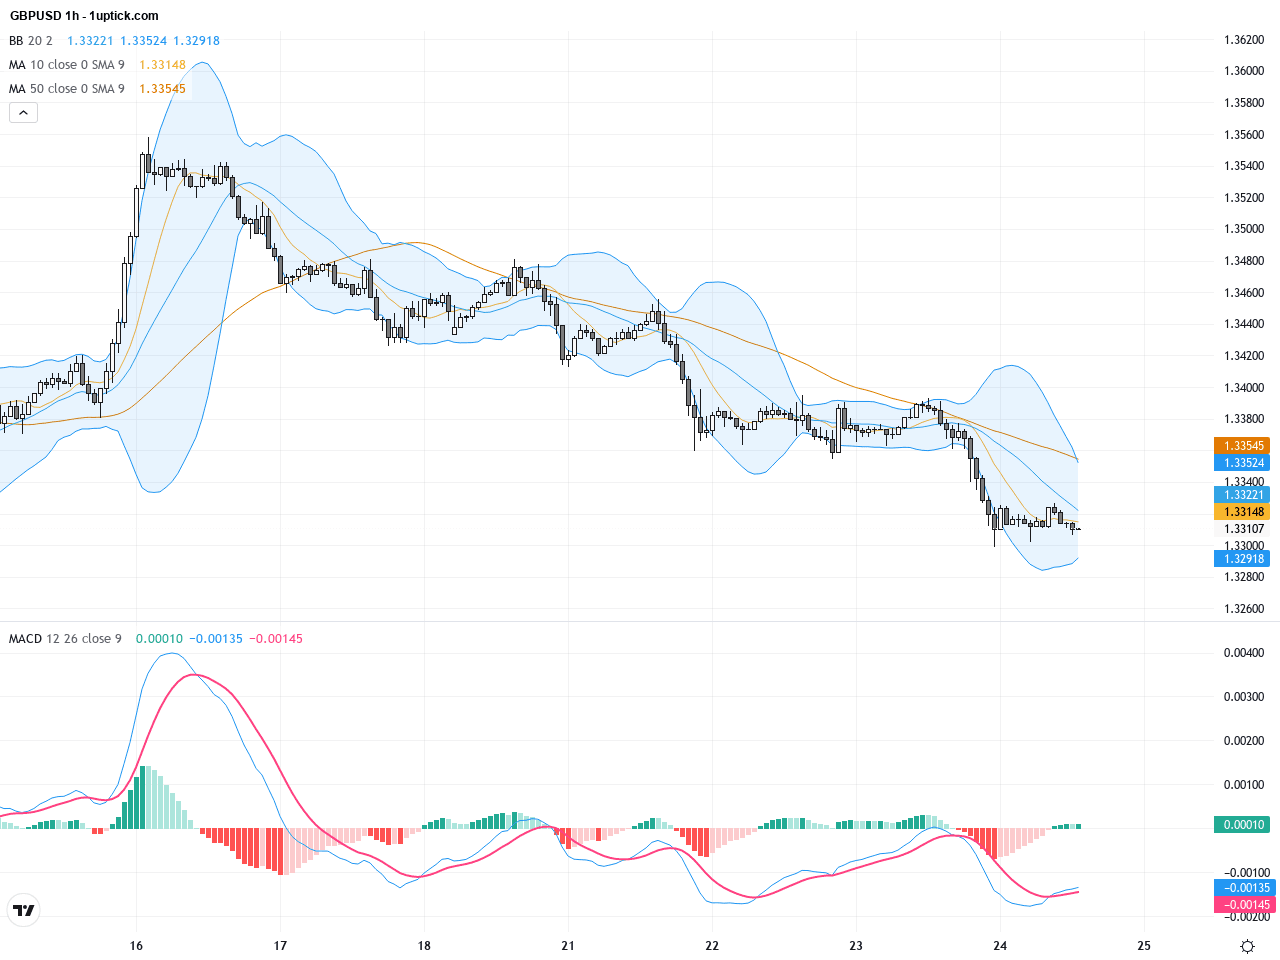
The hourly chart over the past 3 to 5 days shows GBPUSD in a downtrend with prices repelled by the 20-hour moving average. There have been multiple tests of the 1.33 support level without clear reversal. Prices oscillate around the Bollinger Band midline, but a bullish engulfing candlestick has recently formed, suggesting a possible short-term rebound within the next 24 hours. The MACD displays a bottom divergence, hinting at momentum shift potential.
Technical Trend: GBPUSD currently exhibits a cautiously bearish trend with signs of short-term rebound potential, trading in a volatile sideways to downtrend pattern.
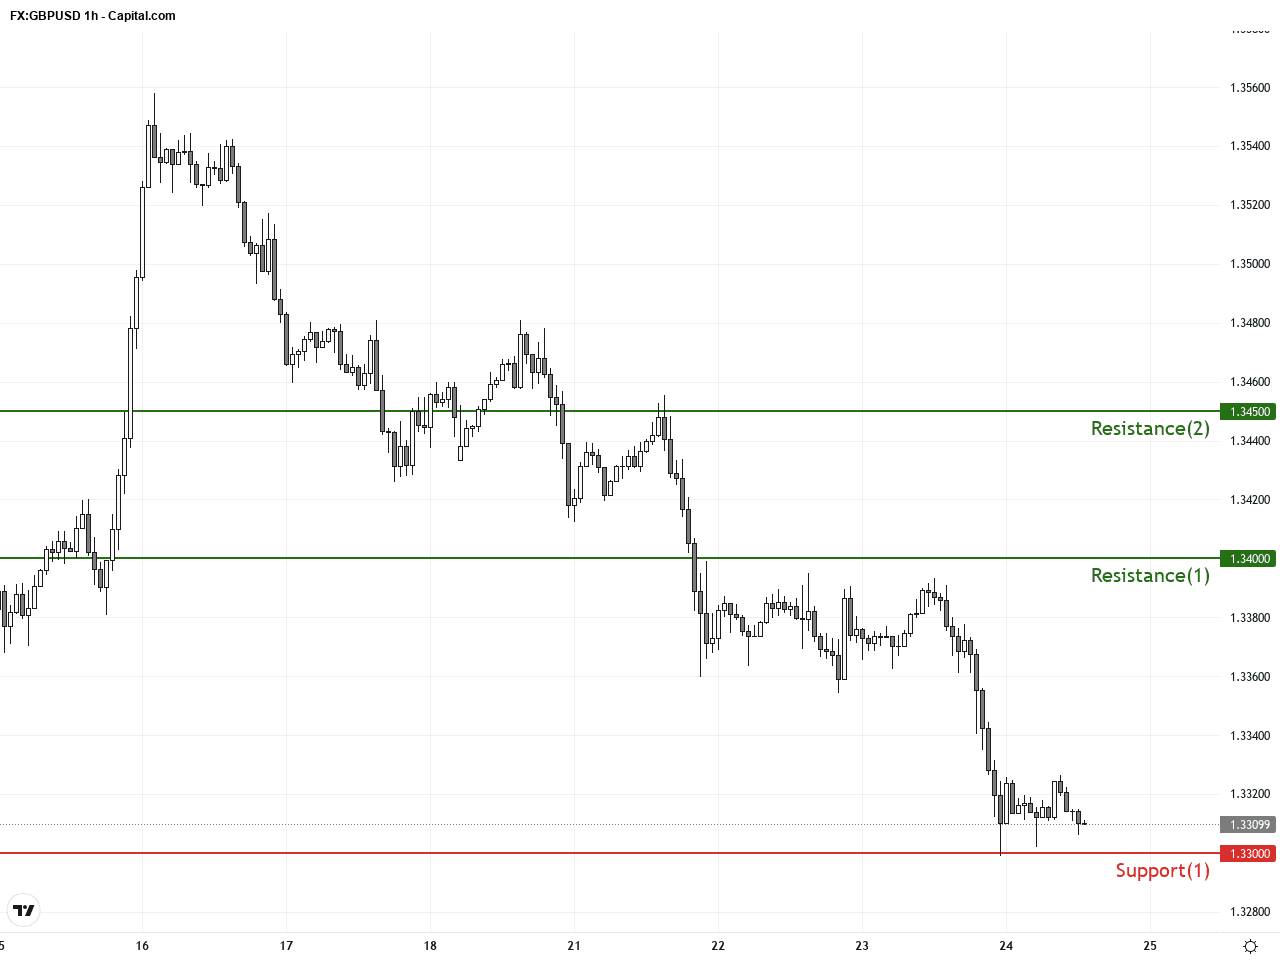
Technically, GBPUSD is positioned at a critical support zone near 1.33. The daily chart’s ongoing downtrend signals bearish bias, yet MACD bottom divergence and the hourly bullish engulfing pattern signal a potential short-term bounce. Traders should watch the 1.34 resistance as a breakout level that could pivot the trend bullish. Volume is subdued, so confirmation via momentum surges would be vital for entering trades with higher confidence.Today’s economic calendar highlights UK retail sales data at 08:00 GMT+1, directly relevant to GBPUSD, with forecasts of 2.4% y/y growth and -0.2% m/m decline. Better-than-expected retail sales may support the pound, while weaker figures could further pressure the currency. Additional relevant data include US manufacturing and services PMI, potentially impacting dollar strength. No major geopolitical events are scheduled today, so focus remains on economic indicators for short-term price impact.
Resistance & Support
The above financial market data, quotes, charts, statistics, exchange rates, news, research, analysis, buy or sell ratings, financial education, and other information are for reference only. Before making any trades based on this information, you should consult independent professional advice to verify pricing data or obtain more detailed market information. 1uptick.com should not be regarded as soliciting any subscriber or visitor to execute any trade. You are solely responsible for all of your own trading decisions.