

 |
| Gold V.1.3.1 signal Telegram Channel (English) |
US Initial Jobless Claims Hit Lowest Point Since 1969, Highlighting Remarkable Labor Market Strength
2026-07-24 @ 13:03
US Jobless Claims Hit Historic Low, Signaling Labor Market Muscle
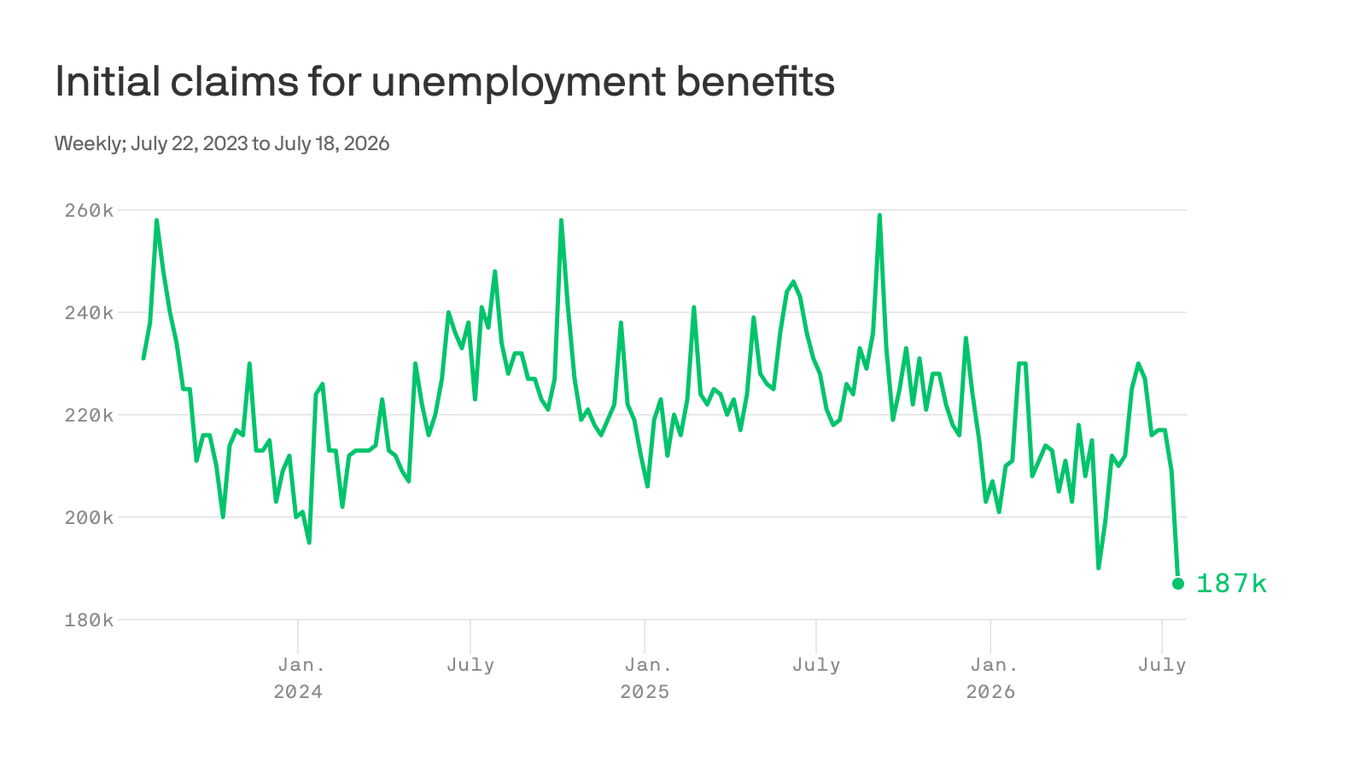
As of mid-July, initial filings for unemployment benefits in the US plunged to 187,000, marking the lowest figure since September 1969. Considering today’s much larger workforce, this is a striking sign of labor market strength. While there’s some evidence hiring is slowing, companies are clearly holding onto their workers tightly, avoiding layoffs.
Continuing claims also edged down slightly to about 1.8 million, reinforcing that unemployment remains contained. This steady employment base underpins consumer spending power, a vital part of the economic foundation.
Currency and Fed Policy Implications
Such robust labor data is an unequivocal positive for the US dollar. The surprisingly low claim numbers have diminished market expectations for near-term Fed rate cuts. This keeps front-end Treasury yields elevated and draws investment capital to the dollar, buoying it against other major currencies.
The yield curve is flattening and occasionally inverting as investors reassess the timing and size of future rate moves. The market is increasingly expecting the Fed to maintain a higher interest rate stance for longer.
Equities: Winners and Losers
Super-low layoffs are a double-edged sword for equities. On one side, steady jobs support sectors tied closely to domestic consumption—think retail, housing, and small-cap stocks—as consumers keep spending. On the flip side, rate-sensitive sectors such as high-growth tech, utilities, and REITs may face headwinds amid expectations of a prolonged tight monetary policy.
Companies may also feel earnings squeeze from higher labor costs, even if revenues stay healthy—a classic margin pressure scenario.
Commodities Stay Supported
The labor market’s resilience also supports steady demand for energy and industrial commodities. Household income stability translates to ongoing need for oil and industrial metals, crucial for manufacturing and construction. This steady demand underpins commodity price strength in the near term.
Deeper Labor Market Trends and Challenges
Looking at recent weeks, initial jobless claims hovered around 215,000 to 208,000 before this latest drop to 187,000. While seasonal adjustments may tweak the numbers slightly, economists largely agree this reflects exceptionally low layoffs and a tight labor market.
However, entry-level job postings have fallen by about 7.5% since 2022, hinting at a cooling hiring appetite. Companies seem to prefer holding onto experienced staff rather than expanding payrolls, indicating some structural challenges, especially for newcomers.
What’s Next: Monitoring Policy and Industry Shifts
Markets will watch closely to see if these ultra-low claims are sustainable or represent a seasonal dip. Even a mild rise back into the 200,000–220,000 range would still speak to labor market tightness but might ease pressure on the Fed to keep rates high.
Wage growth and sector-specific reports are key. If wage pressures ramp up again, inflation concerns could resurface, pushing treasury yields and impacting rate-sensitive stocks.
Finally, early concerns about AI-driven layoffs have yet to materialize broadly. The real test may come with targeted disruptions in specific industries, which could create localized labor market shifts impacting regional economies and specific sectors more than the overall claims data reveal.
In short, the US labor market is showing exceptional vitality, providing a strong buffer for the economy and markets. Yet, with hiring slowing and structural shifts underway, investors will want to stay alert, balancing optimism with cautious scrutiny.