

 |
| Gold V.1.3.1 signal Telegram Channel (English) |
EURUSD: Bearish Flag Pattern Signals Short-Term Pullback Risk in Trading Outlook, July 27, 2026
2026-07-27 @ 09:01
Over the past 24 to 48 hours, the EUR/USD currency pair exhibited a steady yet modest upward trend. Yesterday’s closing price stood at 1.14023, marking an increase of approximately 0.28% compared to the previous trading day. In the market, the U.S. dollar maintained resilience amid strong U.S. economic data and rising inflation risks, but the euro found support amid expectations of a more hawkish stance from the European Central Bank (ECB).
One of the main drivers recently has been the ECB’s noticeably hawkish monetary policy signals. Despite the upward pressure on the dollar index, the euro avoided a sharp decline, reflecting investor anticipation of continued ECB tightening to fight inflation. For an average investor, focusing on the euro as a currency asset implies that the strong dollar is unlikely to reverse quickly. Meanwhile, the euro benefits from ECB’s policy cues and may attract forex traders seeking steady returns in the near term.
Additionally, ongoing geopolitical risks, especially in the Middle East, have affected market sentiment without causing sharp currency fluctuations. Investors remain cautious, keeping EUR/USD in a relatively tight trading range. Overall, this mixture of a robust dollar fundamental and ECB policy outlook has resulted in modest price gains and some volatility, offering diversified opportunities for investors of varying experience levels.
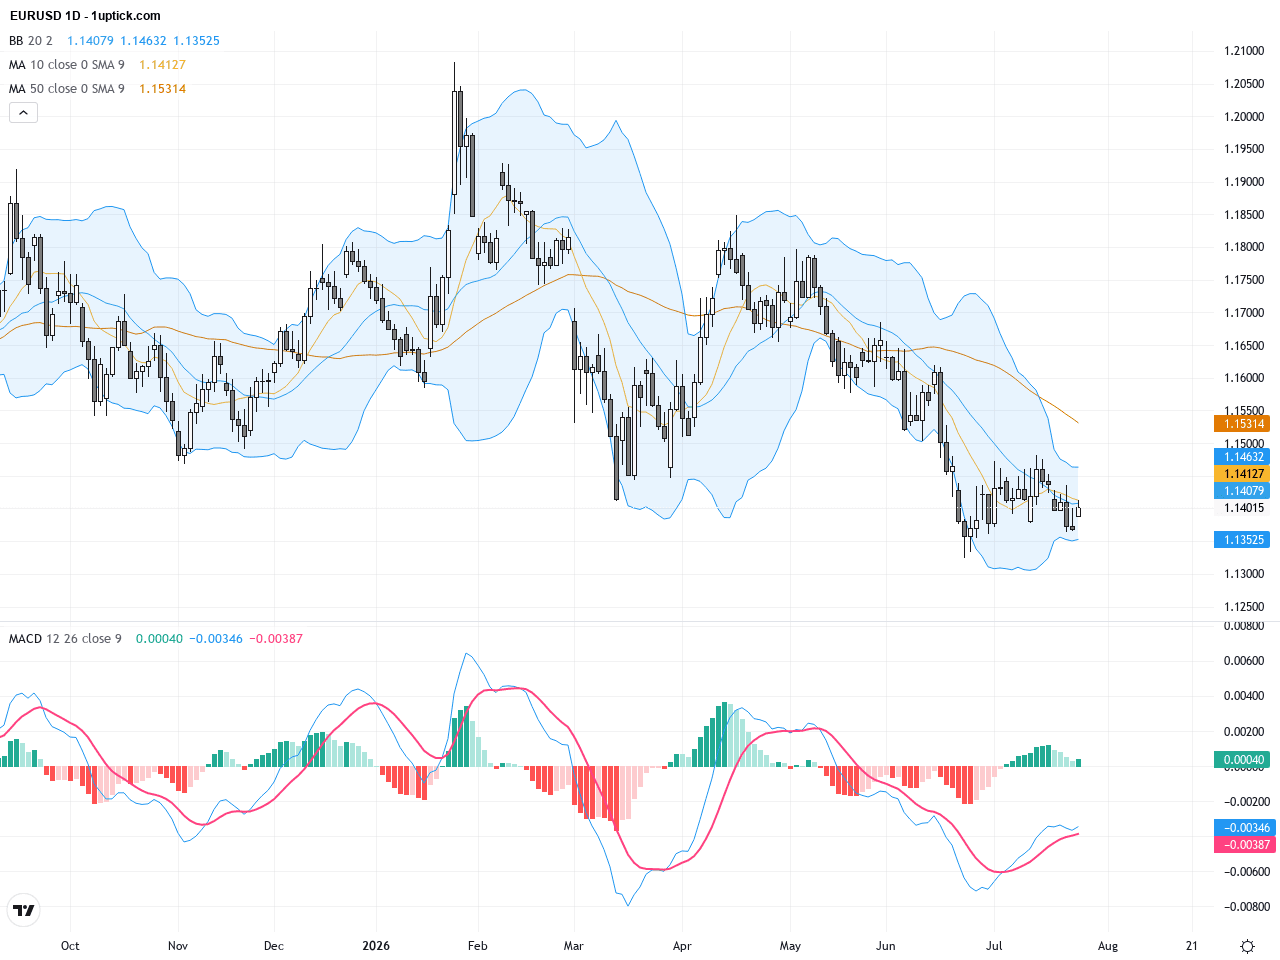
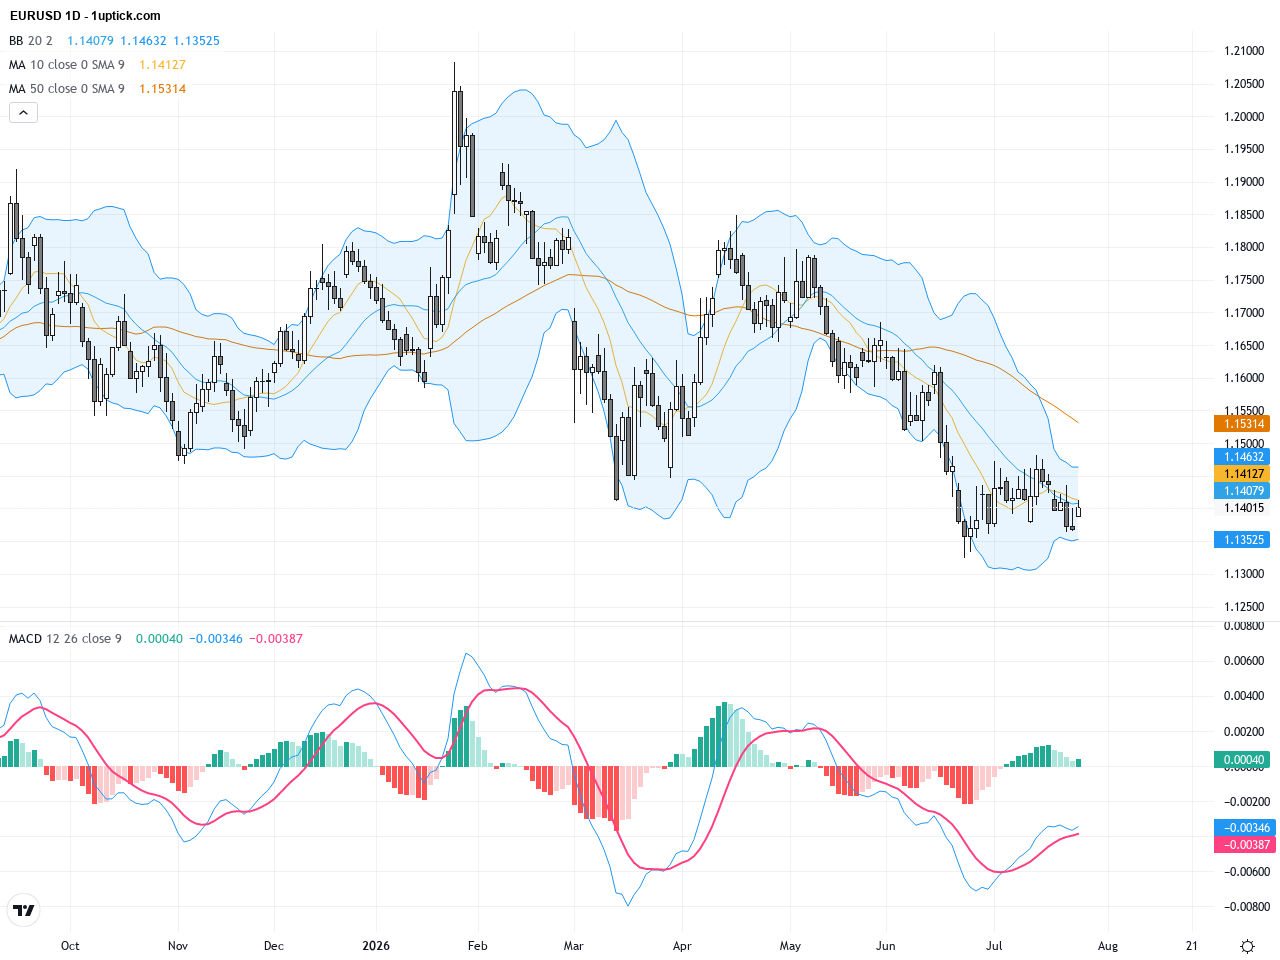
The daily chart of EURUSD reveals a moderate downtrend extending from an early-year high near 1.208 to the current range. A prominent bearish flag pattern has formed recently, with prices trading below the 50-day (~1.15) and 200-day (~1.16) moving averages, indicating sustained medium-to-long term weakness. Bollinger Bands are contracting, implying lower volatility but a potential for breakouts. The MACD shows frequent crossovers without a definitive trend shift, suggesting a phase of consolidation.
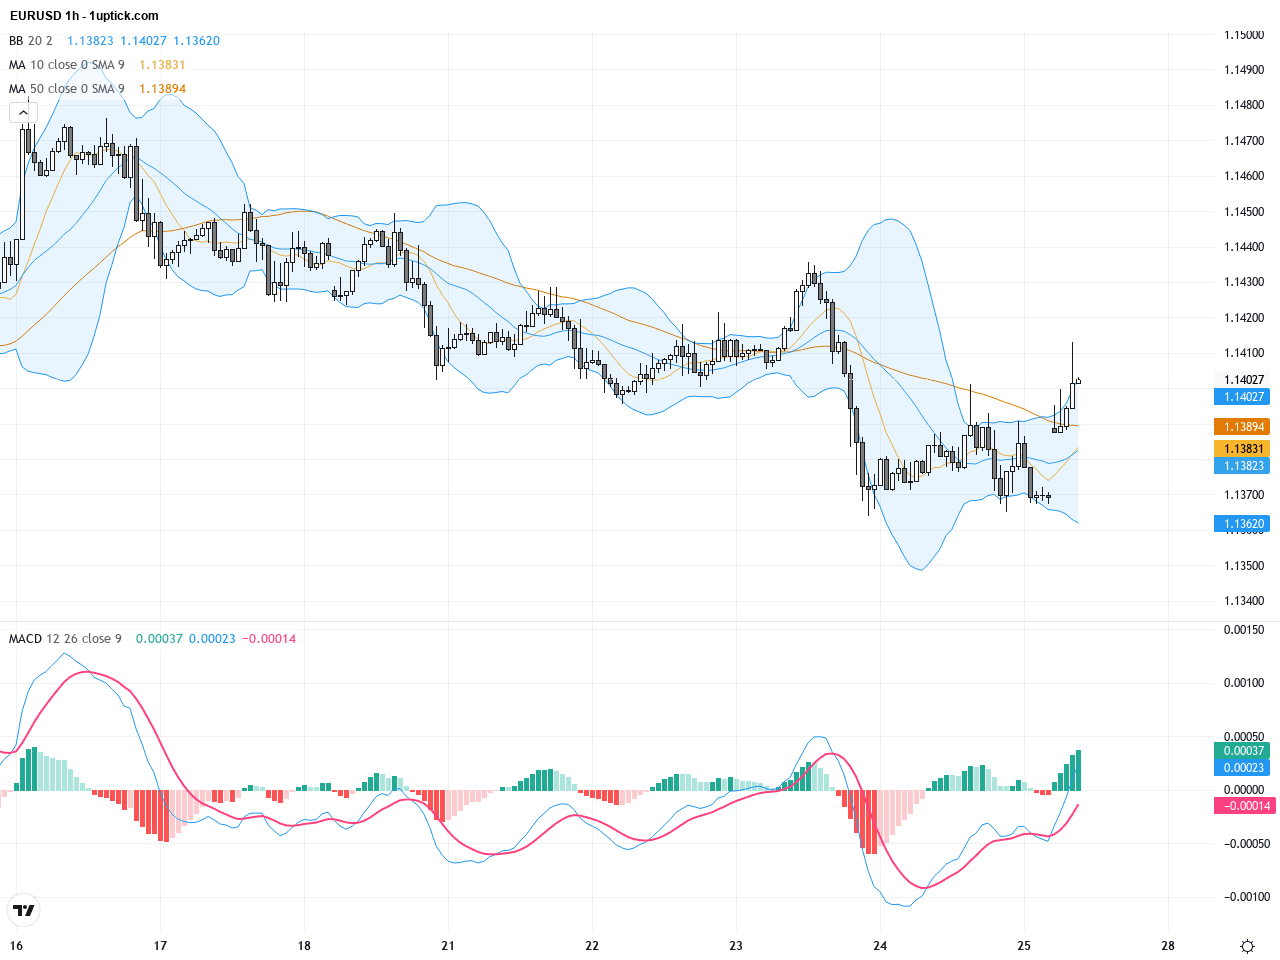
On the hourly chart covering the last 3-5 days, EURUSD exhibits a clear downward channel formation. Attempts to breach resistance around 1.1415 have repeatedly failed. MACD shows a bearish crossover, and RSI is retreating from overbought levels, highlighting increasing short-term selling pressure. Bollinger Bands are trending downwards, with a recent bearish engulfing candlestick pattern signaling probable downside momentum over the next 24 hours.
Technical Trend: EURUSD is currently in a cautiously bearish consolidation phase with downward pressure evident.
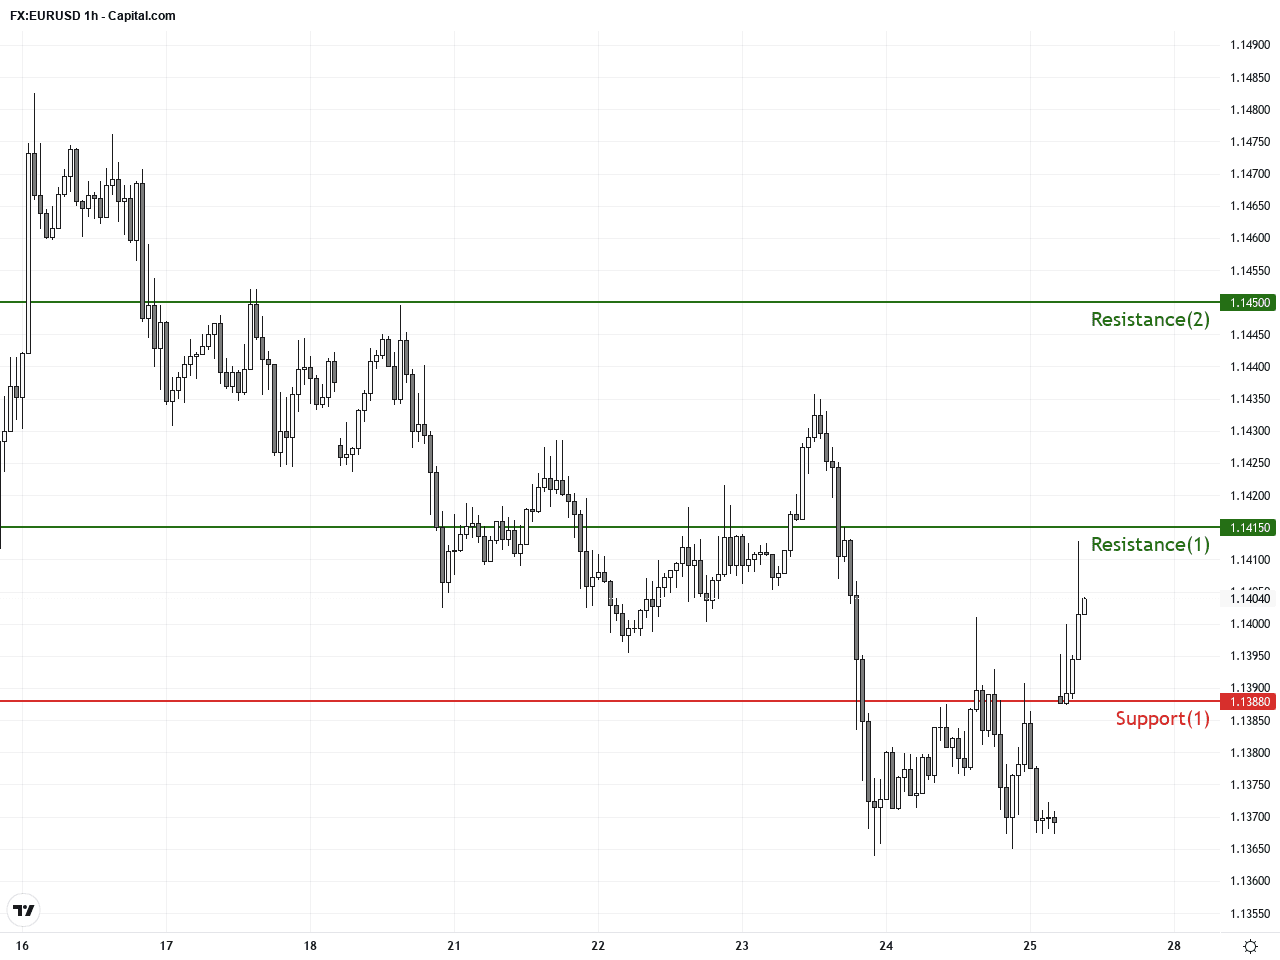
Technically, the bearish flag pattern is the dominant formation shaping this week’s EURUSD action, reflecting a short-term tug-of-war between bulls and bears. The daily MACD lacks strong bullish confirmation, while the hourly MACD bearish crossover and RSI decline highlight prevailing short-term selling momentum. The recent bearish engulfing candlestick reinforces downside risk. Maintaining support near 1.1388 is crucial; breaking below may lead to further declines.Today’s economic calendar (GMT+1) features Germany’s Ifo Business Climate and Eurozone M3 Money Supply data releases at 10:00 AM, both key for EURUSD. The Ifo is forecast to rise slightly from 85.6 to 86.1, while M3 money supply is expected at 3.3% year-on-year. Positive surprises in these figures could bolster the Euro, potentially driving a short-term EURUSD rally. Conversely, weak data may increase downside risks. Later US durable goods orders and Dallas Fed Manufacturing Index could influence USD strength and thereby impact EURUSD’s trajectory in the afternoon and evening sessions.
Resistance & Support
The above financial market data, quotes, charts, statistics, exchange rates, news, research, analysis, buy or sell ratings, financial education, and other information are for reference only. Before making any trades based on this information, you should consult independent professional advice to verify pricing data or obtain more detailed market information. 1uptick.com should not be regarded as soliciting any subscriber or visitor to execute any trade. You are solely responsible for all of your own trading decisions.