


 |
| Gold V.1.3.1 signal Telegram Channel (English) |
USDJPY: Key Support Holds Amid Japan-US Yen Intervention – Trading Outlook & Technical Patterns, August 3, 2026
2026-08-03 @ 11:01
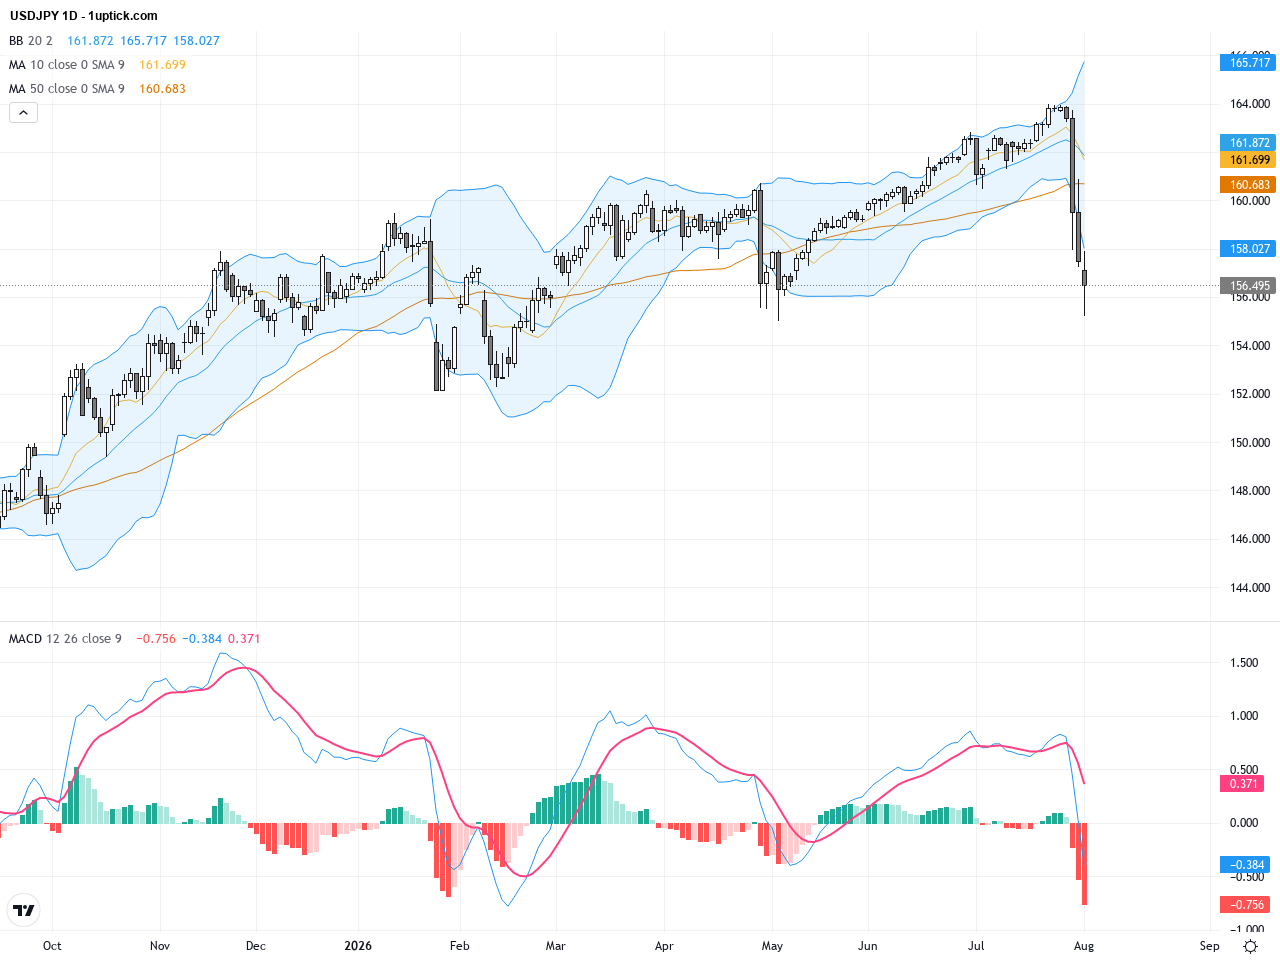
Over the past 24 to 48 hours, the USD/JPY market has experienced notable volatility, with prices dropping sharply from yesterday’s close around 157.4 to a low of 155.215, finally closing at 156.496 — a decline of approximately 0.9 points. This sharp fall was primarily driven by the joint intervention announced by Japan and the United States to curb the yen’s persistent weakness. Japan deployed a record $72.4 billion alongside the US Treasury in a coordinated effort to stabilize the yen exchange rate, which successfully prompted a significant pullback in the USD/JPY price.
This currency intervention, rarely seen among major economies, signals Japan’s serious concern over the yen’s steep depreciation and its potential negative impact on corporate interests and economic stability. For average investors, this action transcends typical currency trading and reflects a strategic move aimed at protecting Japanese corporations’ competitiveness by preventing wild swings in import and export costs.
For everyday investors, this joint intervention means the market is undergoing a critical policy adjustment phase, likely increasing short-term volatility but also presenting an opportunity to reassess exchange rate risks and portfolio positions. Overall, the combined efforts by Japan and the US to arrest the yen’s slide have paused USD/JPY’s fall and sparked a rebound, injecting fresh uncertainty and opportunity into the forex market.
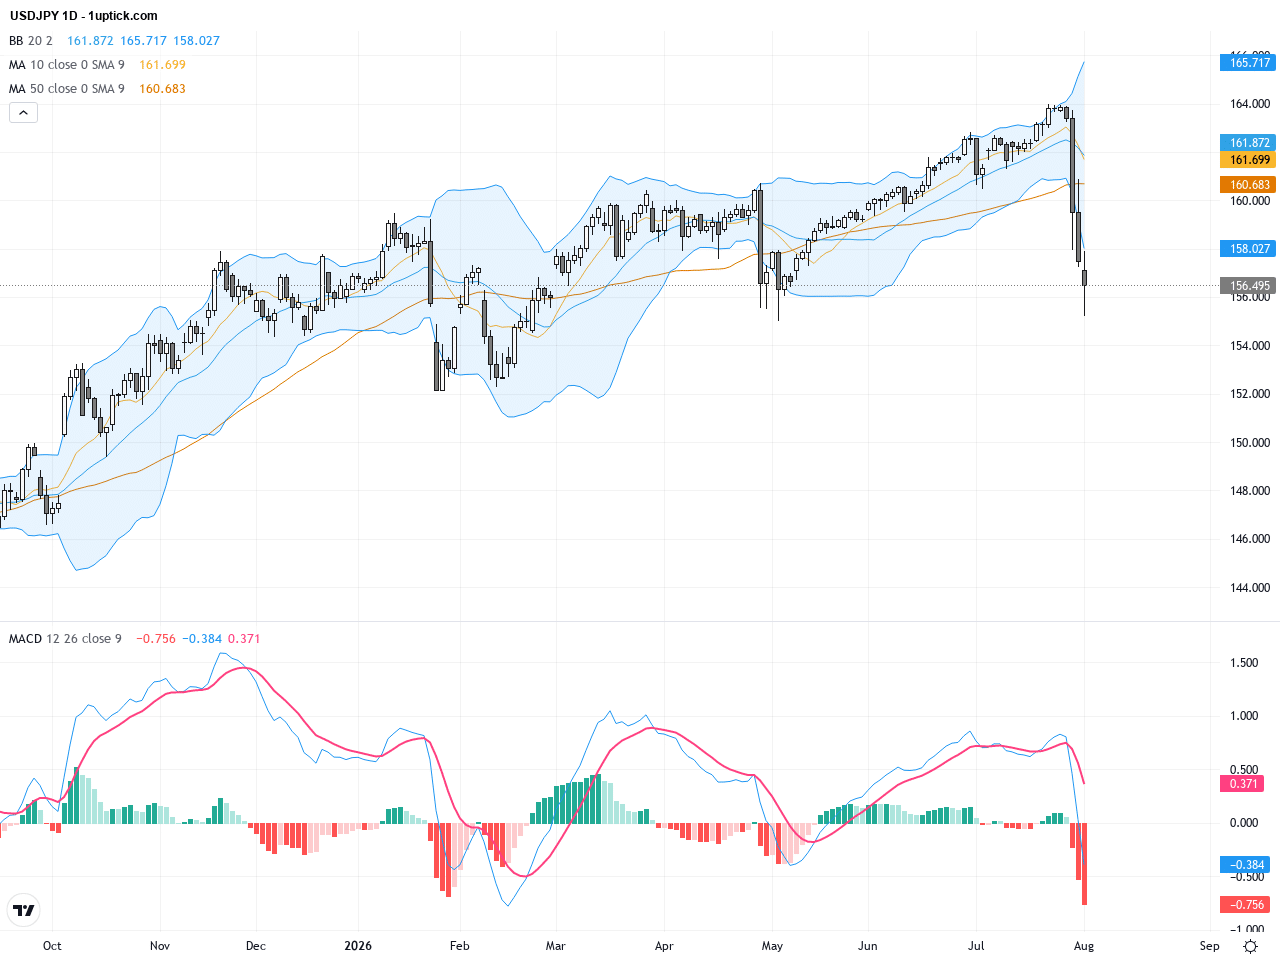
The USDJPY daily chart reveals a consistent downtrend from early 2026, with prices trading below the 200-day moving average (around 157.9), indicating sustained selling pressure. Last week’s coordinated intervention led to sharp declines, pushing the pair to lows near 155.2. Subsequent candlesticks show long lower shadows suggesting buyers are stepping in at support. Bollinger Bands are narrowing, signaling a possible surge in volatility soon. The MACD remains below zero but shows a potential bullish crossover forming, which could confirm a medium-term reversal. Overall, the daily technicals suggest the downtrend is pausing and a rebound or consolidation phase could be underway.
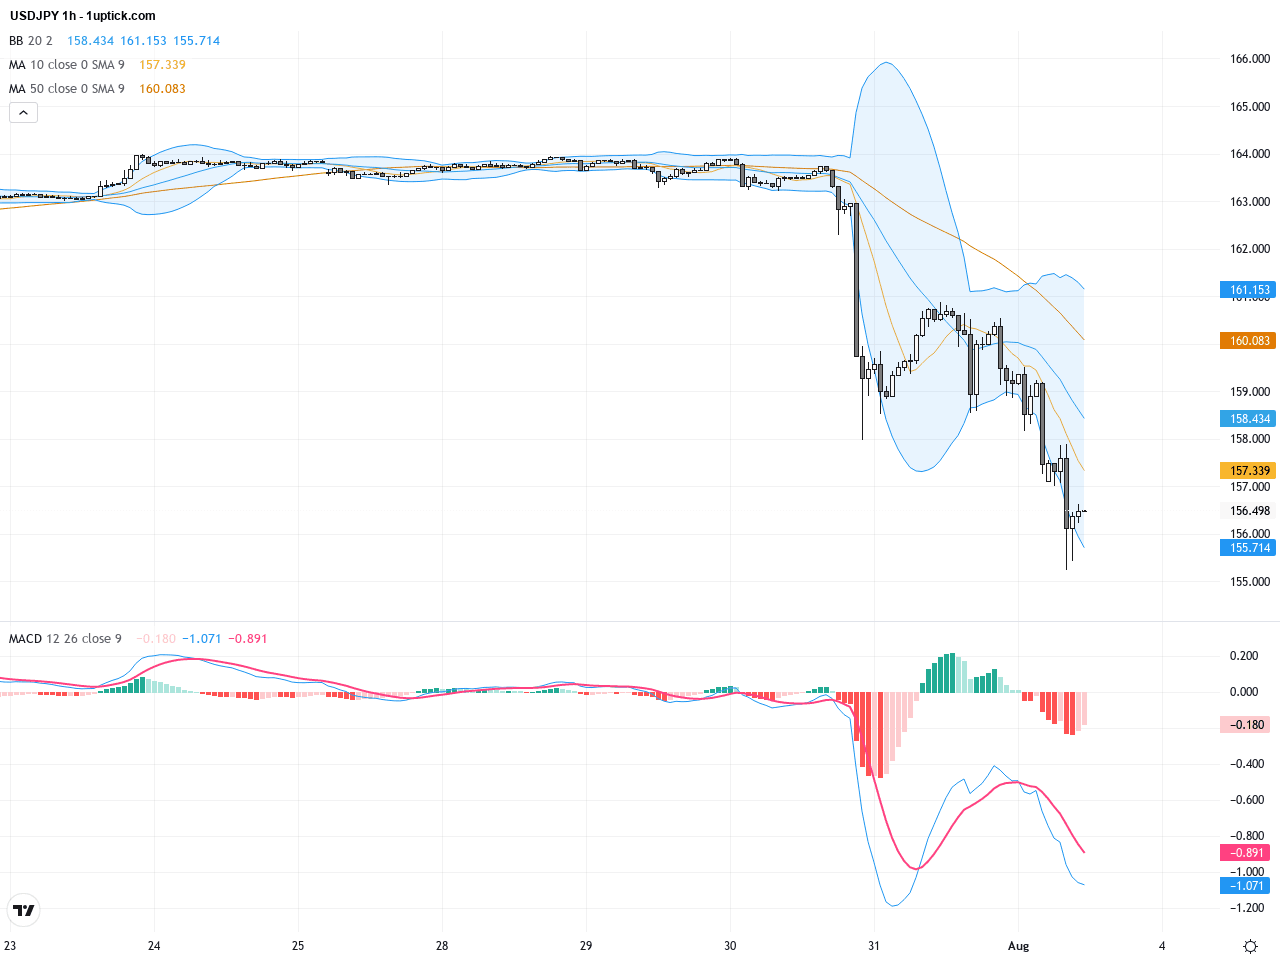
On the hourly chart focusing on the past 3-5 days, USDJPY exhibits a clear oscillating pattern between 155.5 and 157.9. The 20 and 50-period EMAs are showing a potential crossover to the upside after a recent bearish run, indicating short-term buyers are regaining control. The MACD is attempting multiple breakthroughs above the zero line but lacks conviction so far. The latest hammer candlestick indicates a strong attempt by bulls to push prices higher, signaling a short-term bounce or sideways consolidation, awaiting clearer directional cues.
Technical Trend: Consolidation with Bullish Bias
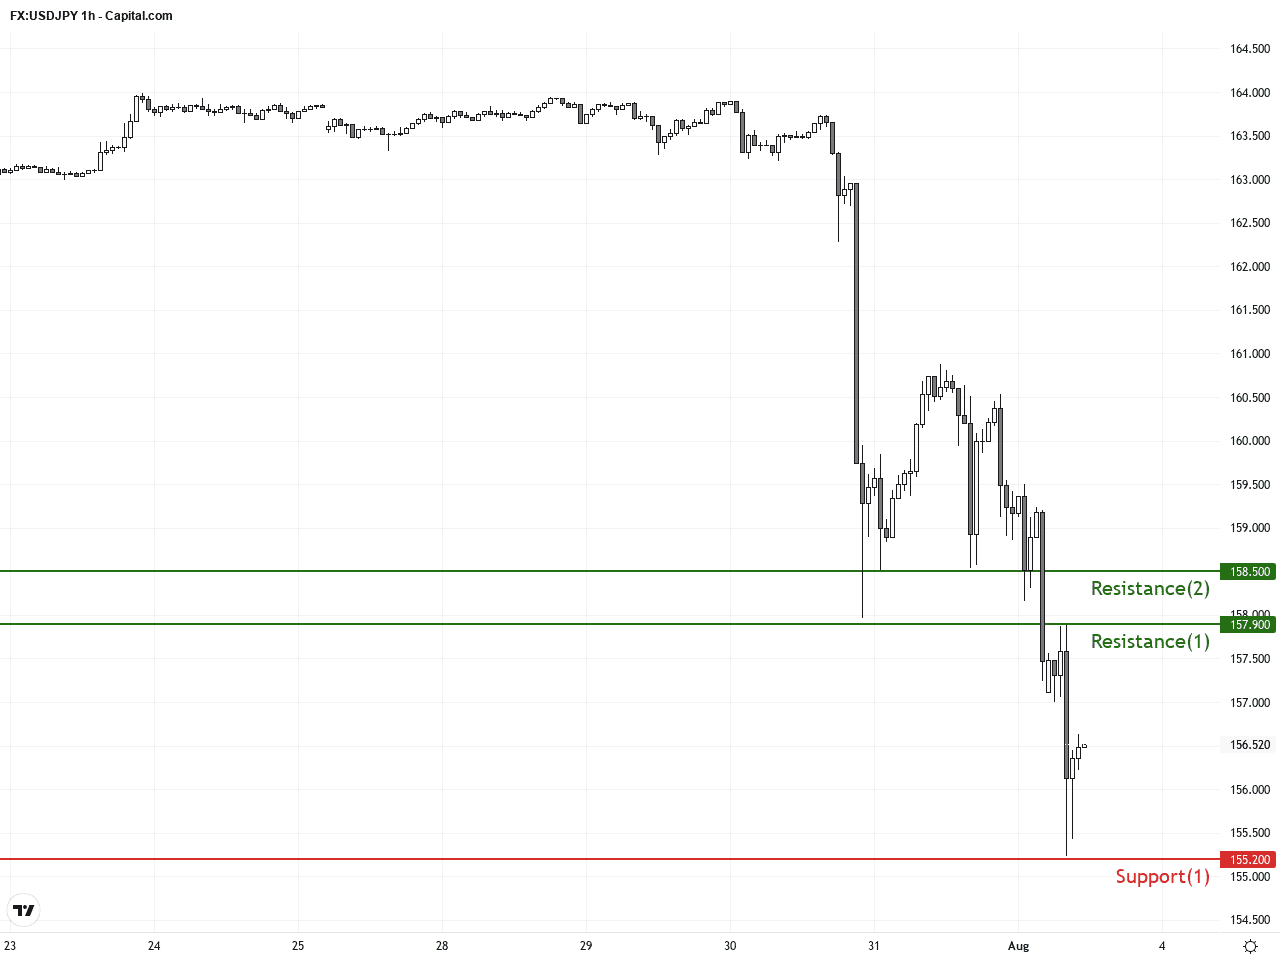
From a technical standpoint, USDJPY is testing strong support levels, confirmed by the combination of long lower shadows on daily candles and recent hammer patterns on hourly charts, suggesting a prime setup for a short-term bounce. A confirmed MACD bullish crossover would strengthen the chance of a momentum shift to the upside. Narrowing Bollinger Bands warn of an imminent volatility increase, so traders should watch for clear breakouts above resistance or firm breakdowns below support. Trading strategy should lean towards tactical buy-on-dips with strict risk management.Today’s economic calendar includes Japan’s July Manufacturing PMI slightly below expectations at 54.5, down from 54.8 previously, still indicating expansion but with a mild slowdown. This data is unlikely to materially affect USDJPY, as market attention remains on the coordinated yen intervention and global risk sentiment. Later US manufacturing data could influence USD strength but has limited immediate effect on yen dynamics. In summary, no direct significant economic event is positioned today to disrupt USDJPY beyond existing intervention impacts.
Resistance & Support
The above financial market data, quotes, charts, statistics, exchange rates, news, research, analysis, buy or sell ratings, financial education, and other information are for reference only. Before making any trades based on this information, you should consult independent professional advice to verify pricing data or obtain more detailed market information. 1uptick.com should not be regarded as soliciting any subscriber or visitor to execute any trade. You are solely responsible for all of your own trading decisions.