

 |
| Gold V.1.3.1 signal Telegram Channel (English) |
EURUSD: Approaching Key 1.1560 Resistance with Technical Patterns Signaling Potential Breakout, August 10, 2026
2026-08-10 @ 09:01
Over the past 24 to 48 hours, the EUR/USD pair experienced notable volatility, rallying past the key resistance level of 1.1560 and hitting a monthly high, with yesterday’s closing price around 1.15586. This surge was primarily driven by weaker-than-expected US jobs data, which heightened market expectations that the Federal Reserve may slow or pause interest rate hikes, leading to a softer dollar and benefiting the euro.
Recent market news highlights that as the Euro makes up 57.6% of the dollar currency basket, it remains a major driver of the Greenback’s movements. The sharp rise in the euro correlates closely with the soft US employment numbers, while investors now anticipate the upcoming US Consumer Price Index (CPI) report, which will likely be pivotal in directing future FX trends.
For the average investor, this means an increased uncertainty in the forex market but also presents an opportunity to buy into the euro. Weak US economic data suggests the Fed may adopt a more dovish stance, easing dollar pressure and potentially rewarding euro holders. Overall, the course of US policy and economic performance remains the key driver behind recent EUR/USD price action.
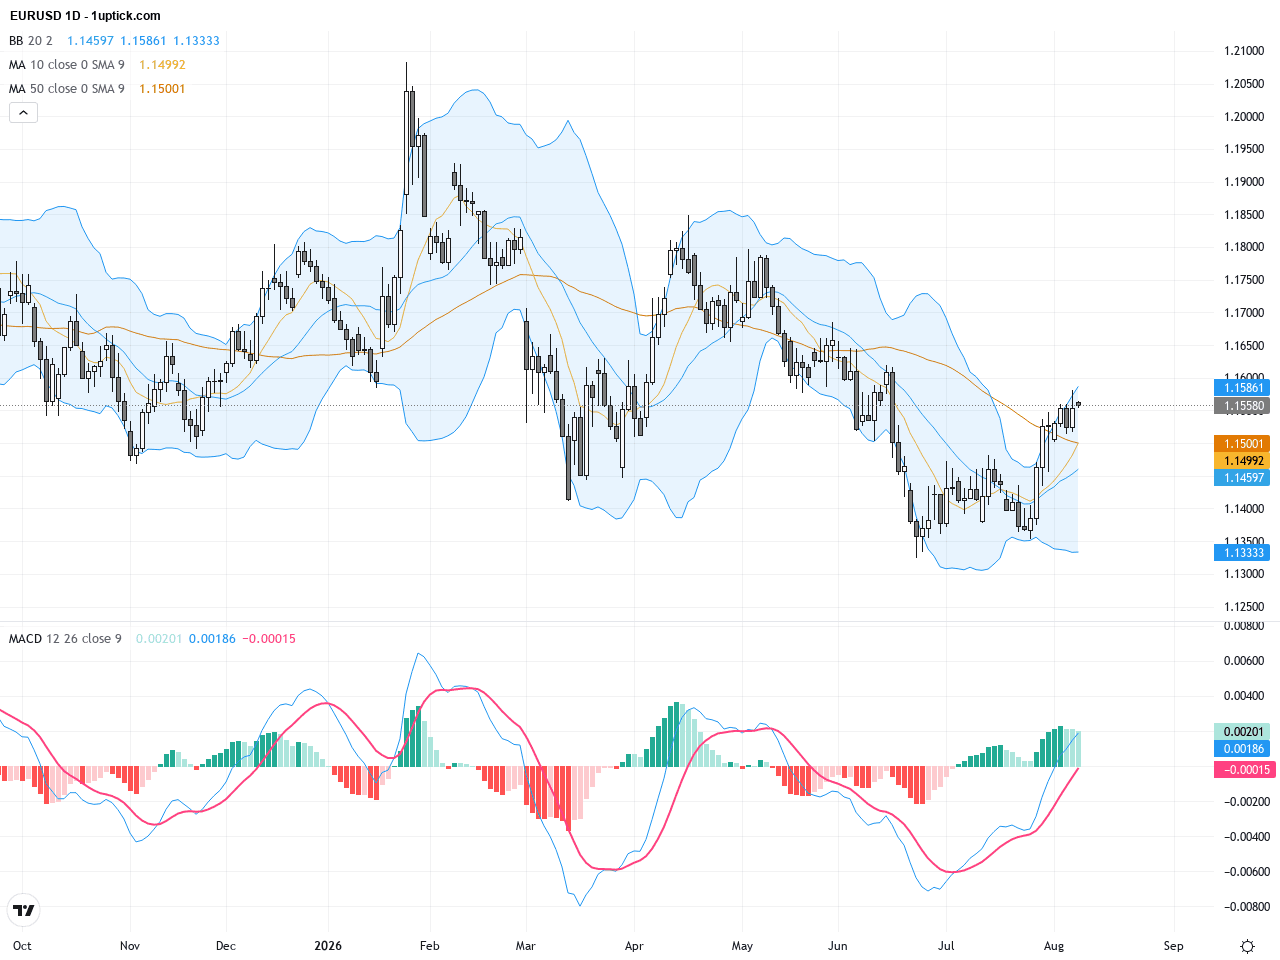
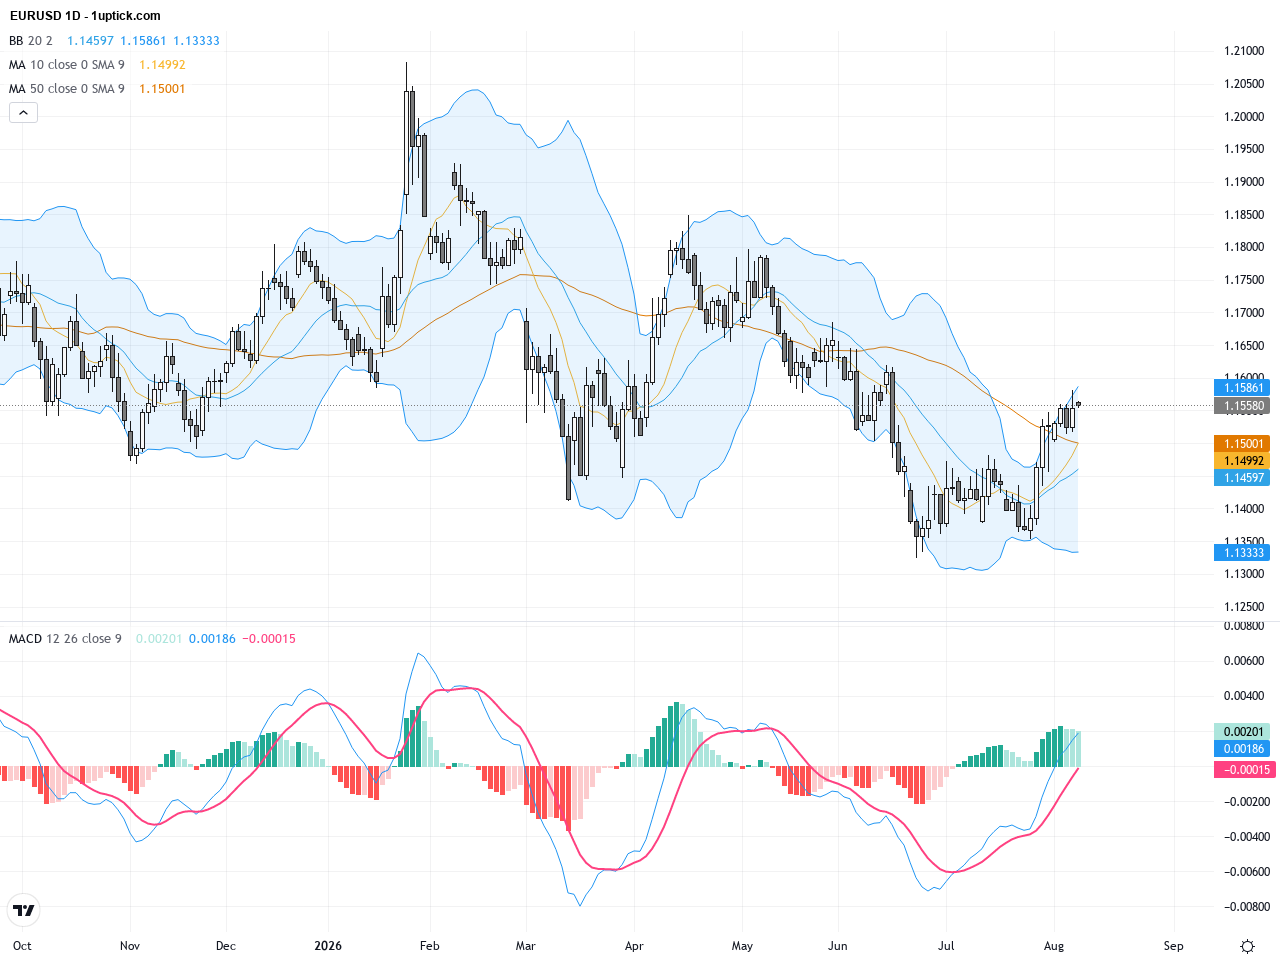
The EURUSD daily chart shows a steady uptrend from earlier this year, with prices fluctuating between 1.13 and 1.20. The 50-day moving average around 1.14738 provides solid support, while the 200-day moving average near 1.16262 acts as a strong resistance. Recently, prices approached the 1.1560 resistance zone, forming an expanding wedge pattern beginning late July. This pattern suggests that a breakout above 1.1560 could trigger a sustained upward move. Bollinger Bands remain moderately spaced, indicating balanced market sentiment.
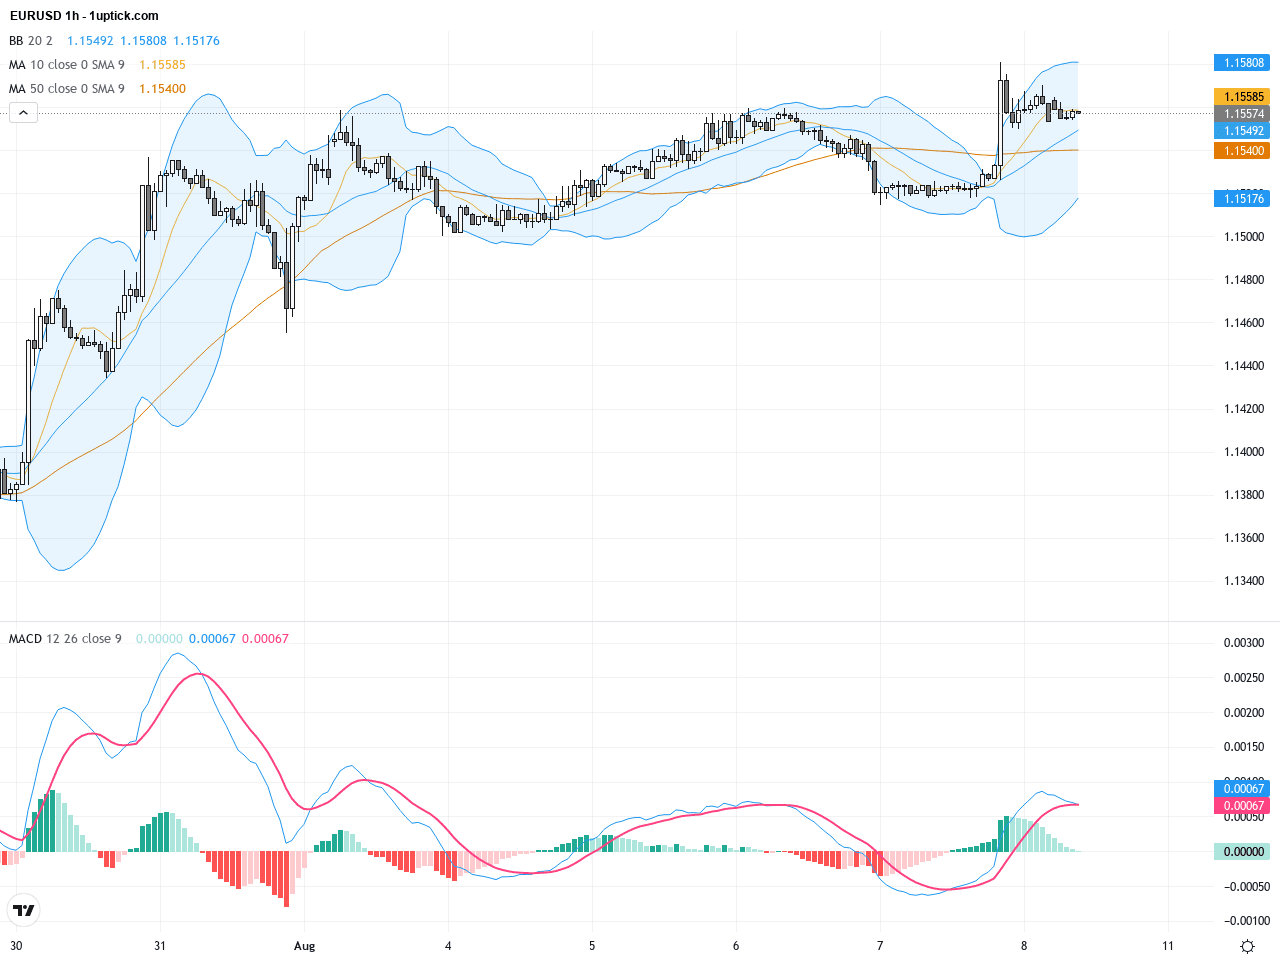
The hourly chart for the past 3-5 days reveals choppy price action amid shifting rate expectations, with repeated tests of the 1.1560 to 1.1580 resistance area. The 4-hour moving averages display a bullish alignment, especially an 8-hour EMA cluster around 1.1560 providing resistance. The MACD indicator just posted a bullish crossover, signaling renewed upside momentum. Recent strong bullish engulfing candlesticks reinforce the positive outlook for continuation in the near term.
Technical Trend: EURUSD is displaying a cautiously bullish trend, with moderate upward momentum tempered by resistance near a critical price level. Short-term momentum shifts suggest a potential breakout, warranting close monitoring.
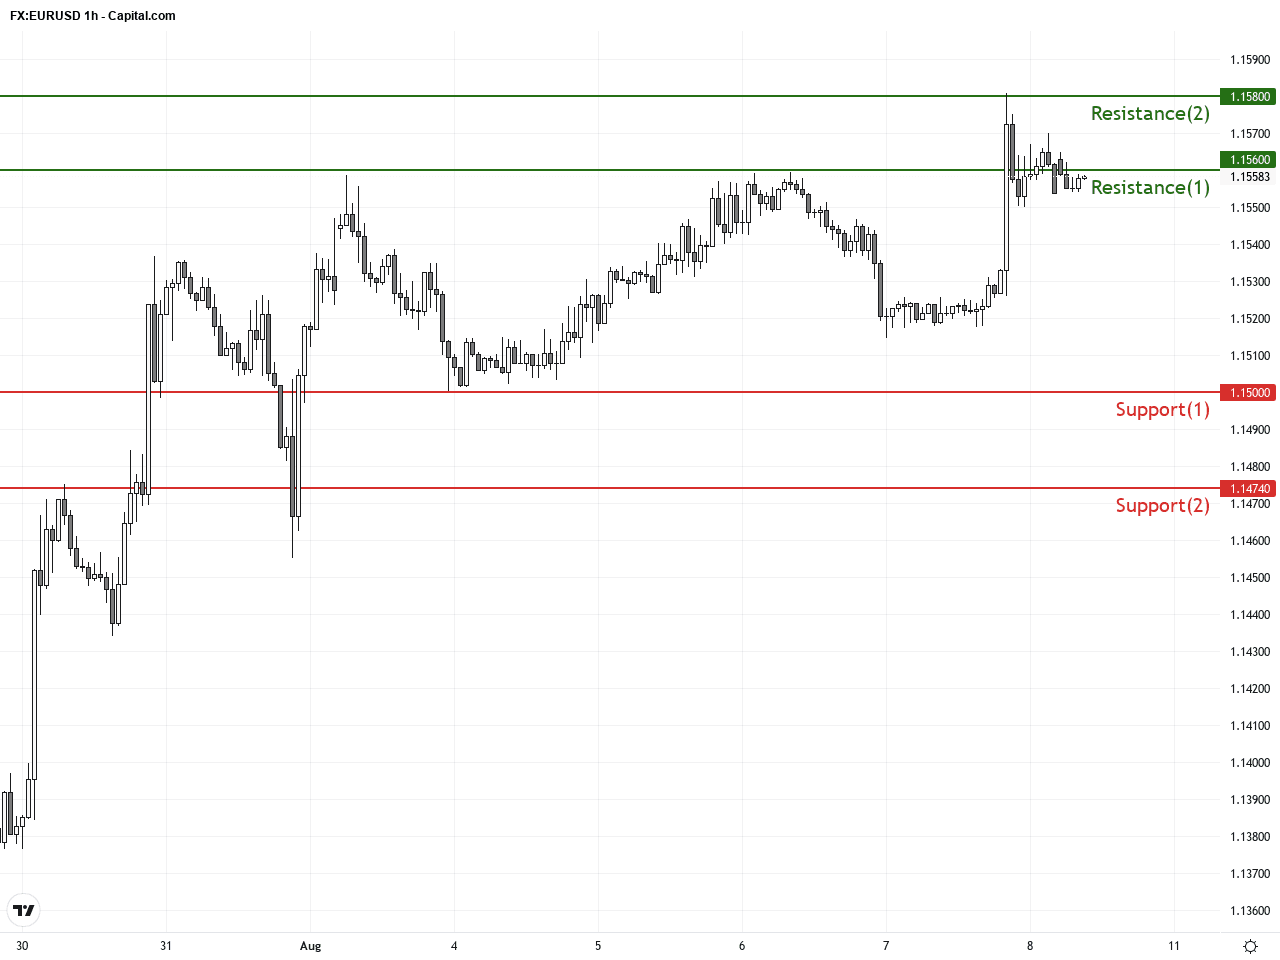
Technically, the expanding wedge pattern on the daily chart combined with the MACD bullish crossover on the hourly chart form a robust bullish setup. The recent bullish engulfing candlestick indicates strong buying interest. Traders should watch for a confirmed break above 1.1560 and hold of the 5-day EMA support as key signals for the next trend leg.Today’s GMT+1 economic calendar shows no major events directly impacting EURUSD. The Eurozone Sentix Index is expected to improve slightly but data is pending, while the US has no significant releases. Market focus remains on tomorrow’s US CPI report. For today, the lack of high-impact news suggests EURUSD will likely maintain its current technical stance while awaiting more decisive macroeconomic cues.
Resistance & Support
The above financial market data, quotes, charts, statistics, exchange rates, news, research, analysis, buy or sell ratings, financial education, and other information are for reference only. Before making any trades based on this information, you should consult independent professional advice to verify pricing data or obtain more detailed market information. 1uptick.com should not be regarded as soliciting any subscriber or visitor to execute any trade. You are solely responsible for all of your own trading decisions.