








 |
| Gold V.1.3.1 signal Telegram Channel (English) |
EURUSD Breaks Key 1.1570 Level with Strong Short-Term Bullish Momentum, August 21, 2026
2026-08-21 @ 09:01
Over the past 24 to 48 hours, the EUR/USD pair has shown robust strength, climbing steadily from yesterday’s closing price of 1.16834. Recent market news highlights that falling US Treasury yields have pressured the US Dollar Index (DXY), while weaker-than-expected US retail sales have fueled bullish momentum for the euro. During this period, EUR/USD broke past 1.1570 and peaked near 1.169, underscoring the market’s sensitivity to a softer dollar.
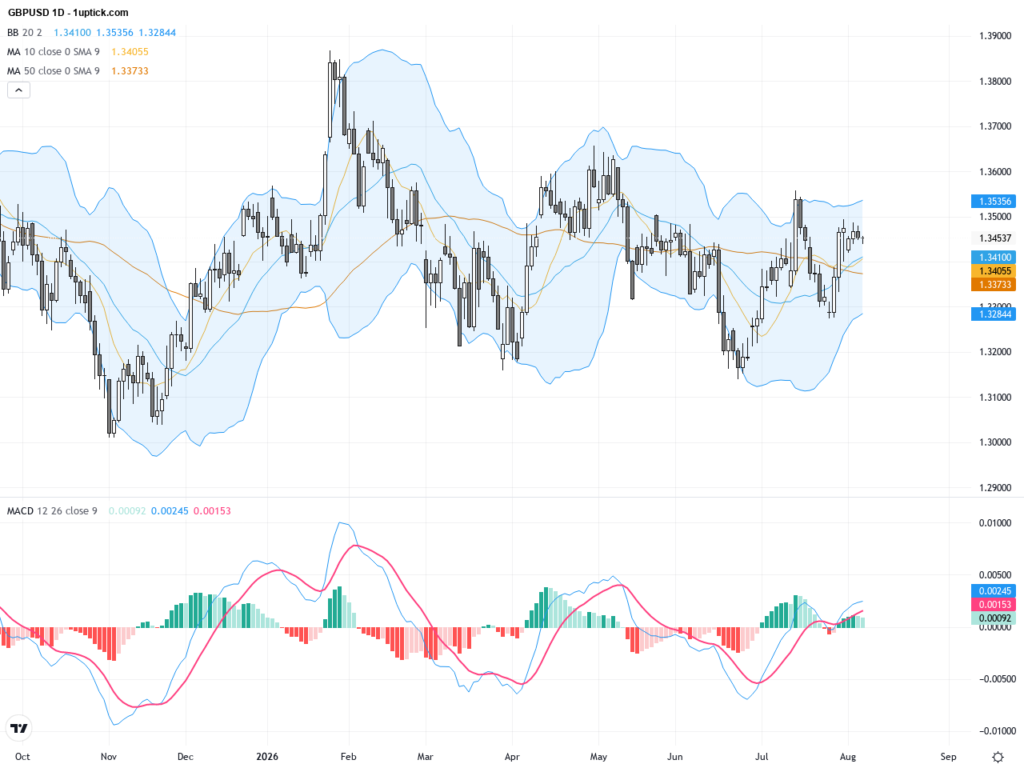
Headlines such as “US Dollar Price Forecast: Falling Treasury Yields Sink DXY as EUR/USD Breaks Higher” clearly point to Treasury buybacks pushing yields lower, weakening the dollar. For the average investor, this translates into reduced demand for the dollar as a safe haven, giving the euro a boost. This dynamic is mirrored in GBP/USD, reflecting a broader USD softness.
Meanwhile, markets are gearing up for the upcoming July Consumer Price Index (CPI) report, with investors closely watching core inflation for insights on the Fed’s next moves. But ahead of the data, the euro has leveraged the dollar’s weakness and subdued US retail sales to secure a short-term bullish edge. This trend serves as a timely reminder that amid ongoing geopolitical complexities and macroeconomic shifts, currency market volatility and opportunities remain active.
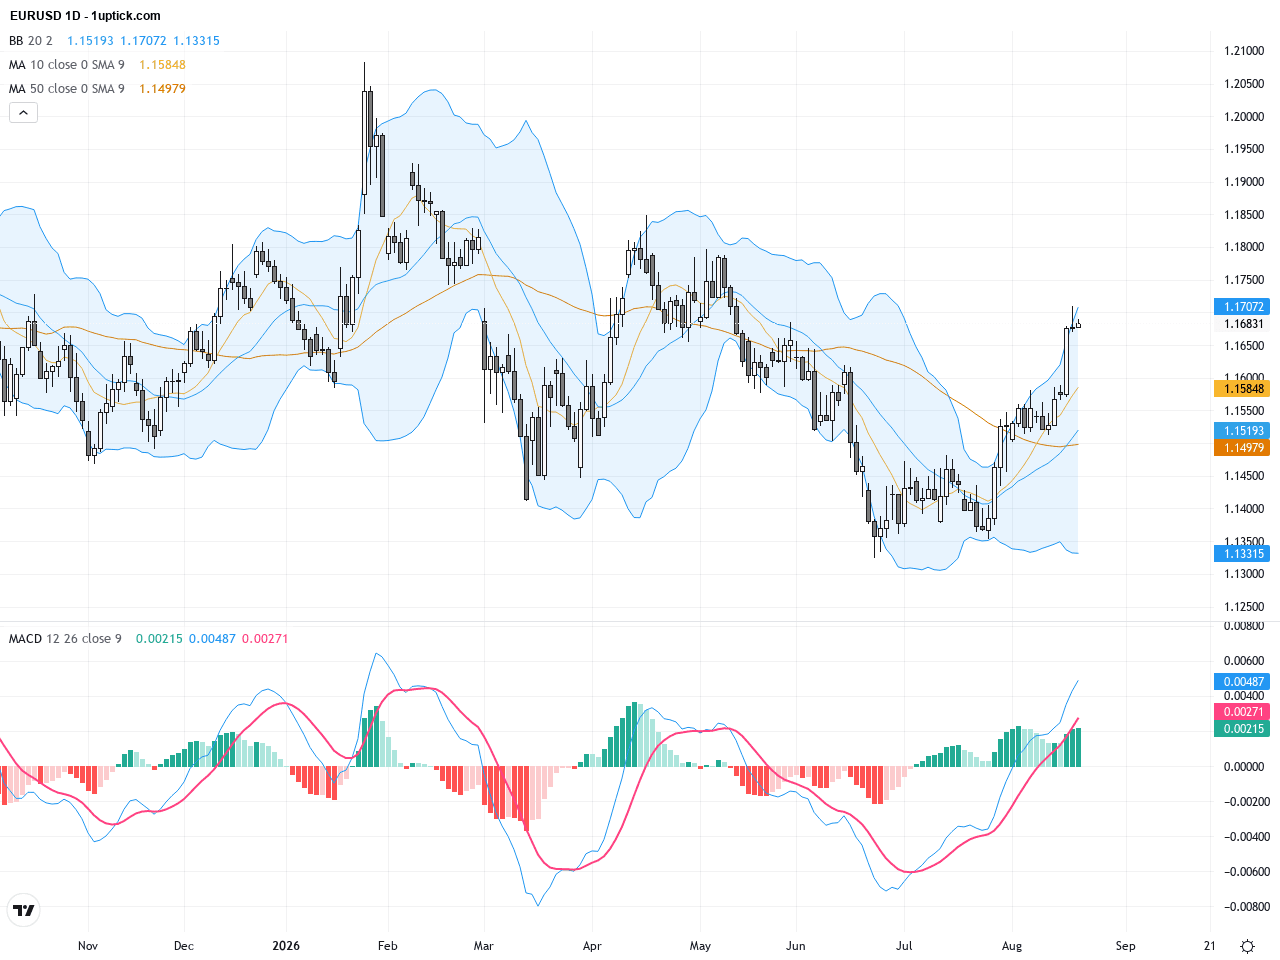
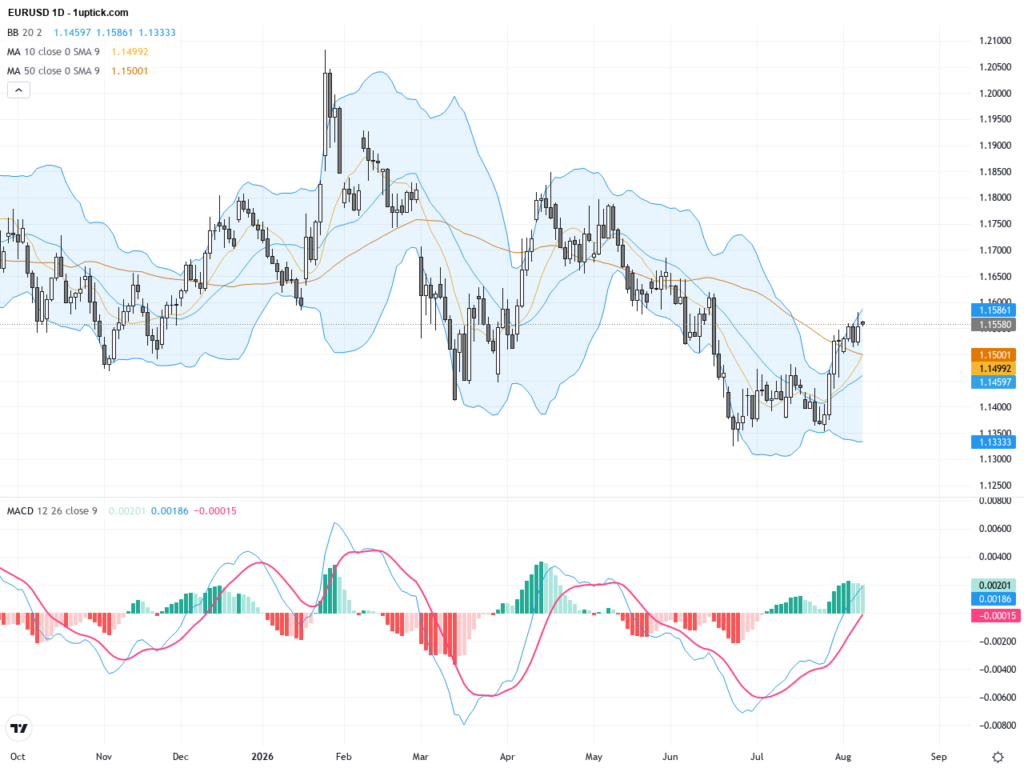
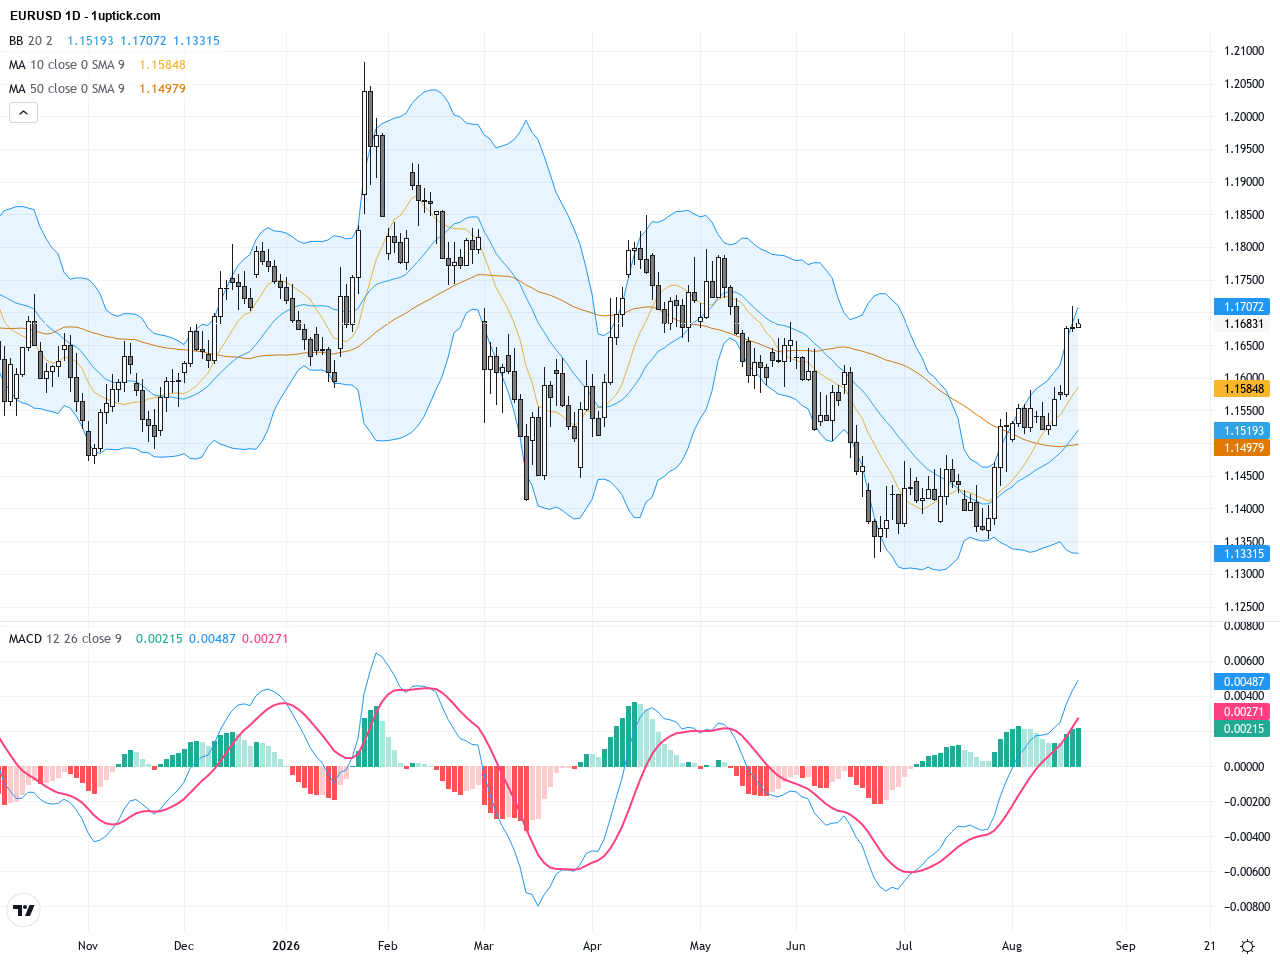
The EURUSD daily chart illustrates a sustained uptrend since June, with recent price action breaking above the 50-day moving average (1.14686) and 200-day moving average (1.16269), maintaining support above these key levels. Bollinger Bands indicate a narrowing volatility range, with price consistently above the middle band, suggesting bullish bias. The MACD remains above its signal line with upward-sloping moving averages, confirming strong bullish momentum. The uptrend line from May supports continued upside potential.
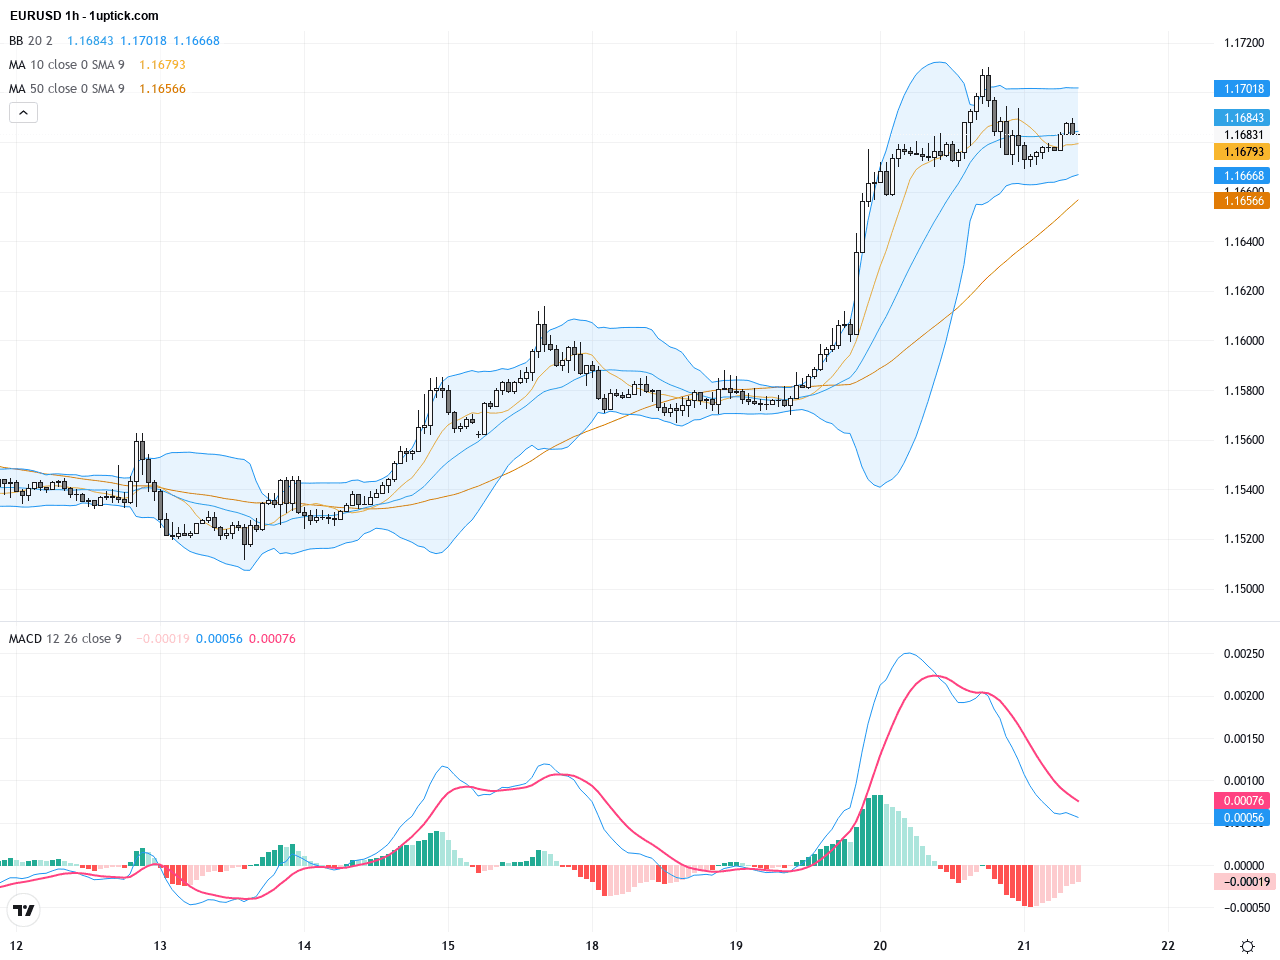
On the hourly chart, EURUSD has demonstrated a steady uptrend over the past 3-5 days, trading near the 20-period moving average on the upside. An expanding wedge pattern has formed recently, indicating increased short-term volatility, with a potential directional breakout on the horizon. The MACD recently generated a bullish crossover, signaling strengthening momentum. Bollinger Bands are starting to widen, suggesting greater price swings ahead. Short-term traders could look for swing trading opportunities.
Technical Trend: The current trend direction is a clear and decisively bullish uptrend with an aggressive short-term bullish outlook.
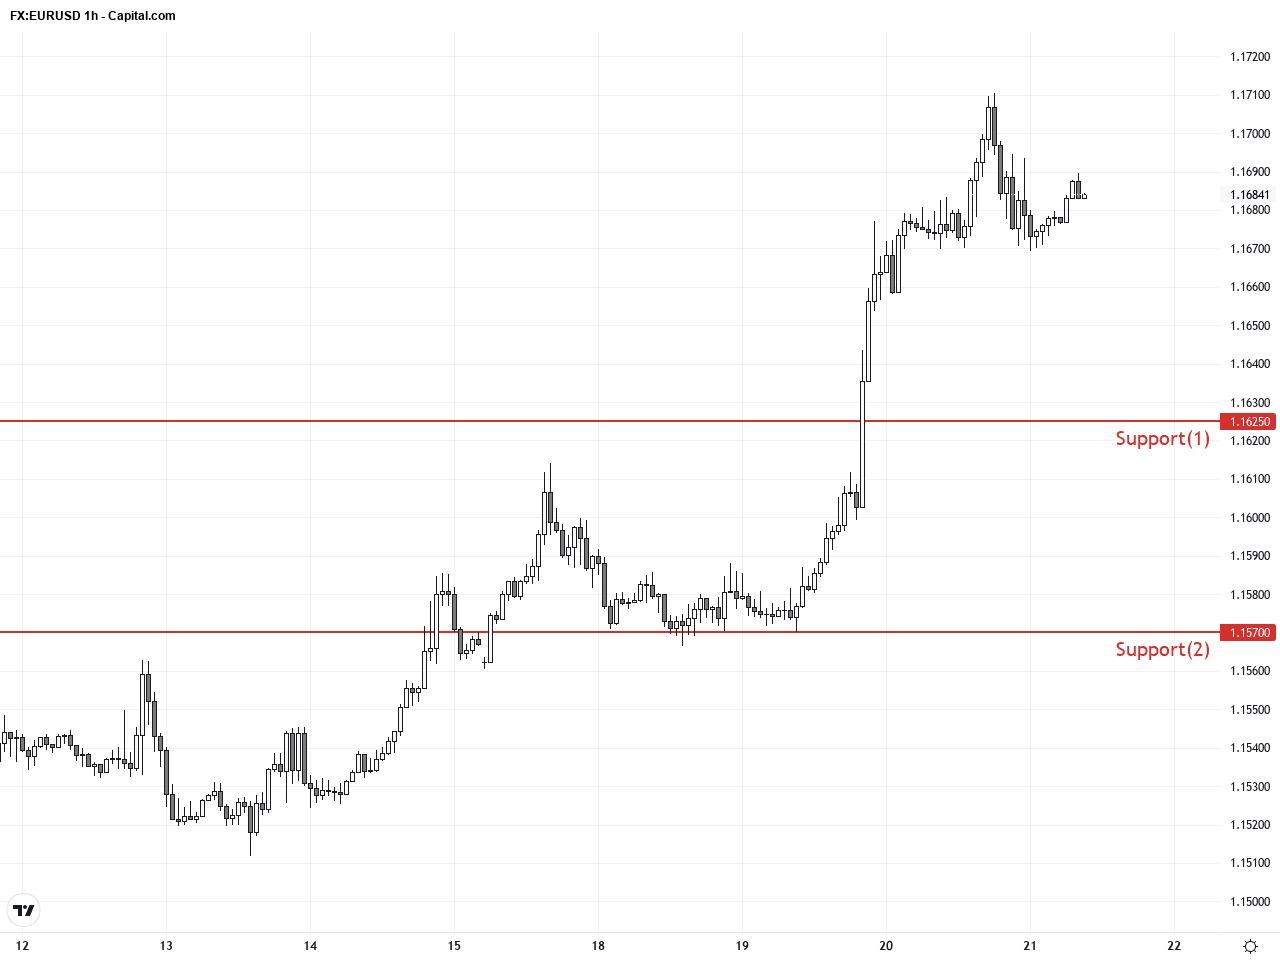
Technically, the continued breakout on the daily chart indicates a clear bullish trend; meanwhile, the hourly chart’s bullish MACD crossover and expanding wedge pattern reveal active market contention but with a bullish edge. Recent strong bullish candlesticks without upper shadows reflect firm buying control. Additionally, no significant MACD or RSI divergences suggest trend stability. Traders might consider entering long near support levels and watch for a breakout above resistance around 1.1740 for potential extension.Today’s economic calendar includes key manufacturing and services PMI releases from the Eurozone and Germany, which are forecasted to remain stable or slightly change. In the U.S., manufacturing and services PMI data are expected later in the day. If these U.S. figures outperform expectations, the USD may strengthen, potentially pressuring EURUSD lower; if weaker, this could further support EURUSD gains. There are no other major direct events impacting EURUSD today, so traders should pay close attention to PMI results and market reactions.
Resistance & Support
The above financial market data, quotes, charts, statistics, exchange rates, news, research, analysis, buy or sell ratings, financial education, and other information are for reference only. Before making any trades based on this information, you should consult independent professional advice to verify pricing data or obtain more detailed market information. 1uptick.com should not be regarded as soliciting any subscriber or visitor to execute any trade. You are solely responsible for all of your own trading decisions.