








 |
| Gold V.1.3.1 signal Telegram Channel (English) |
GBPUSD Technical Analysis: Consolidation Near Multi-Month High with Key Support and Resistance Levels, August 26, 2026
2026-08-26 @ 13:01
Over the past 24 to 48 hours, the GBP/USD pair has experienced notable volatility. While the British Pound approached a six-month high near 1.3675 during Monday and Tuesday, it slid below the mid-1.3600s during the Asian session on Wednesday as the US Dollar awaited the release of the US Personal Consumption Expenditures (PCE) data, partially erasing the previous day’s strong gains.
Compared to yesterday’s closing price at 1.36475, GBP/USD has slightly retreated, reflecting market caution ahead of key US inflation data and Federal Reserve monetary policy signals. Meanwhile, improving geopolitical conditions in the Middle East have briefly lifted risk sentiment, helping the Pound to consolidate near higher levels.
This scenario illustrates that GBP/USD is currently in a sideways consolidation phase, waiting for fresh market catalysts. The temporary softening of the Dollar provides some room for further Pound gains, but the absence of a clear driver limits significant breakout potential. For the average investor, this is a watch-and-wait period where upcoming US core inflation figures will be pivotal in shaping whether GBP/USD can break out of its narrow trading range.
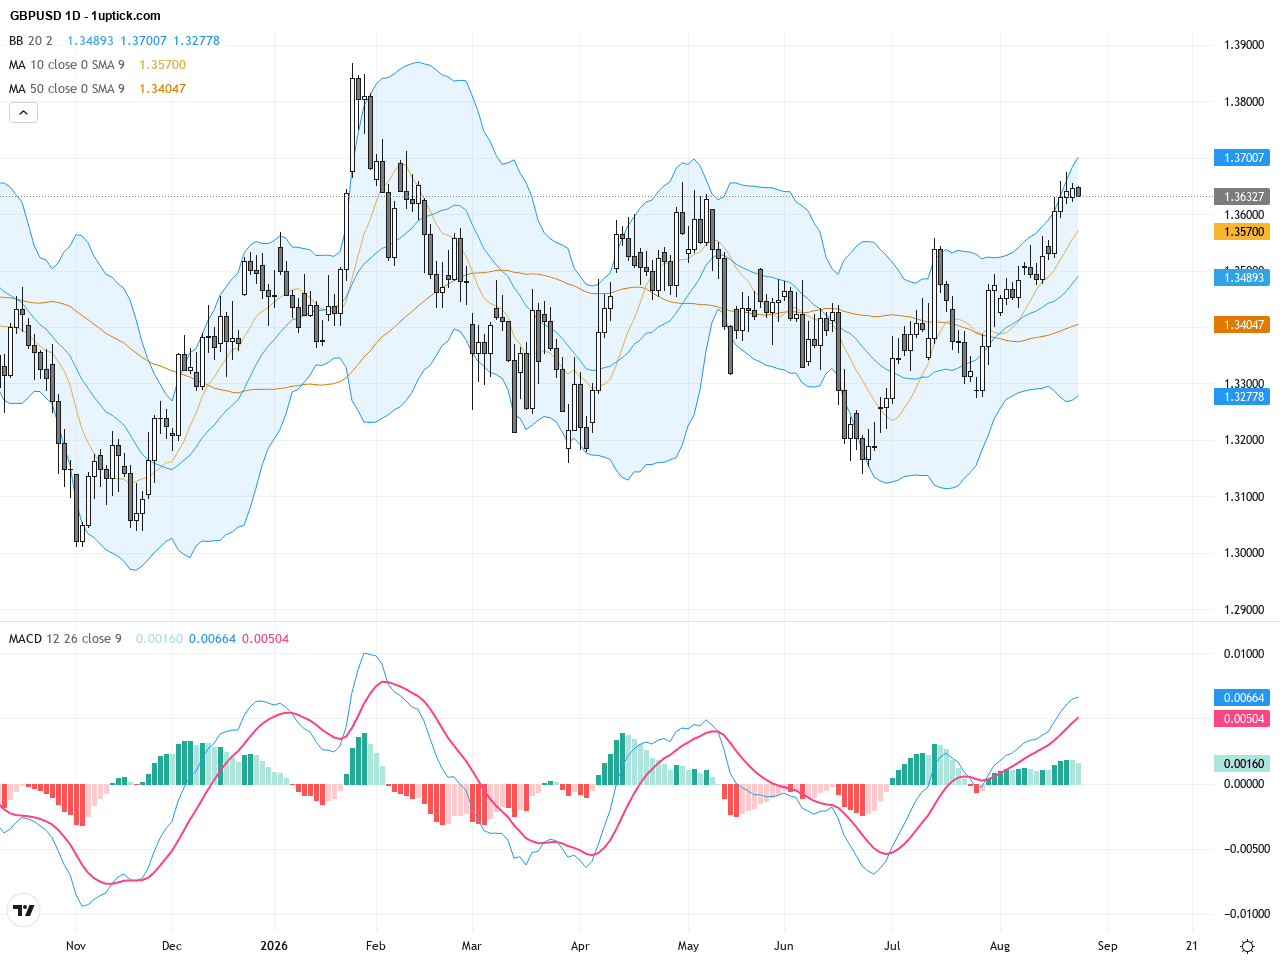
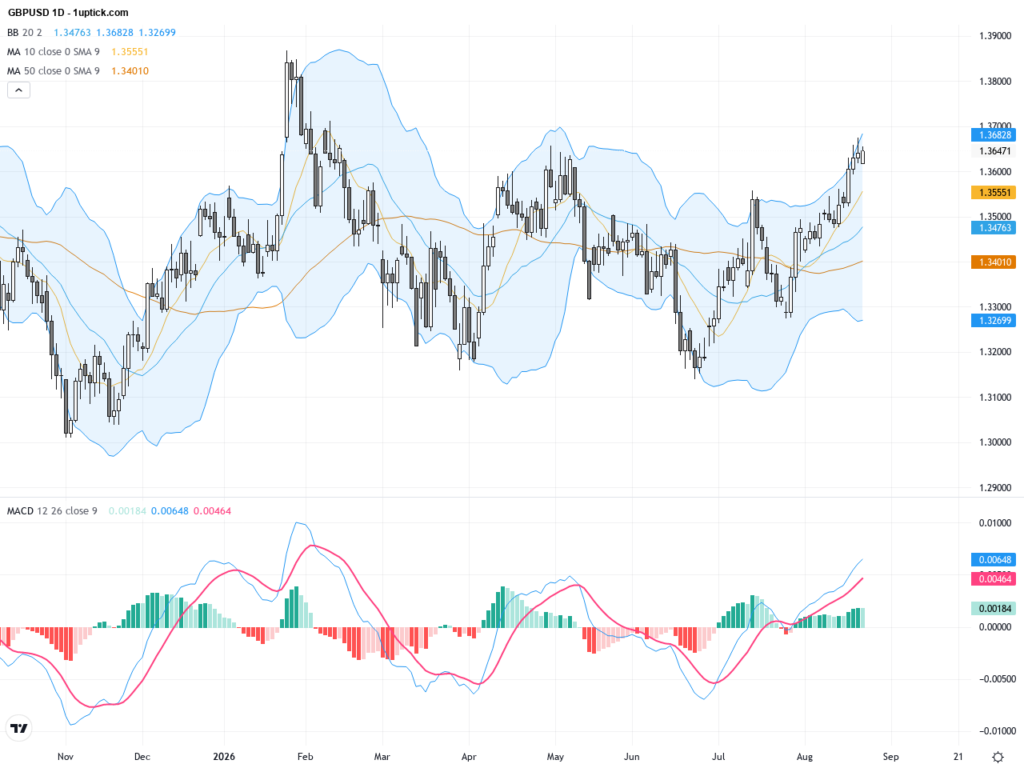
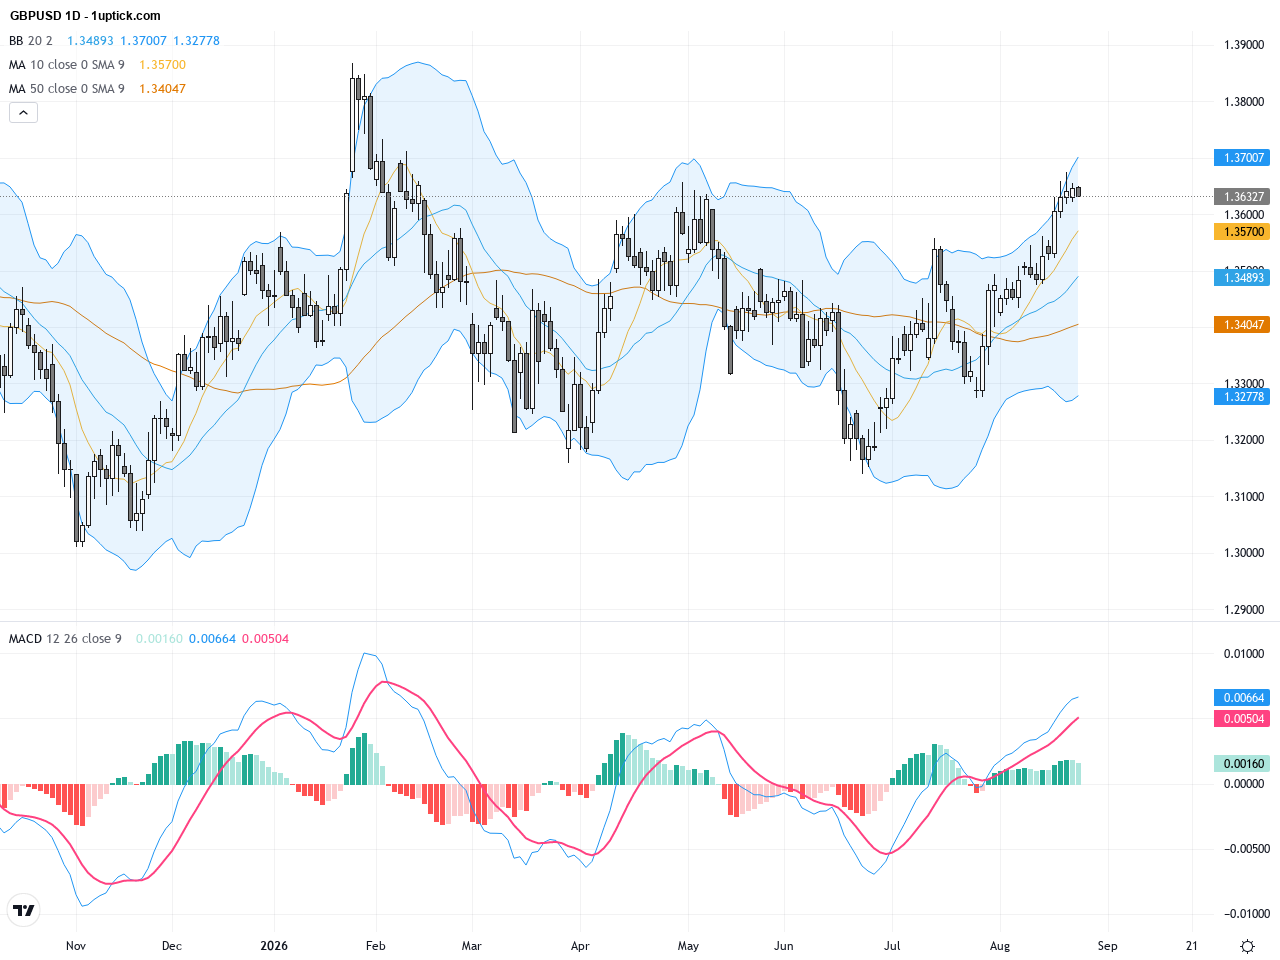
The daily chart shows GBPUSD in a sideways consolidation after an upward trend over recent weeks. The pair has repeatedly tested resistance near 1.3675 without breaking through, signaling some exhaustion from buyers. The support level around 1.3550 remains intact, providing a solid floor. Bollinger Bands are narrowing, indicating decreasing volatility, while the moving averages remain bullishly aligned. The MACD suggests momentum weakening, warning traders to be alert for a possible corrective move.
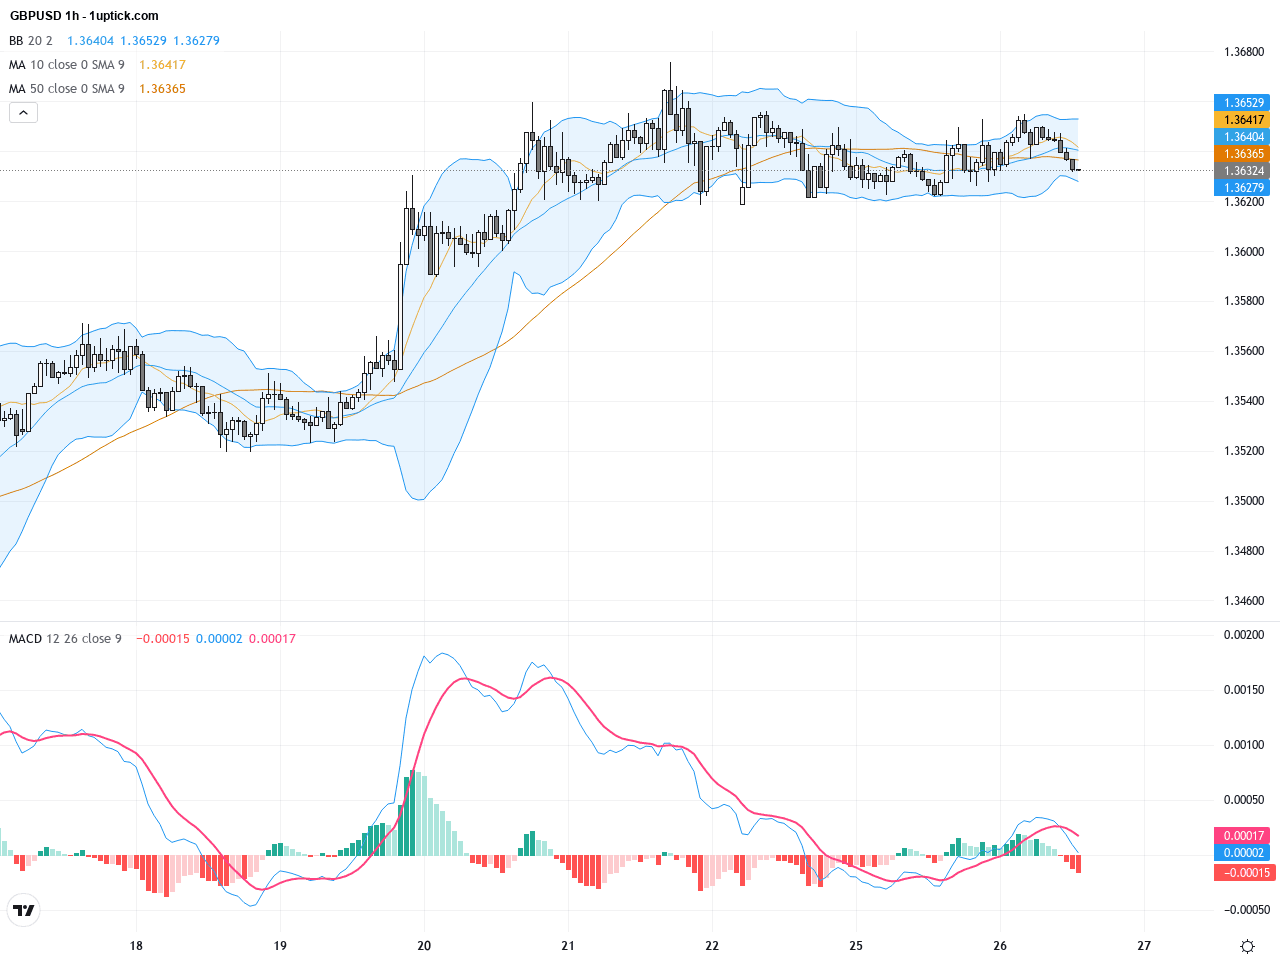
On the hourly chart, GBPUSD has been trading within a tight range between 1.36 and 1.365 over the past 3 to 5 days. Short-term moving averages are intertwined and flattening near the Bollinger Bands’ midline, pointing to equilibrium between buyers and sellers. However, the MACD is showing early signs of a bullish crossover, indicating potential upward momentum in the short term. Additionally, a bullish engulfing candlestick pattern recently formed, suggesting buying pressure may push the price higher within the next 24 hours.
Technical Trend: GBPUSD is currently in a cautious consolidation phase, trading near multi-month highs with a mildly bullish bias but reduced short-term volatility, awaiting a decisive breakout.
Technically, GBPUSD is carving out a potential flag continuation pattern on the daily chart, starting from the recent high and consolidating in a tightening range. Flag patterns usually precede trend continuation. The recent hourly bullish engulfing candle is a key short-term bullish signal. Additionally, the MACD turning positive and the narrowing Bollinger Bands suggest that volatility is about to expand, possibly triggering a breakout. A sustained move above 1.365 could open the door to challenge the resistance cluster near 1.3675 to 1.37.Today’s economic calendar at GMT+1 highlights several key US data releases at 14:30, including July’s Personal Consumption Expenditures (PCE) and core PCE figures, essential for inflation outlooks. Expectations are for a 0.1% monthly increase in PCE and a 0.2% gain in core PCE. Should the data surpass forecasts, the US dollar will likely strengthen, pressuring GBPUSD lower. Conversely, weaker data would support sterling gains. The UK’s CBI Realized Sales data at 12:00 may also influence GBPUSD trading if results diverge significantly from expectations. Overall, traders should prepare for potential volatility around these releases.
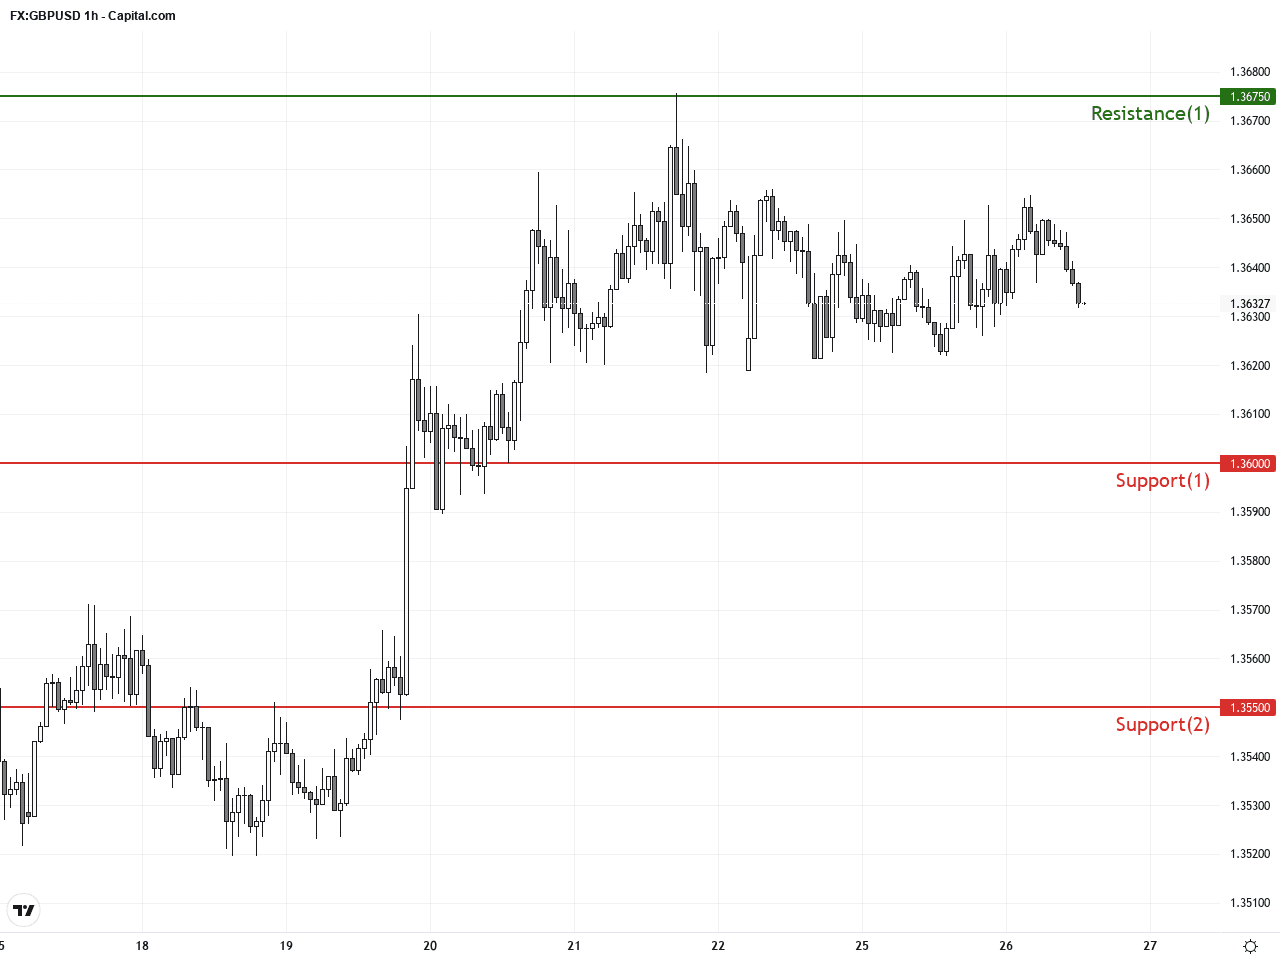
Resistance & Support
The above financial market data, quotes, charts, statistics, exchange rates, news, research, analysis, buy or sell ratings, financial education, and other information are for reference only. Before making any trades based on this information, you should consult independent professional advice to verify pricing data or obtain more detailed market information. 1uptick.com should not be regarded as soliciting any subscriber or visitor to execute any trade. You are solely responsible for all of your own trading decisions.