


 |
| Gold V.1.3.1 signal Telegram Channel (English) |
USDCAD Trading Outlook: RSI Rebound Sparks Bullish Momentum Toward 1.3900 Resistance, August 27, 2026
2026-08-27 @ 13:01
Over the past 48 hours, the USD/CAD currency pair has shown notable volatility. Yesterday’s closing price stood at 1.38818, with the rate dipping to a daily low of 1.3833 before rebounding approximately 0.26%. This upward move was primarily driven by higher-than-expected US inflation data, particularly the core Personal Consumption Expenditures (PCE) price index surpassing estimates, which bolstered buying interest in the US dollar.
Additionally, the US GDP growth rate for the second quarter came in at 1.5%, in line with market expectations, providing further support to the greenback. Against this macroeconomic backdrop, investors leaned towards a bullish view on the dollar, with USD/CAD maintaining strength above 1.3850, while GBP/USD and AUD/USD showed signs of weakening in comparison.
Heightened US-Canada tariff tensions have injected some uncertainty into the market, but near-term USD/CAD trends remain gradually upward. Although tariffs could increase corporate costs and squeeze profits, the market has largely priced in these risks, making USD/CAD a key indicator of broader risk appetite shifts. Moreover, the Biden administration’s temporary three-day pause on a proposed 50% tariff on Canadian imports has briefly eased market jitters, causing the pair to pull back slightly to around 1.3877.
For the average investor, this means that with solid US economic data and a temporary truce in trade tensions, USD/CAD has short-term upside potential, but risks from ongoing trade disputes persist. Traders should watch closely whether the pair can break above the key psychological level of 1.3900, which would signal continued strength in the US dollar.

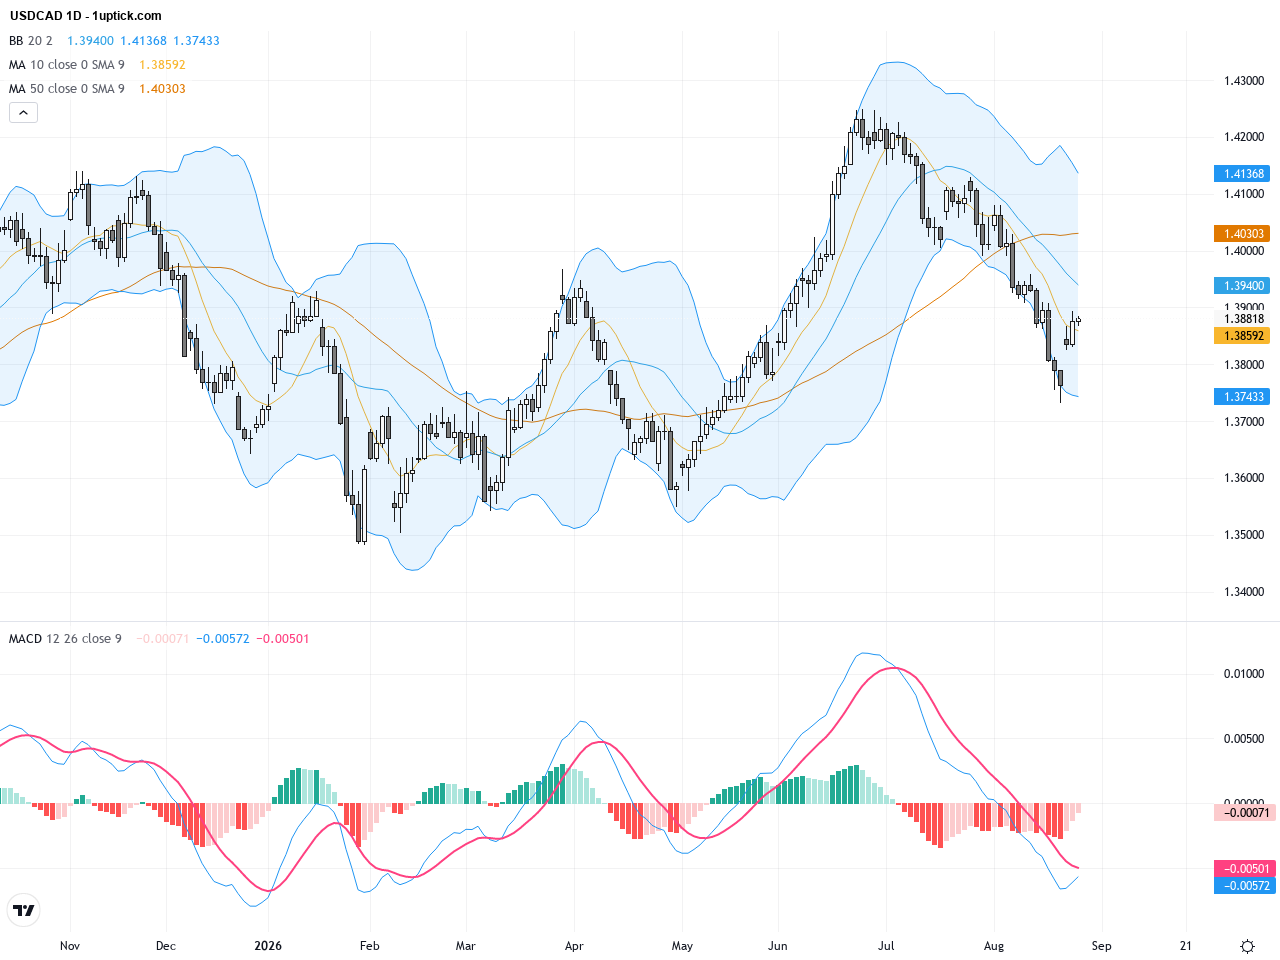
The daily chart shows USDCAD in a steady uptrend since the start of the year, recently oscillating around the 1.38-1.39 range, hovering near the 20-day EMA at about 1.3870. Bollinger Bands position prices between the middle and upper bands, while RSI recovery above 50 indicates strengthening bullish momentum. The MACD histogram shifted from negative to positive with the fast line slowly crossing the slow line, signaling an emerging short-term uptrend. The overall trend is bullish, but resistance is evident around current levels, setting up a potential breakout target.
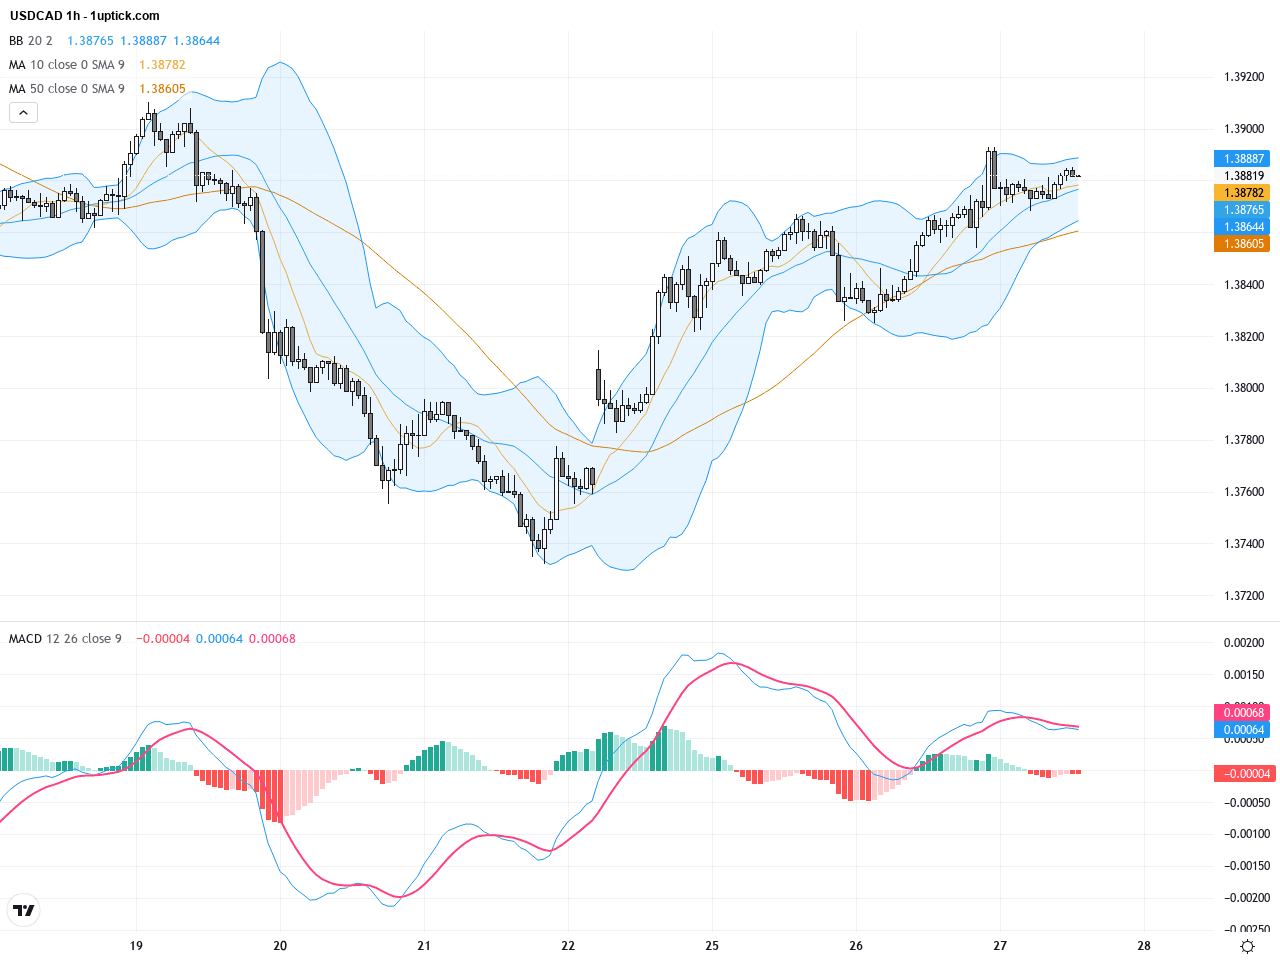
The hourly chart over the past five days reflects a dip to support near 1.3833 followed by a swift rebound. Prices have ranged between 1.3850 and 1.3890 with Bollinger Bands expansion evident. Short-term moving averages have formed a golden cross, while the MACD histogram continues rising, confirming increasing short-term momentum. A recent bullish engulfing candlestick suggests a higher probability of gains in the next 24 hours. The short-term view is bullish, with traders watching for a break above 1.3900.
Technical Trend: Current trend is cautiously bullish, with strengthening upward momentum contained near the 1.3900 resistance zone.
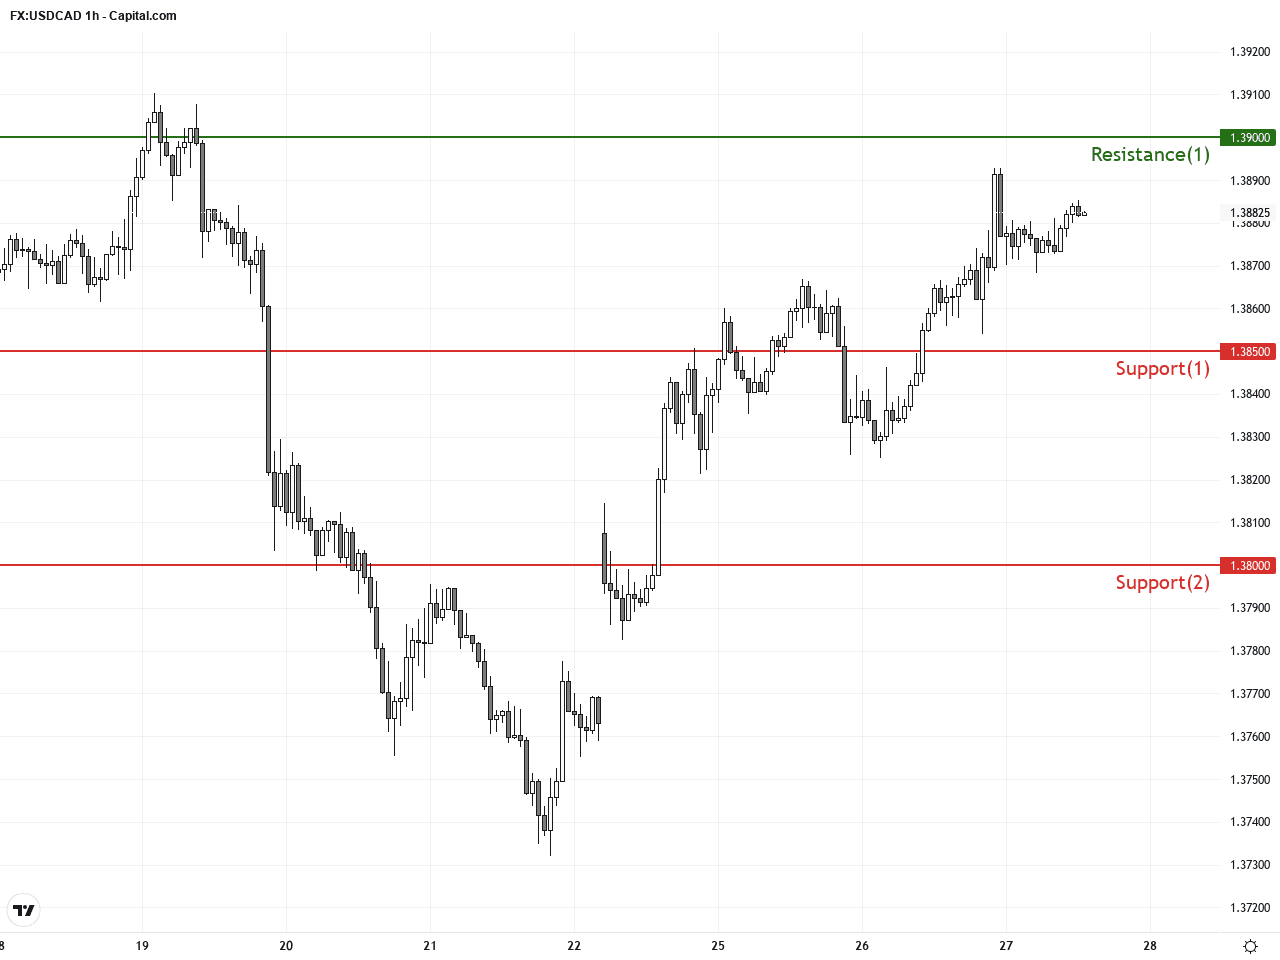
Key technical insight lies in the RSI recovery signaling return of buyers and the daily MACD bullish crossover indicating growing upward strength. Hourly chart’s bullish engulfing pattern combined with moving average golden cross supports near-term upside momentum. Resistance at 1.3900 is a pivot point; a breakout could spark a fresh bullish leg. Trade tensions remain a wildcard for volatility risks.Today’s GMT+1 economic calendar reveals no significant events directly impacting USDCAD. While US international trade data and Canadian current account figures are released at 14:30, no sharp volatility is expected. Traders should instead focus on future US employment data and trade policy updates for further market direction.
Resistance & Support
The above financial market data, quotes, charts, statistics, exchange rates, news, research, analysis, buy or sell ratings, financial education, and other information are for reference only. Before making any trades based on this information, you should consult independent professional advice to verify pricing data or obtain more detailed market information. 1uptick.com should not be regarded as soliciting any subscriber or visitor to execute any trade. You are solely responsible for all of your own trading decisions.