








 |
| Gold V.1.3.1 signal Telegram Channel (English) |
USDCAD Technical Consolidation Amid Rising Oil and Hawkish Fed Signals, September 1, 2026
2026-09-01 @ 13:01
Over the past 24 to 48 hours, the USD/CAD pair has hovered in the mid-1.3800 range during Asian trading sessions, showing limited volatility overall. Despite short-lived rebounds in the US dollar against the Canadian dollar, there has been a lack of consistent follow-through selling, reflecting a cautious market balance between rising Federal Reserve rate hike expectations and climbing oil prices. The pair closed yesterday around 1.3866, remaining near recent price levels.
Recent market news highlights that renewed US-Iran tensions have driven crude oil prices higher, providing support for the commodity-linked Canadian dollar. At the same time, Federal Reserve Chair’s hawkish speech last weekend reinforced bets on further rate hikes in the US. These opposing forces have led to a consolidating USD/CAD price action. For investors, it is like a tug-of-war: Fed-induced dollar strength versus oil-driven Canadian dollar support, neither side gaining decisive control, keeping the pair in a tight range for now.
For the average investor, this means a short-term trading environment loaded with uncertainty as policy direction and geopolitical risks concurrently shape currency movement. It is advisable to watch upcoming Canadian economic data releases and Fed comments closely to gauge future momentum, especially amid ongoing oil price fluctuations and US trade policy risks.
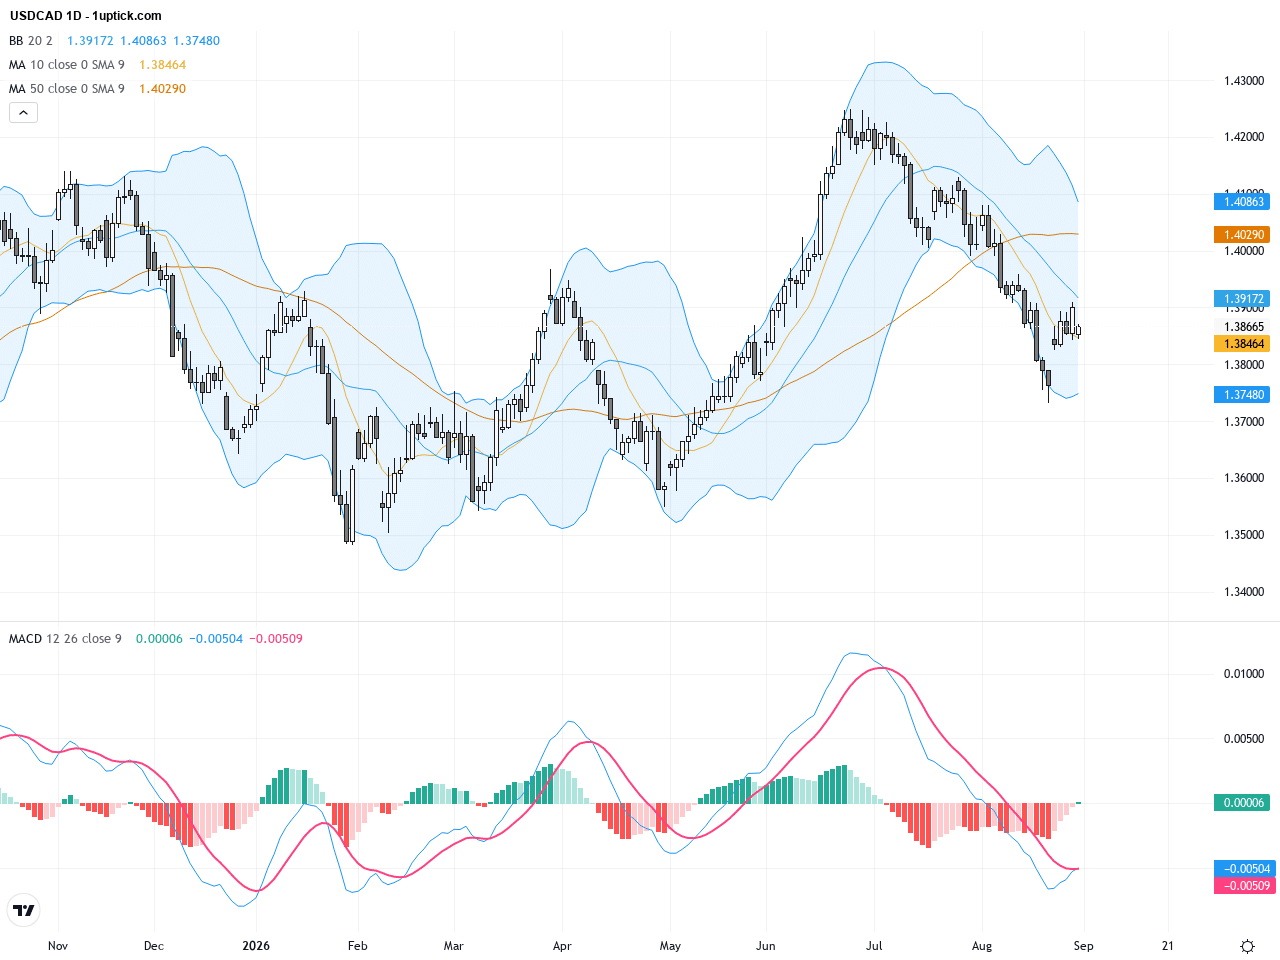
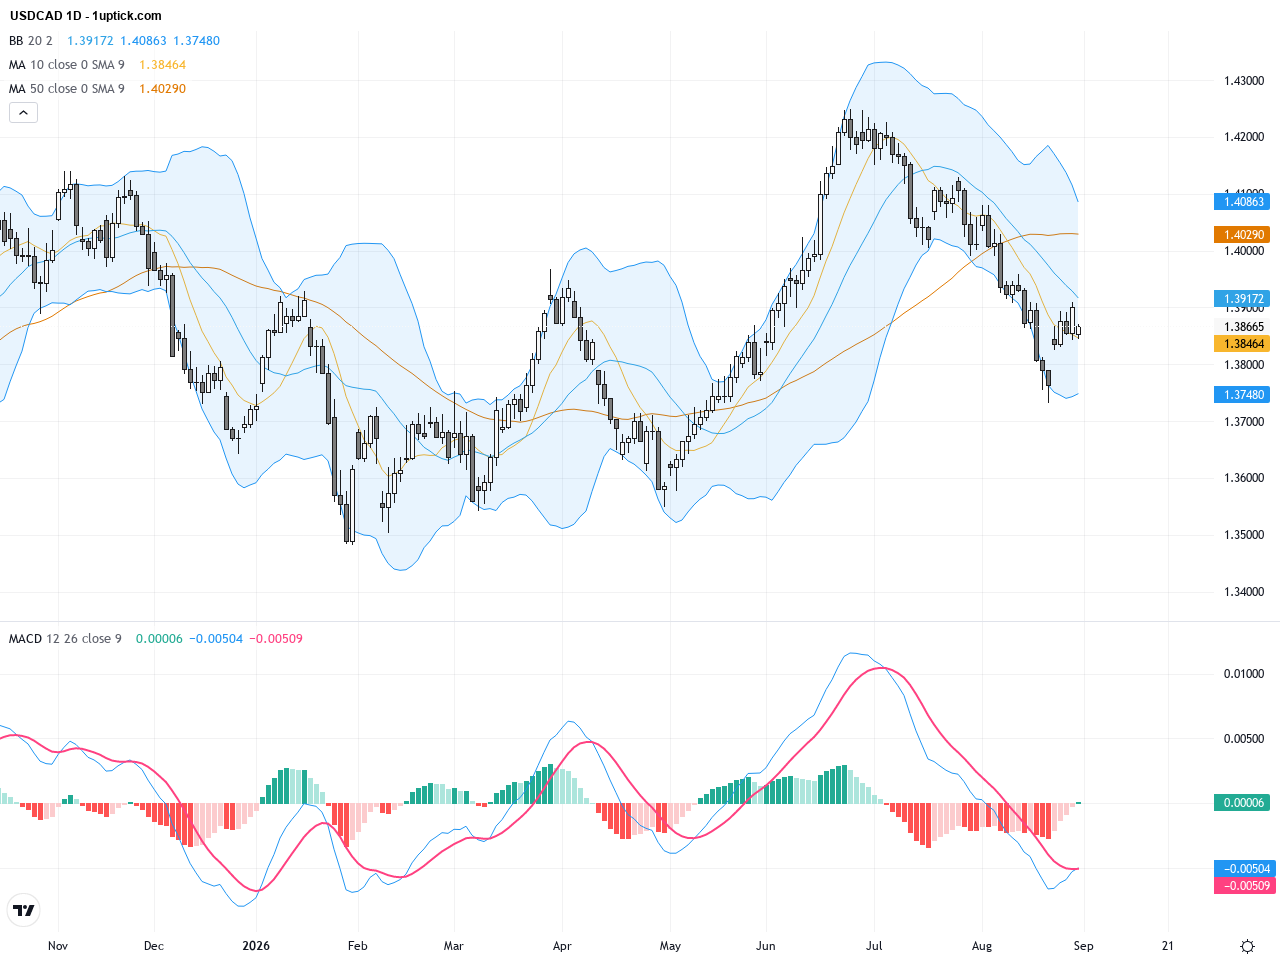
The daily chart shows USDCAD mostly range-bound with a slight bearish bias over recent weeks, with price repeatedly testing resistance near 1.3850-1.39. The 50-day moving average sits around 1.40, above current price, while the 200-day MA near 1.38 acts as near-term support. Bollinger Bands are contracting, indicating lower volatility, and MACD shows a subtle bullish crossover, suggesting potential for a rebound if momentum builds.
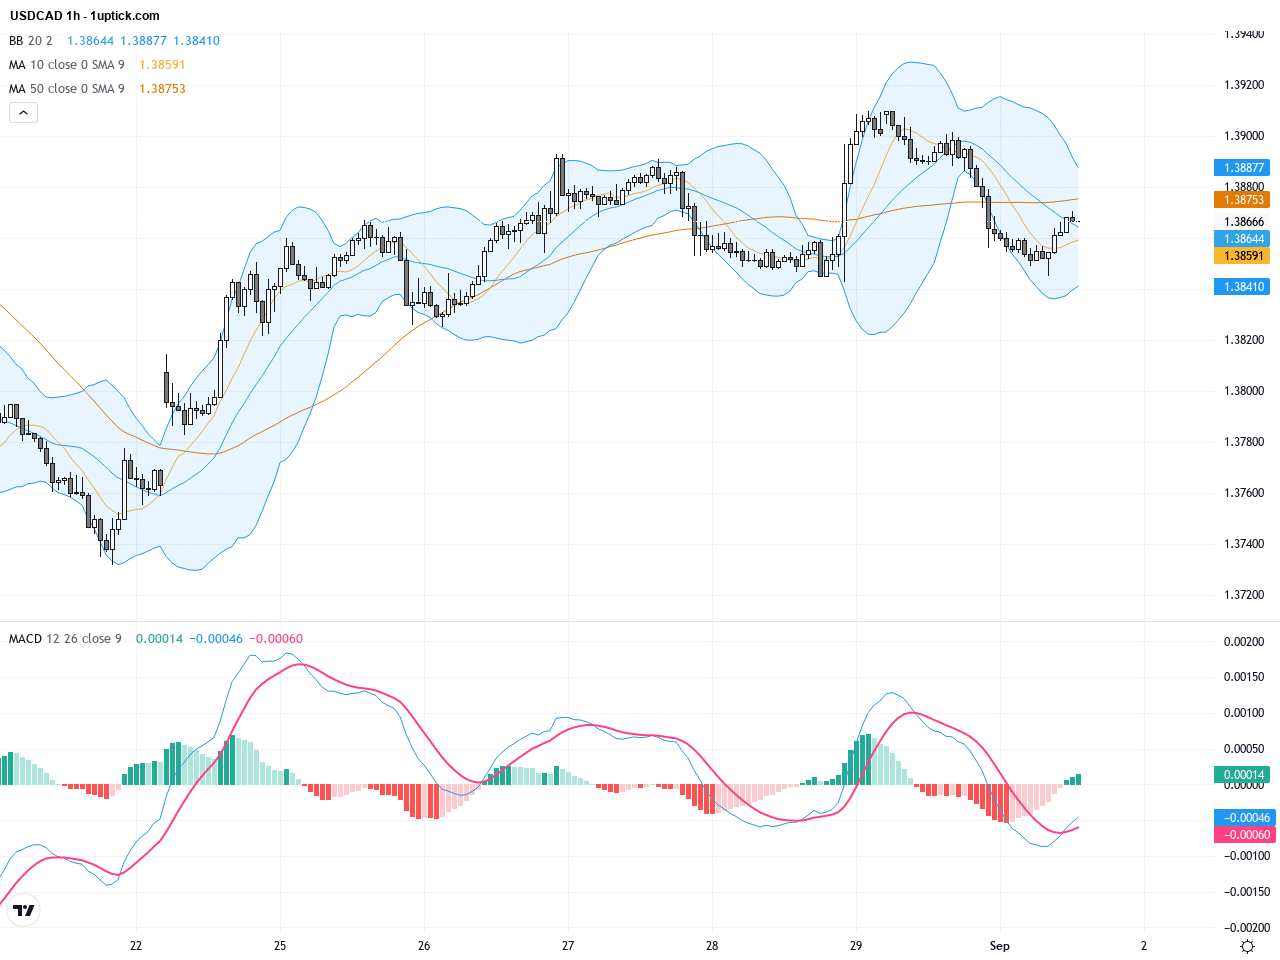
On the hourly chart covering the last 3-5 days, USDCAD price action exhibits diminished volatility, fluctuating between 1.3850 and 1.3880. Short-term EMAs (13 and 26 periods) are nearing a crossover while the MACD histogram is shrinking, with narrowing Bollinger Bands highlighting consolidation and absence of a clear breakout direction in the near term.
Technical Trend: USDCAD is currently in a cautious sideways consolidation phase with stable price compression.
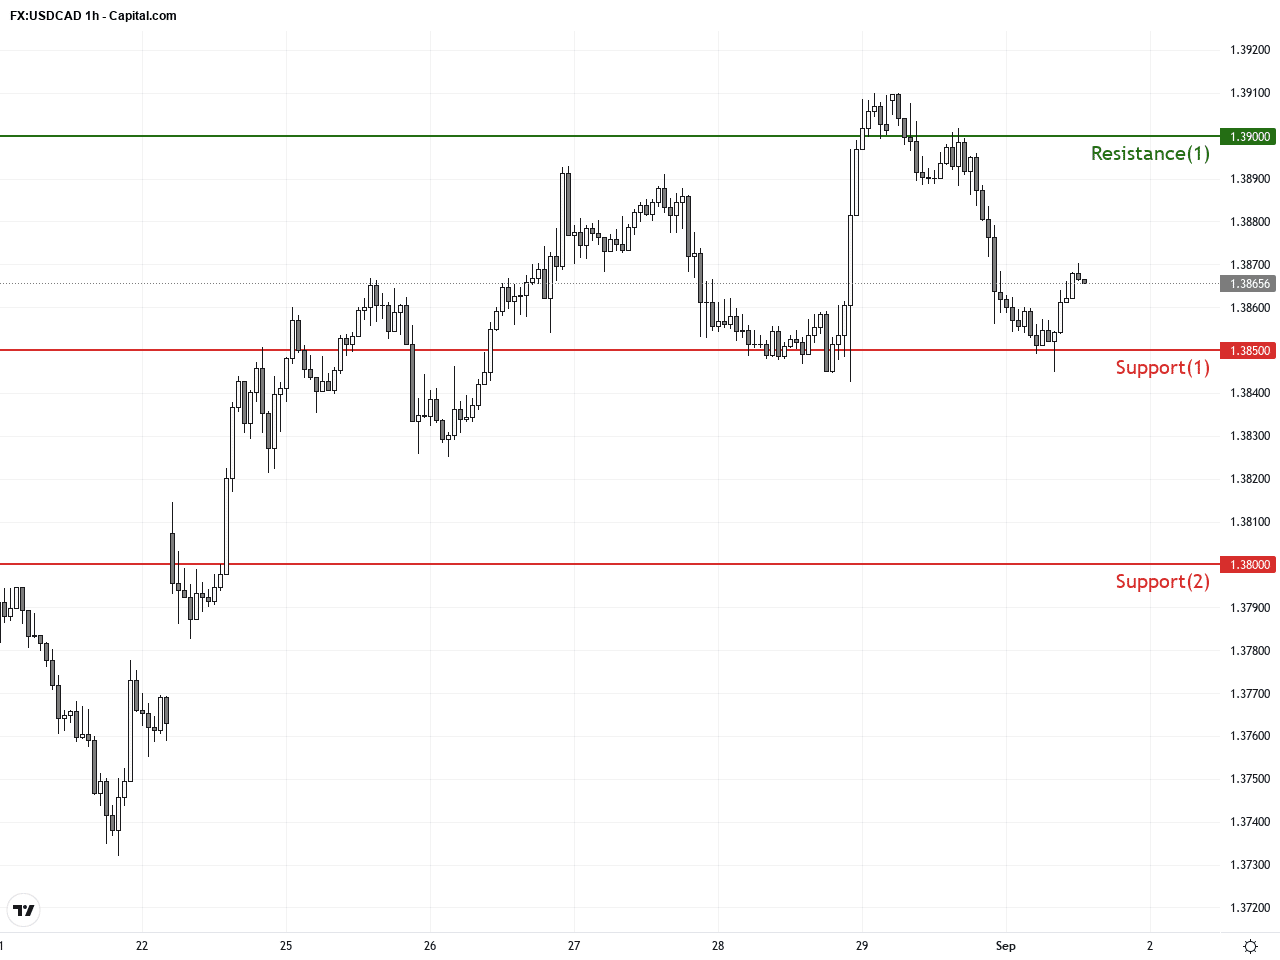
Technically, USDCAD is consolidating just below the key 1.39 resistance, forming a rectangle pattern. This suggests a potential buildup for a breakout. Recent daily candle formations include Dojis signaling indecision, but a bullish engulfing candle close above 1.39 would indicate a strong short-term buying opportunity. The MACD is nearing a golden cross close to zero, signaling momentum may soon shift from bearish to bullish, offering traders a potential high-probability entry point.Today’s economic calendar offers no direct major Canadian data releases relevant to USDCAD ahead of late US PMI and ISM manufacturing reports scheduled in the evening (GMT+1). The US data will likely influence the pair, where better-than-expected figures may bolster USD strength and push USDCAD higher, while weaker data could soften the pair. Early Asia-Pacific PMI releases from Japan and China are of limited influence on USDCAD today.
Resistance & Support
The above financial market data, quotes, charts, statistics, exchange rates, news, research, analysis, buy or sell ratings, financial education, and other information are for reference only. Before making any trades based on this information, you should consult independent professional advice to verify pricing data or obtain more detailed market information. 1uptick.com should not be regarded as soliciting any subscriber or visitor to execute any trade. You are solely responsible for all of your own trading decisions.