








 |
| Gold V.1.3.1 signal Telegram Channel (English) |
USDJPY: Bullish Momentum Builds as Technical Patterns Signal Potential Breakout, September 2, 2026
2026-09-02 @ 11:01
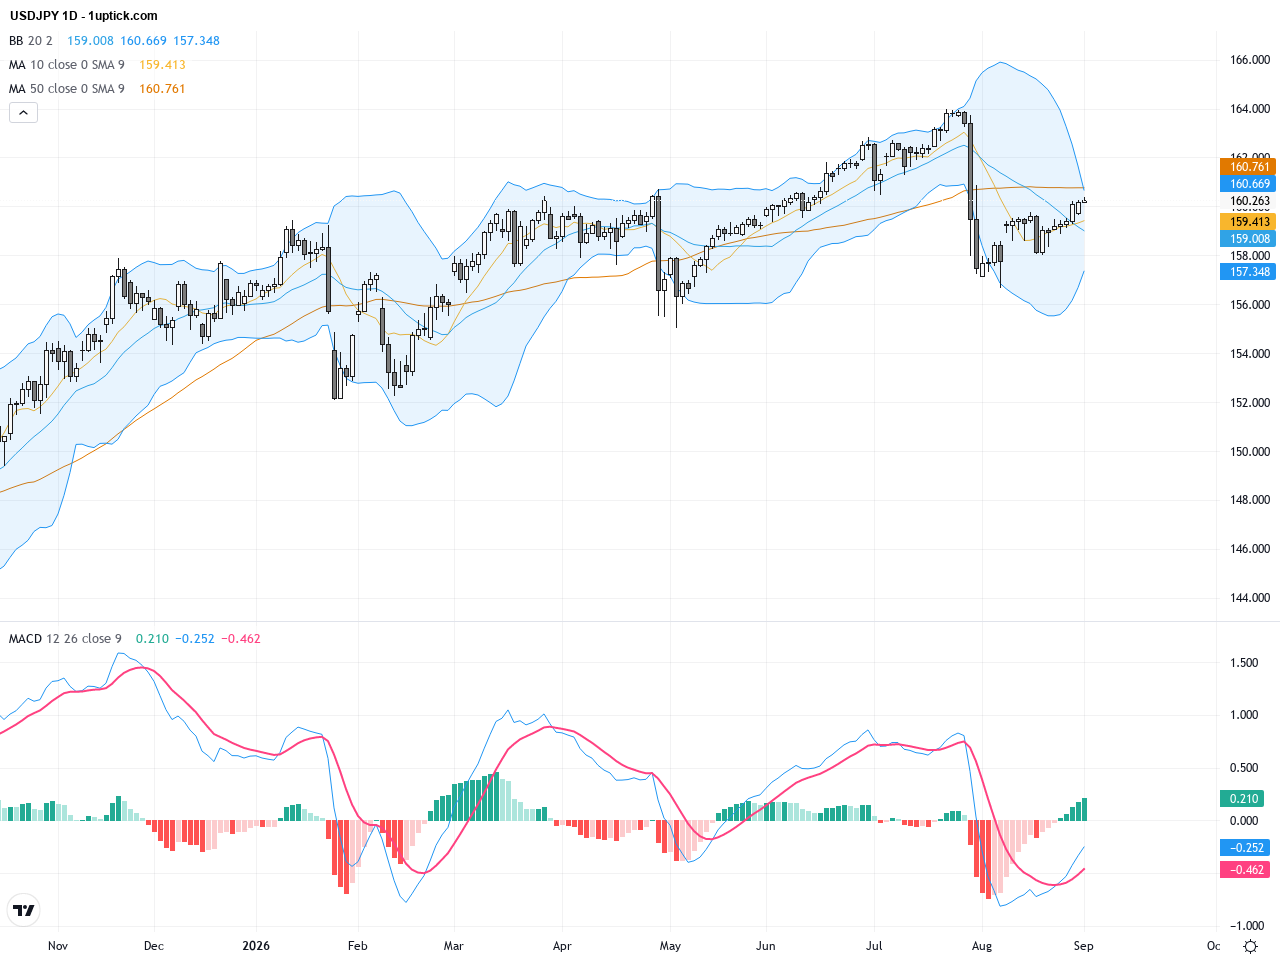
Over the past 24 to 48 hours, the USD/JPY pair demonstrated notable volatility, consolidating around the 160.25 to 160.30 range, near its highest level since late July. Yesterday’s closing price was approximately 160.26, a slight increase from the previous day, indicating a firm bullish stance overall.
The market movement was primarily driven by concerns over Japan’s fiscal situation and the widening interest rate gap between the US and Japan. Persistent Japanese fiscal deficits combined with rising US Treasury yields and a hawkish Federal Reserve stance have boosted the US dollar, pushing USD/JPY above the key 160 level. US Treasury Secretary Scott Bessent’s increased pressure on the Bank of Japan also weakened the yen, a major factor supporting the pair’s elevated price level.
For the average investor, this means the yen’s traditional safe-haven status is being undermined by the strengthening dollar, raising potential exchange rate risk for yen-denominated holdings. With the Bank of Japan yet to decisively adjust its interest rate policy, uncertainty remains. Meanwhile, the Federal Reserve’s hawkish tone continues to bolster the dollar, keeping USD/JPY elevated and hinting at the potential for further upside should US economic data remain robust.
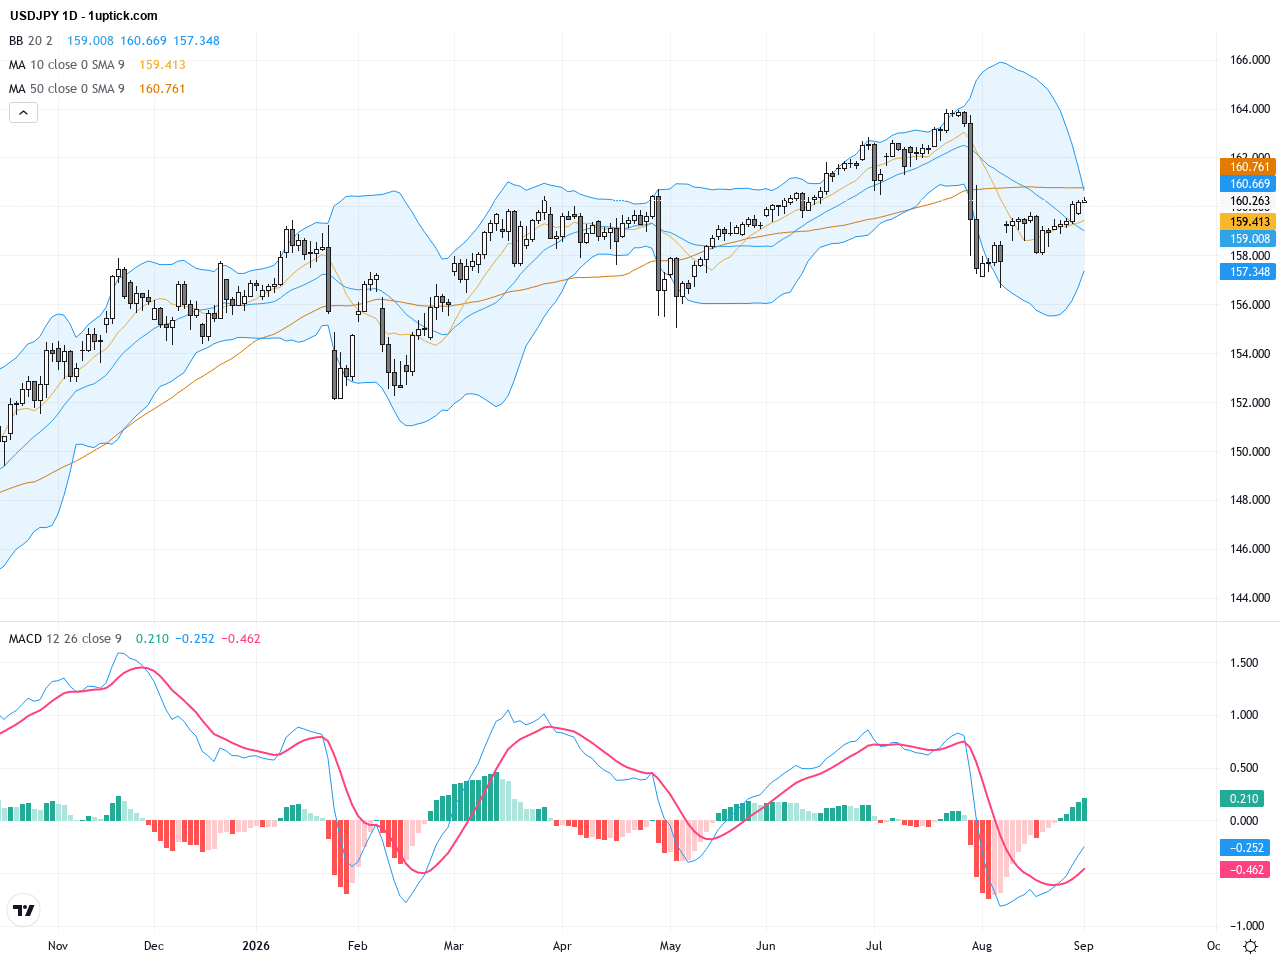
The daily chart reveals a sustained uptrend for USDJPY since the start of the year, with price trading above key moving averages. The 50-day MA sits near 160.87 and the 200-day MA near 158.42, both sloping upwards, signaling strong trend support. Bollinger Bands are expanding slightly, indicating increased volatility, while the MACD remains comfortably in bullish territory with a positive crossover. The recent breakout above the 159.55 resistance confirms growing bullish momentum as the pair tests new highs.
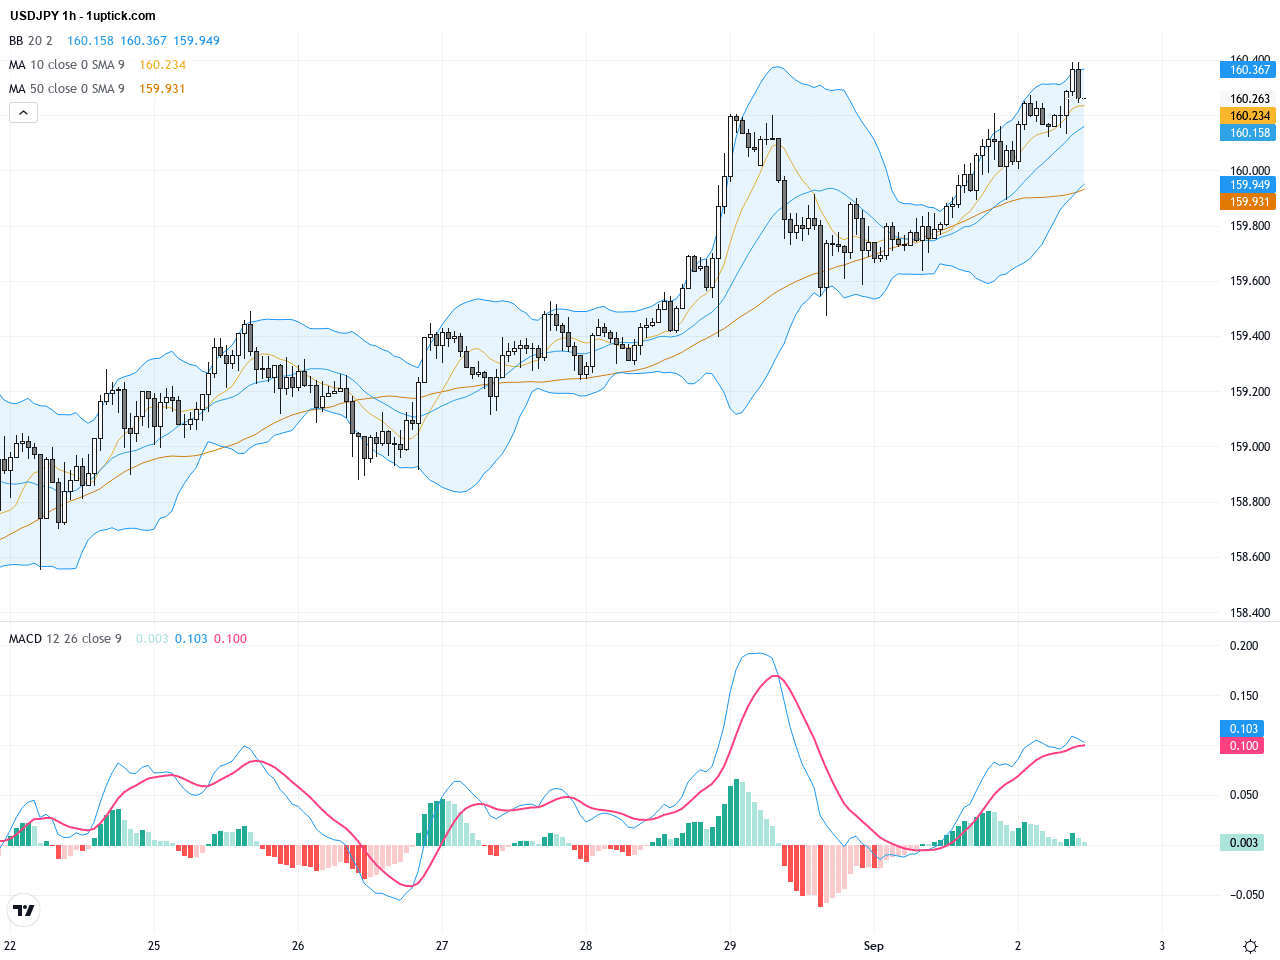
On the hourly chart spanning the last 3-5 days, USDJPY has traded within a tight range between 160.10 and 160.40. The price has repeatedly tested the 160.30 resistance but has not yet decisively broken it. Short-term EMAs (9 and 21) display mixed signals suggesting consolidation. The MACD shows mild corrective moves but no divergence, indicating balance between buyers and sellers. Price is supported well at the middle Bollinger Band, and a break above 160.40 could trigger a fresh bullish leg.
Technical Trend: Trend description: Firm bullish trend intact with short-term consolidation favoring upside continuation.
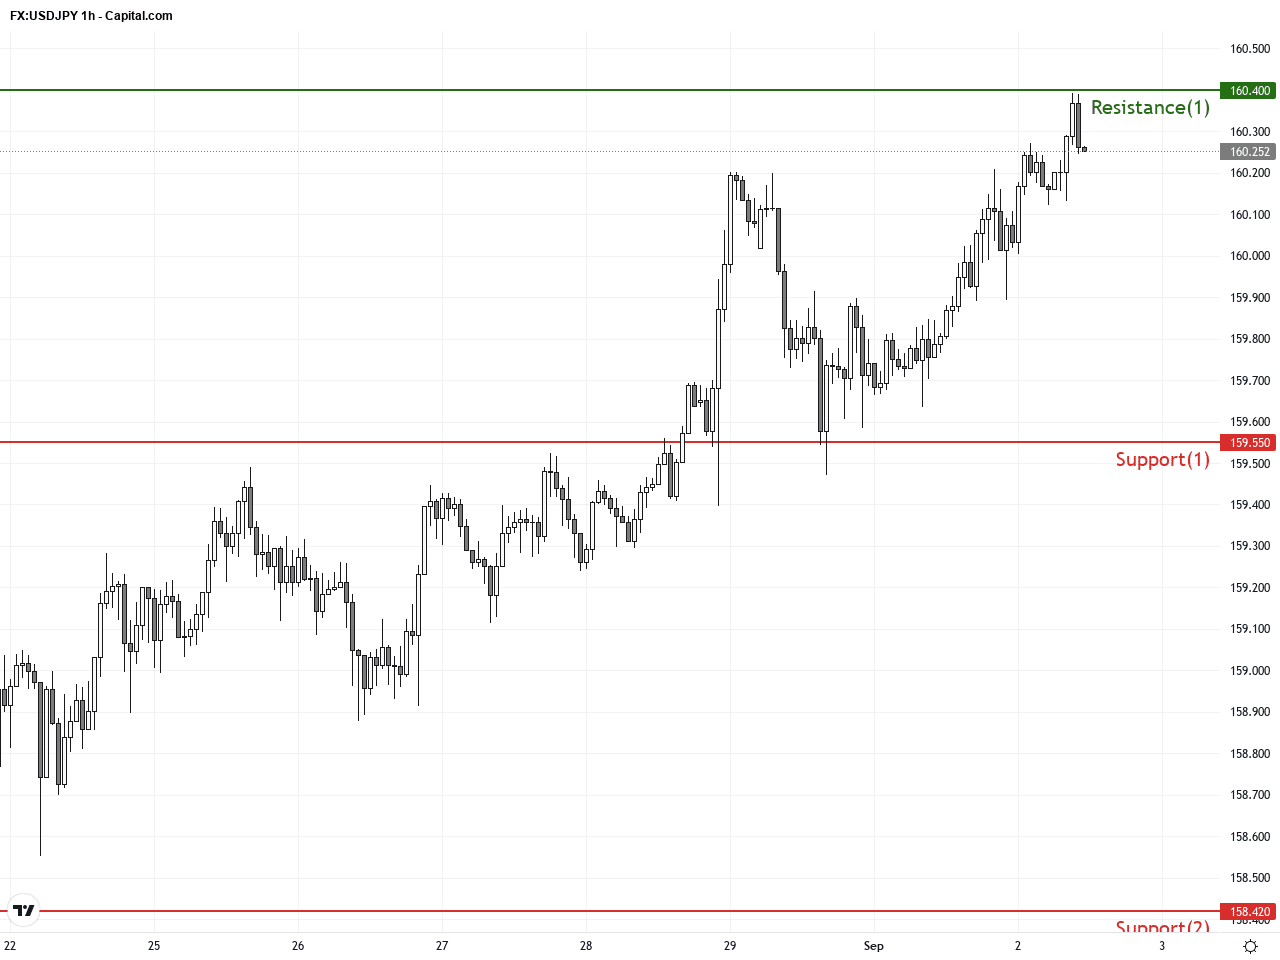
Technically, USDJPY is forming a bullish flag pattern that emerged earlier last week, indicating a likely upward breakout. A recent bullish engulfing candlestick around the 16:00 hour increased buying interest in the short term. The MACD is approaching a bullish crossover, and the RSI remains above 60, confirming persistent buying momentum. Traders should monitor the critical 160.40 resistance closely as a breakout above this could offer a high-probability trade setup.Today’s economic calendar offers no significant or direct events likely to impact USDJPY specifically. Australian GDP data and New Zealand’s interest rate decision occur early but carry limited influence on USDJPY. Market attention remains on the U.S. durable goods orders and Canada’s interest rate decision later in the day. Strong US economic prints could bolster the dollar and uplift USDJPY, while weaker data may introduce downward pressure.
Resistance & Support
The above financial market data, quotes, charts, statistics, exchange rates, news, research, analysis, buy or sell ratings, financial education, and other information are for reference only. Before making any trades based on this information, you should consult independent professional advice to verify pricing data or obtain more detailed market information. 1uptick.com should not be regarded as soliciting any subscriber or visitor to execute any trade. You are solely responsible for all of your own trading decisions.