

 |
| Gold V.1.3.1 signal Telegram Channel (English) |
WTI Crude Oil: Geopolitical Tensions Drive Bullish Momentum with Clear Technical Breakouts, September 3, 2026
2026-09-03 @ 06:03
Over the past 48 hours, West Texas Intermediate (WTI) crude oil has experienced notable volatility. The closing price on September 2, 2026, was $91.01, up from $90.22 the previous day, reflecting a continued rally amid escalating US-Iran tensions.
The key market driver recently has been renewed military strikes between the US and Iran in the Persian Gulf, stoking fresh fears over supply disruptions and pushing oil prices up for the third consecutive session, breaching the $92 mark. This heightened geopolitical risk has led to a significant boost in WTI prices. Furthermore, the news that Kalshi plans to seek approval from the US Commodity Futures Trading Commission (CFTC) for a perpetual WTI futures contract has generated additional market interest, promising investors an innovative, more flexible trading instrument that could attract new capital to the oil market.
For everyday investors, this means two things: first, oil price volatility is likely to remain high due to ongoing geopolitical tensions, presenting both risks and opportunities; second, if Kalshi obtains approval for its perpetual futures contract, it will make investing in WTI crude more accessible and adaptable, helping investors better respond to market movements.
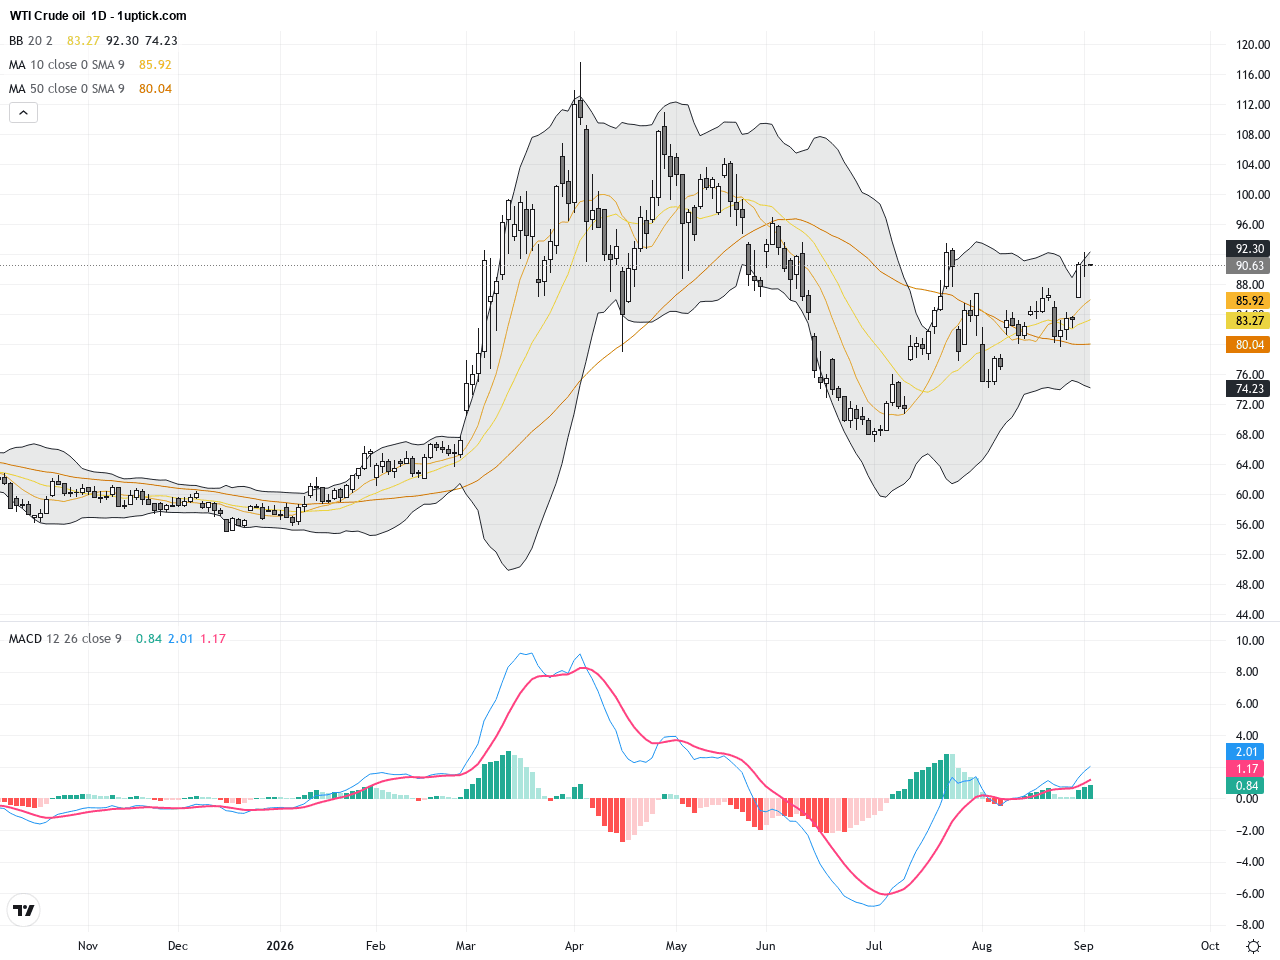
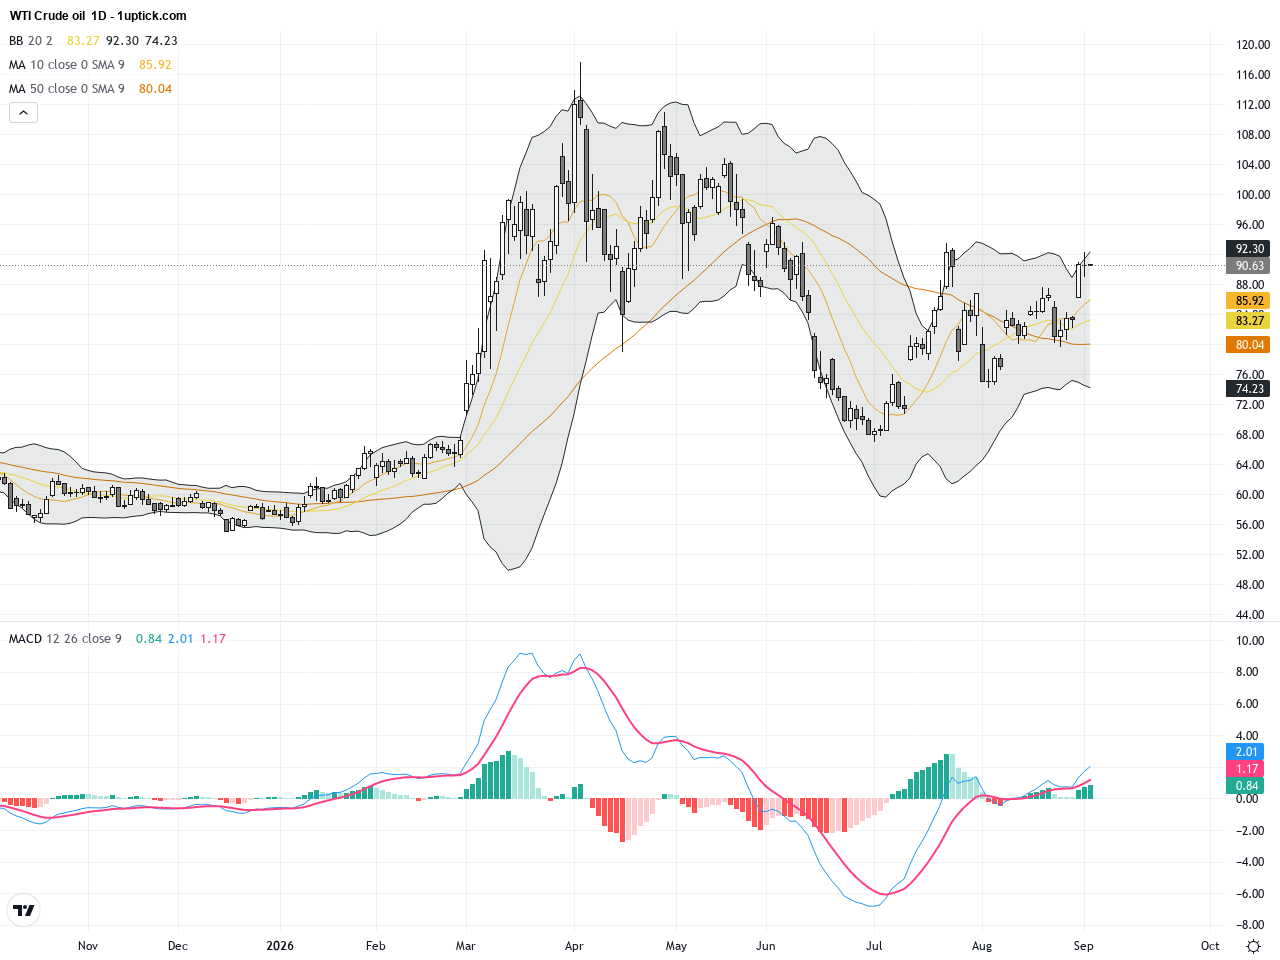
The daily chart reveals a robust uptrend in WTI Crude Oil prices starting from late August, characterized by consistent higher highs and higher lows. The 20-day and 50-day moving averages are aligned bullishly, while the Bollinger Bands are widening, indicating increased volatility. MACD remains positive above the zero line with an expanding histogram, confirming strong buying momentum. Recent price action shows repeated breakouts of resistance levels, demonstrating sustained buyer control.
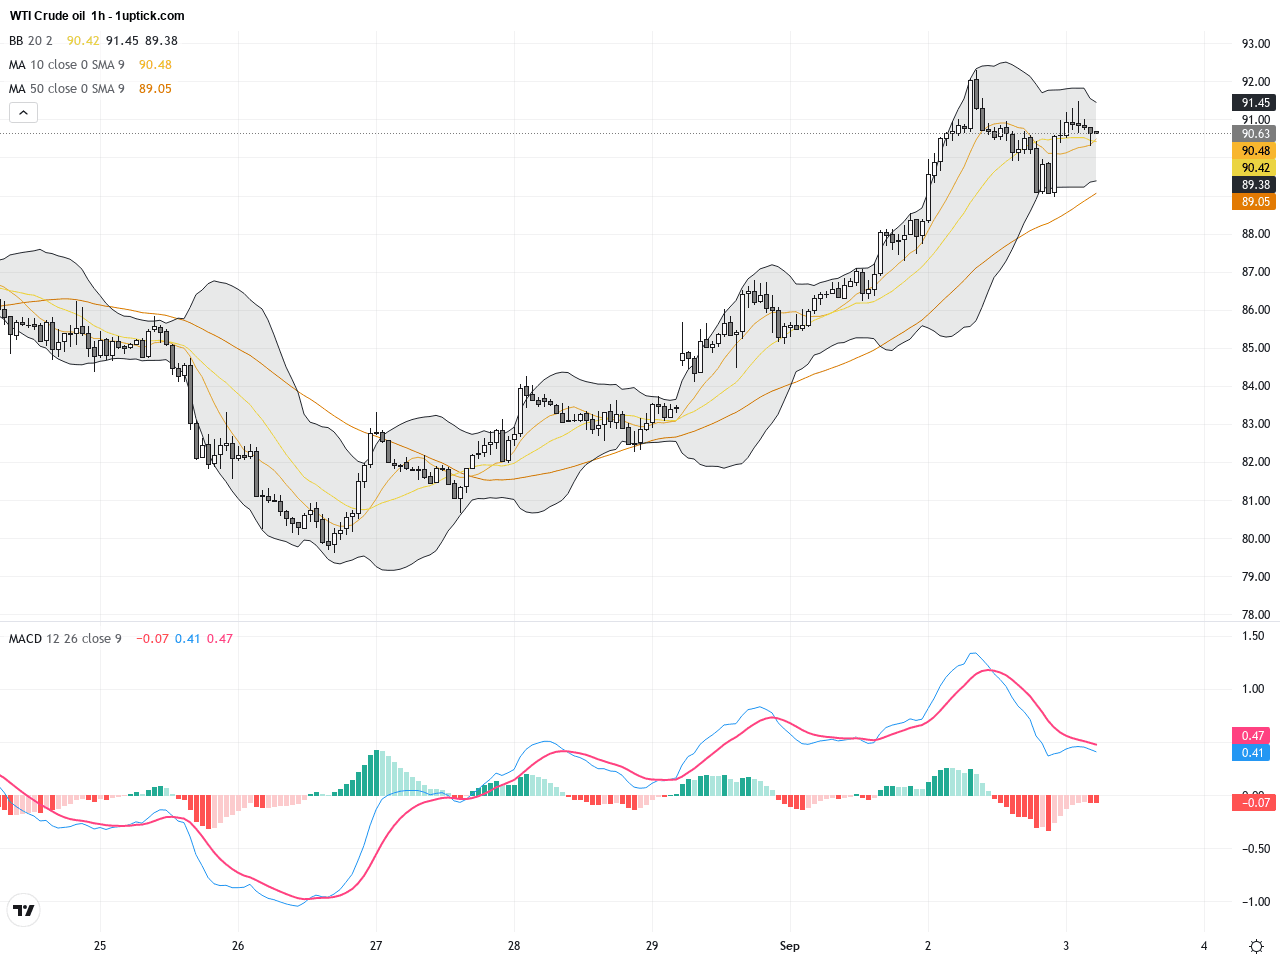
The hourly chart over the past 5 days demonstrates a steady upward movement with price frequently testing the upper Bollinger Band but without significant pullbacks, signaling strong short-term bullish momentum. A recent MACD golden cross consolidates the optimistic momentum picture. Multiple hammer candlestick formations with long lower shadows indicate strong buying interest within 24 hours. Volume spikes during key movements further reinforce price strength.
Technical Trend: WTI Crude Oil is currently in a decisively bullish uptrend.
WTI Crude Oil is technically strong with clear bullish momentum. The short-term MACD golden cross and recurring hammer candlesticks suggest continuation of the upward move. Daily chart Bollinger Band expansion and bullish moving average alignment confirm sustained buying pressure. The price action and volume patterns favor the bulls, pointing to high-probability upside trade opportunities if resistance levels are broken.There are no significant or direct economic events scheduled today impacting WTI Crude Oil. The market remains primarily driven by geopolitical developments affecting supply expectations.
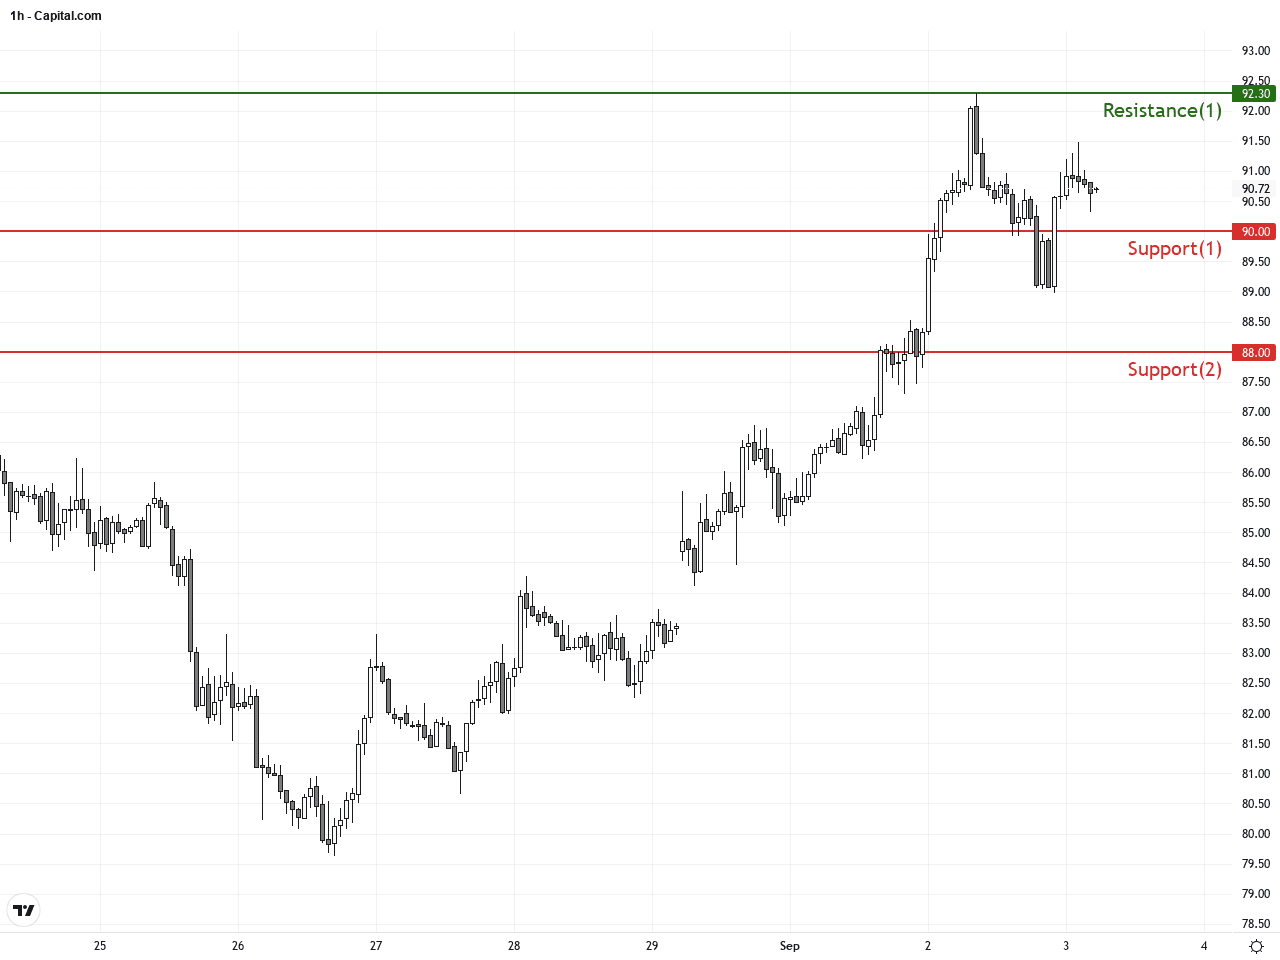
Resistance & Support
Run Live WTI Crude Oil Analysis
The above financial market data, quotes, charts, statistics, exchange rates, news, research, analysis, buy or sell ratings, financial education, and other information are for reference only. Before making any trades based on this information, you should consult independent professional advice to verify pricing data or obtain more detailed market information. 1uptick.com should not be regarded as soliciting any subscriber or visitor to execute any trade. You are solely responsible for all of your own trading decisions.