









 |
| Gold V.1.3.1 signal Telegram Channel (English) |

WTI Crude Oil: Breaking $100 Highlights Strong Technical and Fundamental Momentum, September 10, 2026
2026-09-10 @ 06:03
Over the past 24 to 48 hours, WTI Crude Oil has experienced significant volatility and a breakout. Starting from a closing price of $96.05 on September 9, the price surged to surpass the $100 per barrel mark, hitting the highest level since May 22. This movement was primarily driven by escalating tensions in the Middle East, especially the ongoing US-Iran strikes and increased attacks by the Houthis, raising concerns over potential disruptions in the Strait of Hormuz supply route.
At the same time, the US dollar index recovered from its recent lows due to smaller Treasury buybacks and higher short-term Treasury yields. While a stronger dollar normally puts downward pressure on oil prices, the market’s focus clearly shifted to geopolitical supply risks. The oil price crossing $100 also triggered broader market reactions, including a 400-point drop in the Dow Jones and declines in cruise stocks like Norwegian, reflecting investor worries about rising fuel costs and renewed inflation pressures.
For average investors, this means oil prices are influenced not only by supply-demand fundamentals but also heavily by geopolitical events. In a sharply volatile environment, sudden oil price spikes can rapidly impact energy stocks and overall market sentiment, necessitating close monitoring of international developments and US policy actions.
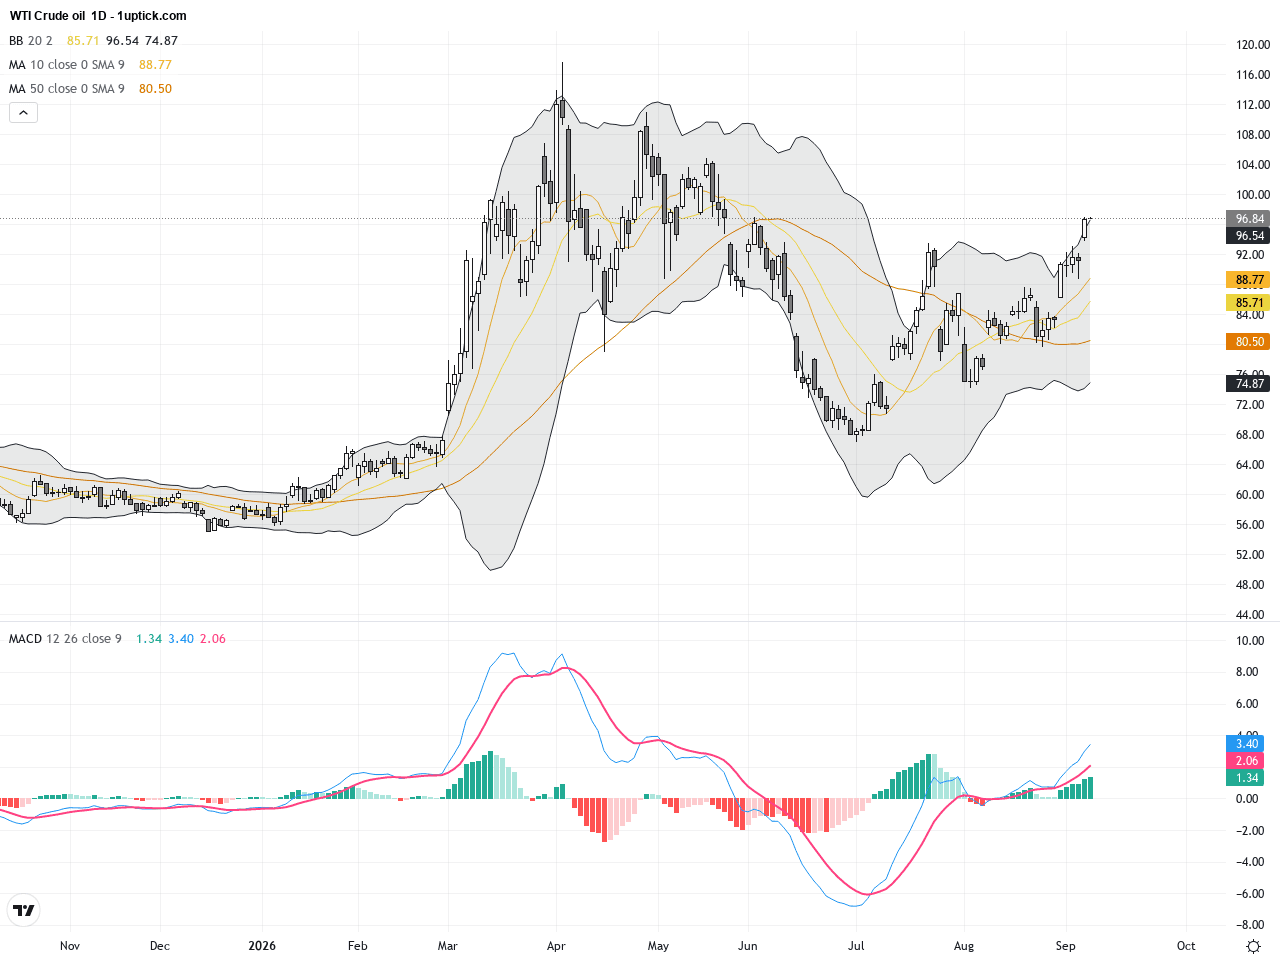
The daily chart reveals a clear uptrend in WTI Crude Oil. Prices have risen from around $83, making multiple higher highs and recently breaking above the $95 resistance level. The Bollinger Bands have expanded after a period of contraction, indicating increased volatility. The 50-day and 200-day moving averages are aligned bullishly, with price trading comfortably above both, signaling strong long-term buying interest. The MACD remains in positive territory, confirming bullish momentum in the medium term.
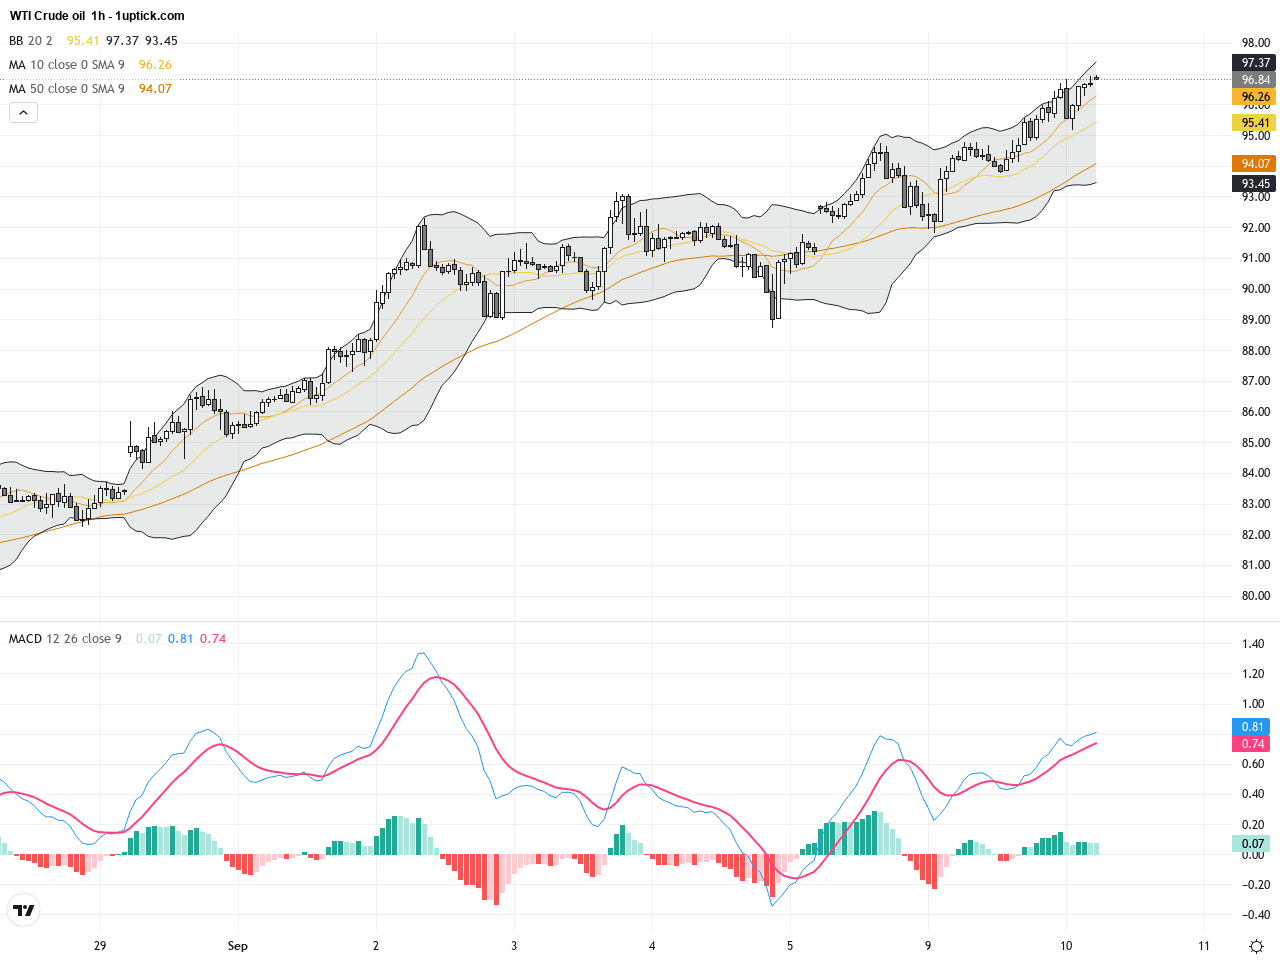
The hourly chart over the past 3 to 5 days shows strong price volatility, with consolidation phases followed by sharp upward moves. Price has touched the upper Bollinger Band multiple times, while the short-term moving averages (10 and 20 EMA) have formed a golden cross, supporting a short-term bullish outlook. MACD histogram expansion further confirms increasing upward momentum, suggesting a probable extension beyond the $100 mark in the near term.
Technical Trend: WTI Crude Oil is currently in a strong bullish trend, maintaining momentum across short to medium-term timeframes.
The key technical highlight for WTI Crude Oil today is the breakout above the $100 level. Both daily and hourly indicators align towards continued bullish momentum, with MACD and EMA crossovers providing solid momentum confirmation. Should prices hold above $100, the path is open for further bullish expansion. Traders may consider long entries on retracements for high-probability trades.There are no significant or directly relevant economic events scheduled today that will impact WTI Crude Oil prices. Market focus remains on geopolitical developments and supply-demand dynamics, which are the key factors driving oil prices currently.
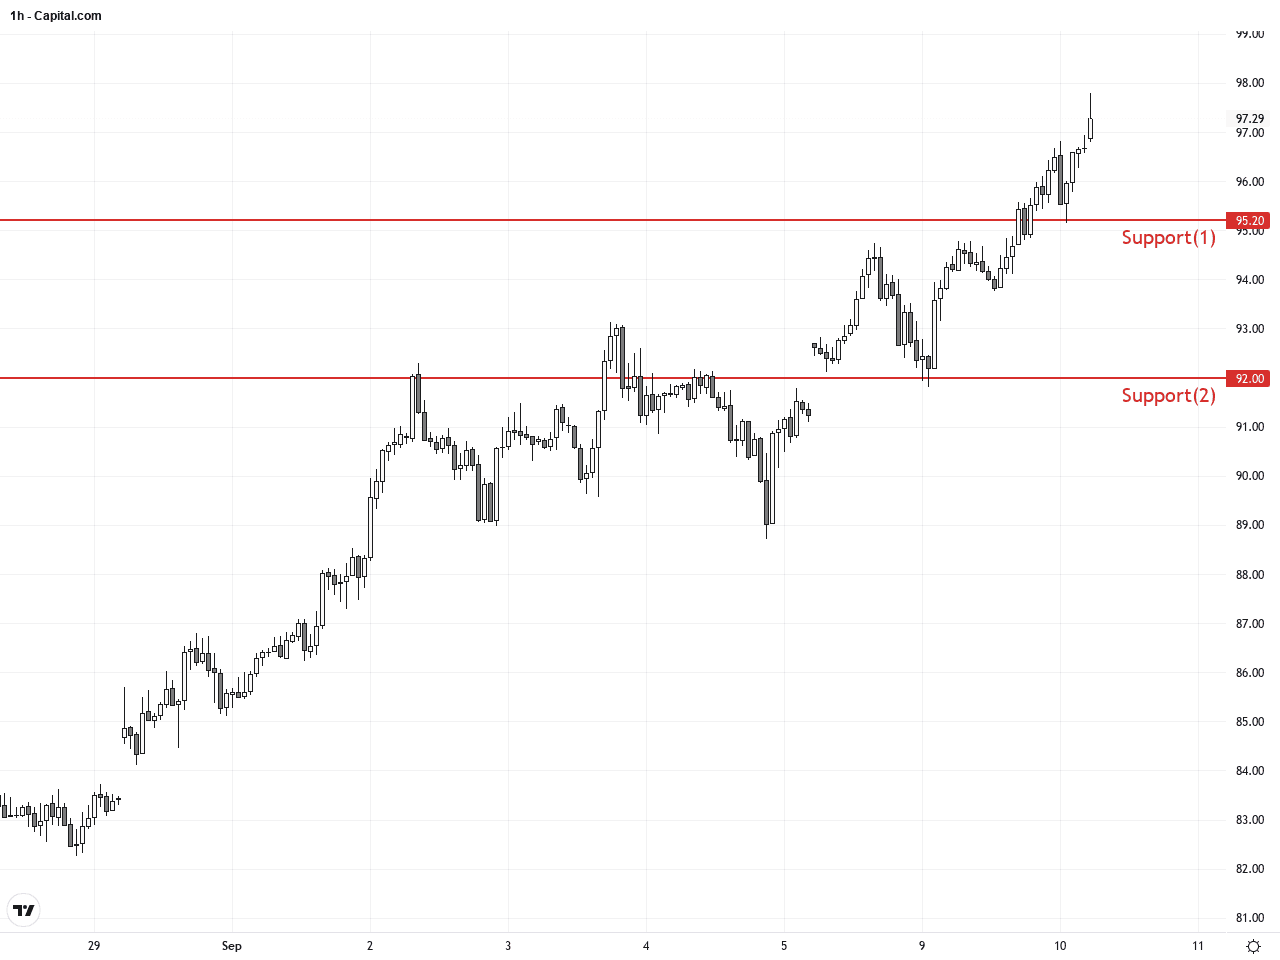
Resistance & Support
Run Live WTI Crude Oil Analysis
The above financial market data, quotes, charts, statistics, exchange rates, news, research, analysis, buy or sell ratings, financial education, and other information are for reference only. Before making any trades based on this information, you should consult independent professional advice to verify pricing data or obtain more detailed market information. 1uptick.com should not be regarded as soliciting any subscriber or visitor to execute any trade. You are solely responsible for all of your own trading decisions.