









 |
| Gold V.1.3.1 signal Telegram Channel (English) |
XAUUSD Gold Price Rebounds with Bond Buybacks in Focus: Key Support Levels Technical Analysis, September 10, 2026
2026-09-10 @ 05:04
Over the past 24 to 48 hours, gold (XAUUSD) displayed notable price volatility, rising from the September 8 close of $4355.71 to $4400.19 on September 9, an increase of roughly 1%. This rebound was mainly driven by market focus on bond buyback programs, which supported gold’s safe-haven demand. Additionally, a yen-led weakness in the US dollar attracted overseas buyers, further boosting gold prices. Recently, stronger-than-expected US payrolls data pressured gold, but investors remain closely watching upcoming Producer Price Index (PPI) and Consumer Price Index (CPI) readings, which could significantly influence the Federal Reserve’s monetary policy.
Put simply for the average investor: when the dollar weakens and market worries about inflation and economic outlook persist, gold, as a traditional safe haven, naturally becomes a favored refuge. Furthermore, bond buyback plans injecting liquidity have unexpectedly boosted gold demand, similar to more participants believing in gold’s value preservation and returning to the market.
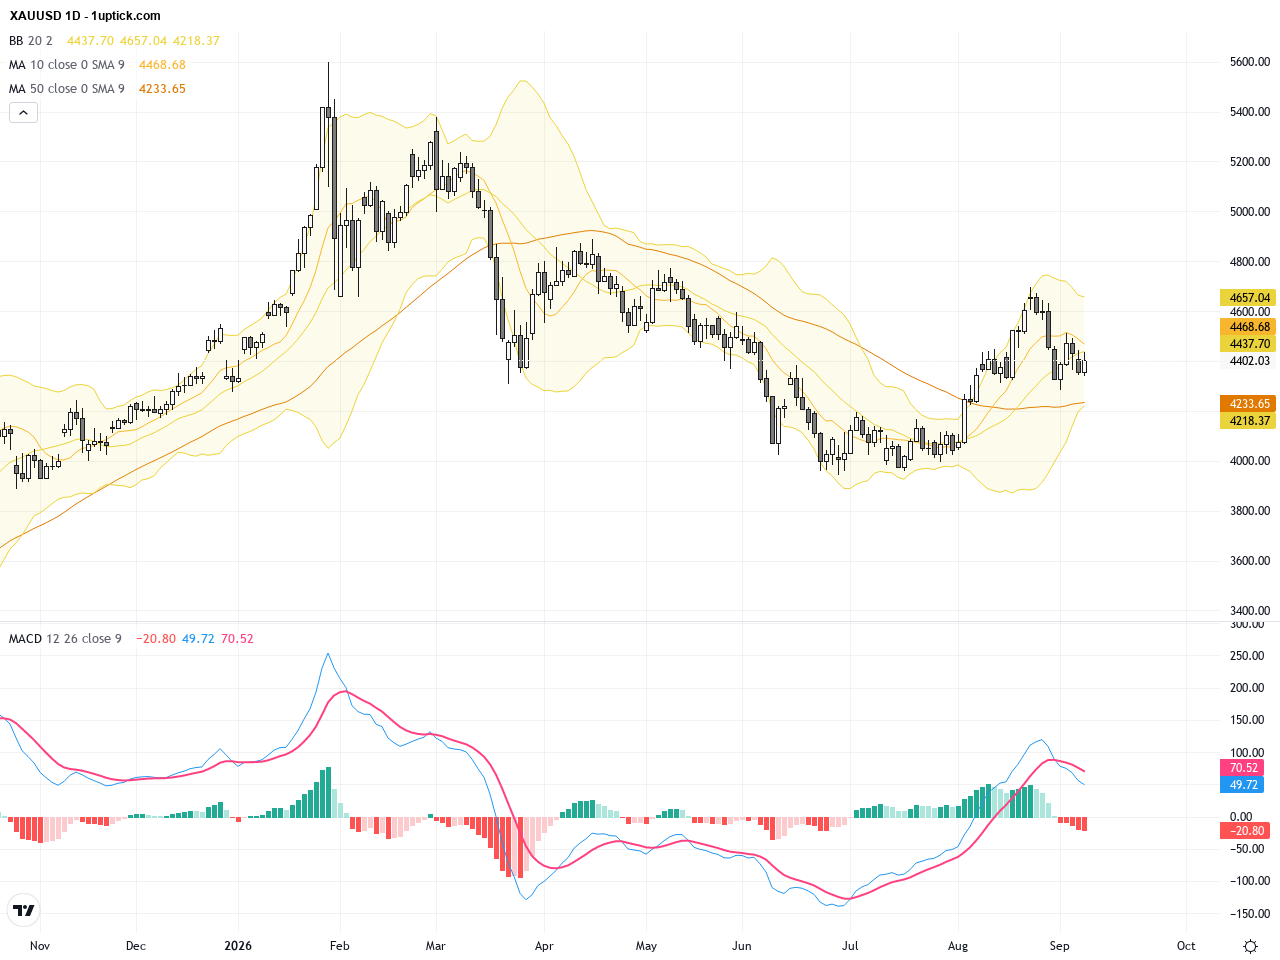
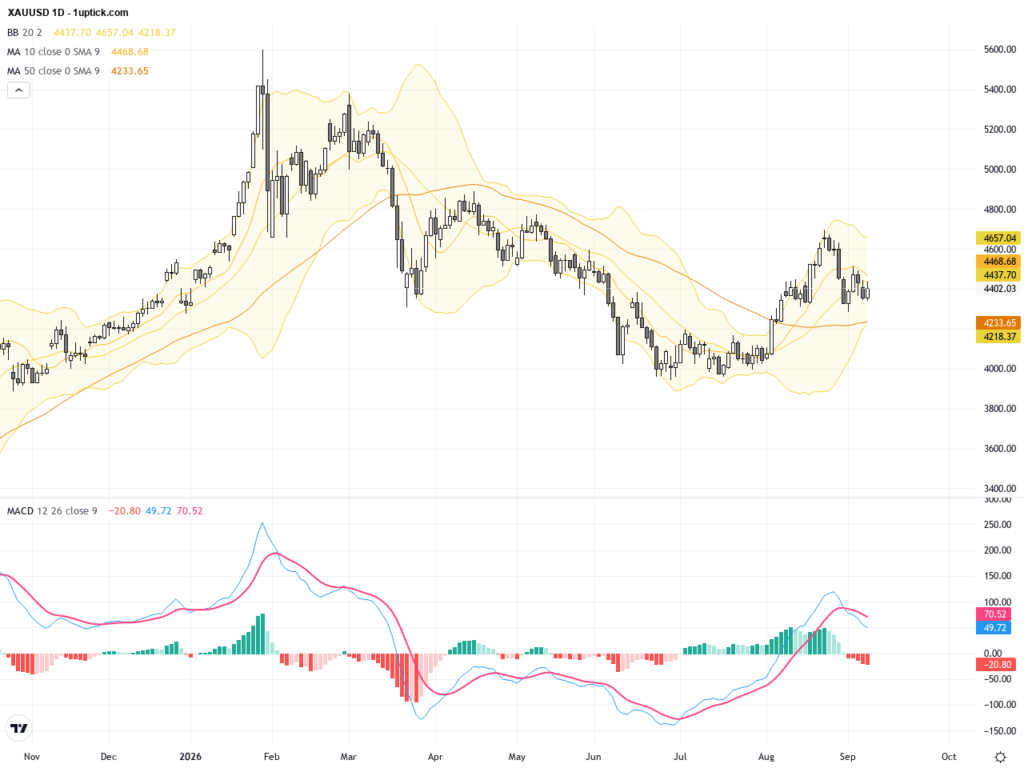
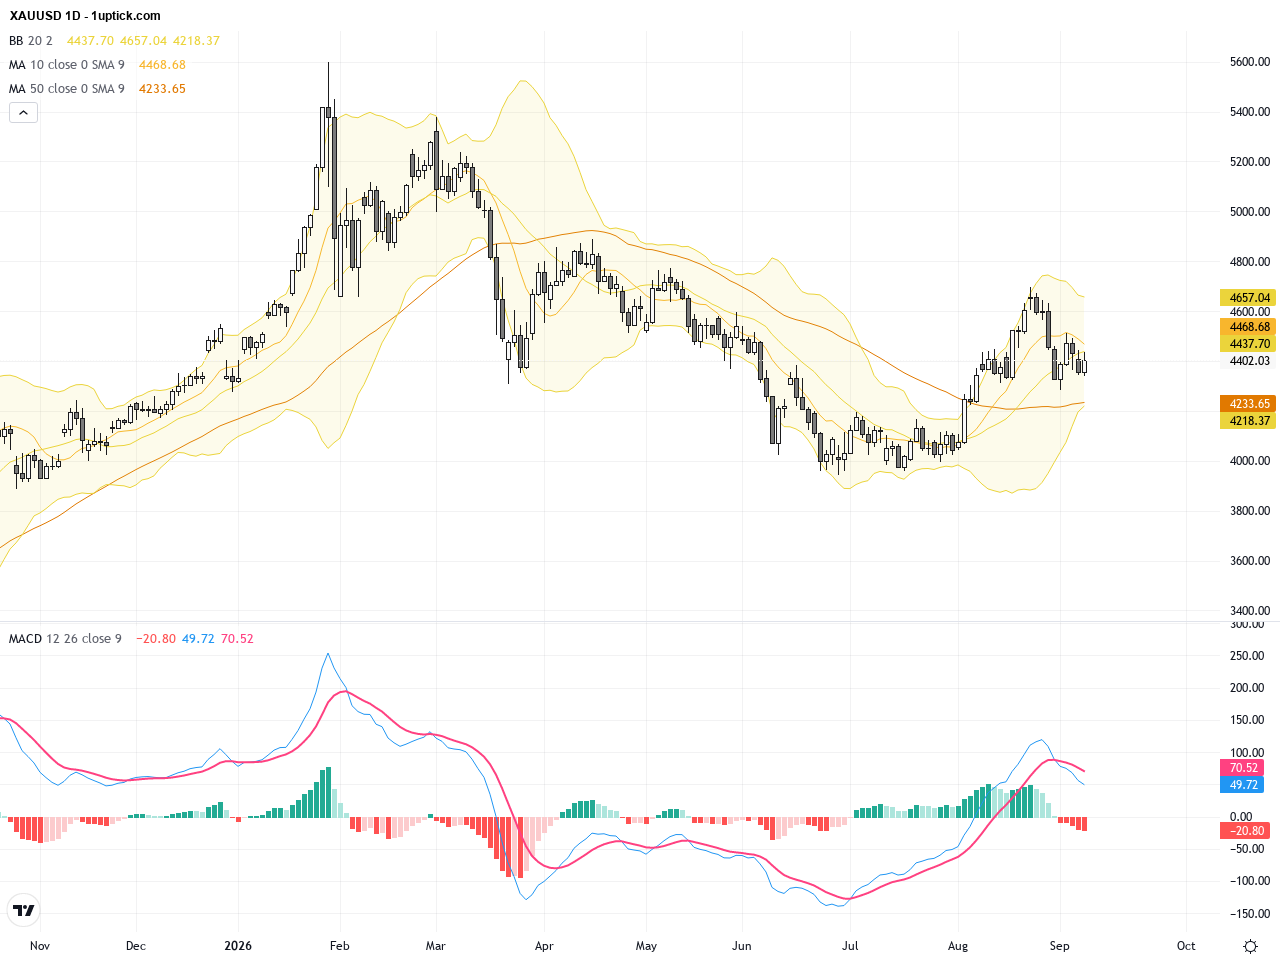
The daily chart of XAUUSD reveals a clear volatile movement with an initial decline from near 4600 down towards a consolidation between 4300-4400. Recently, price has broken above the interim resistance at 4400, signaling a potential recovery. The 20-day and 50-day moving averages are converging into a bullish crossover, indicating strengthened upward momentum. Bollinger Bands depict a phase of tightening followed by expansion, highlighting increasing volatility. The MACD indicator’s bullish crossover further supports a medium-term bullish setup.
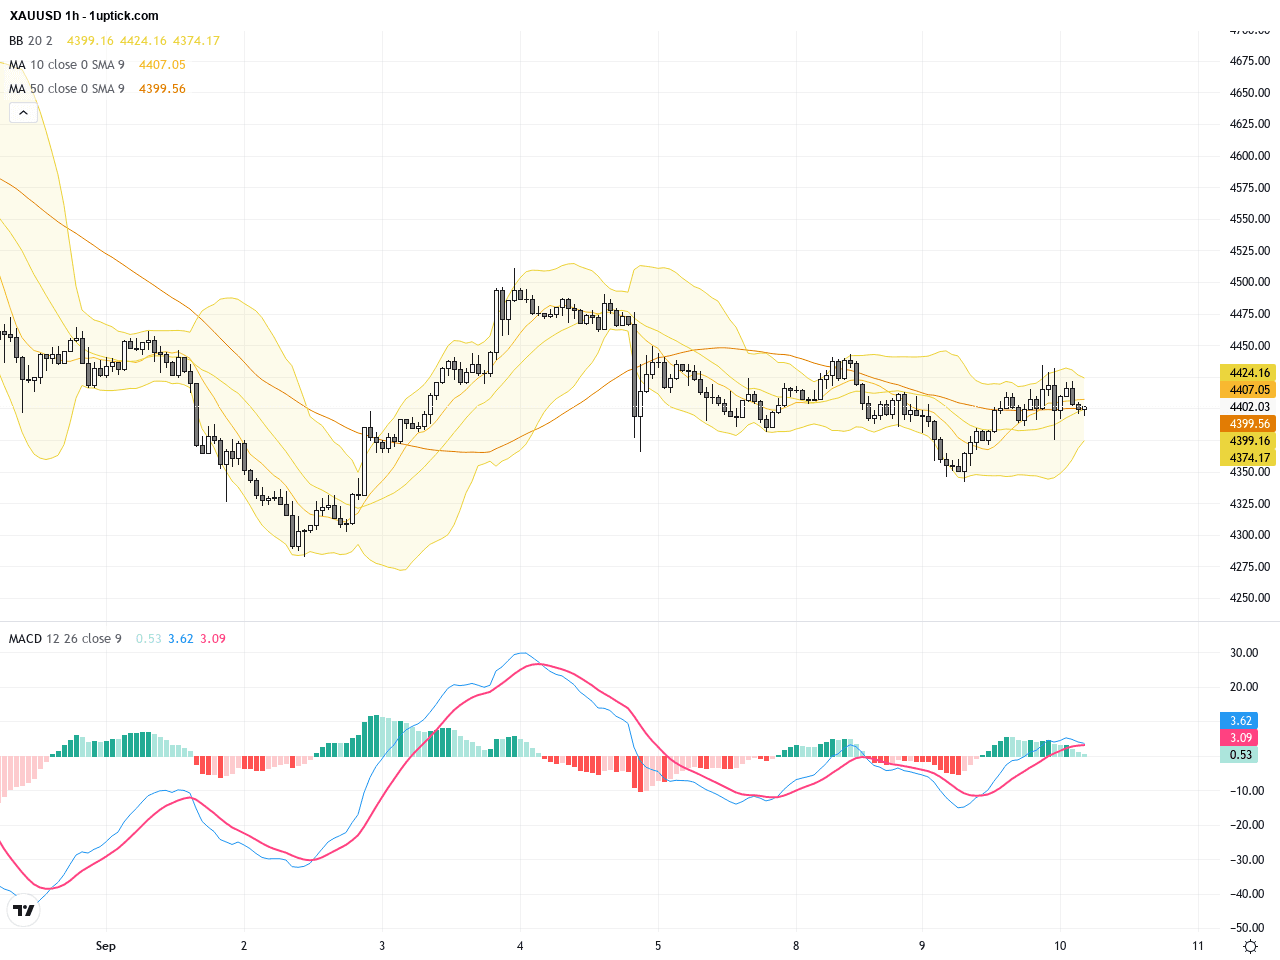
The hourly chart over the past 3-5 days shows XAUUSD rebounding from around 4350 to above 4410, hovering near the middle Bollinger Band, which suggests stabilized short-term momentum. The area around the 50-period moving average is acting as strong support. The MACD line remains above its signal line with increasing histogram bars, pointing to sustained bullish momentum. Price is poised to test resistance near 4420-4430; a successful break here could trigger a new upward leg.
Technical Trend: Trend Direction: Decisively Bullish
Technically, XAUUSD is forming a confirmed bottoming triangle consolidation pattern. The daily MACD bullish crossover aligns with the expanding Bollinger Bands, signaling an accumulation of bullish energy. A recent long lower shadow hammer candlestick indicates strong buying interest at support levels. Volume trends reinforce price movement, suggesting potential imminent breakout above resistance boundaries. Traders should watch for break and retests of key resistance levels to capitalize on high-probability entry points.Today’s economic calendar in GMT+1 features China’s Consumer Price Index (CPI) and Producer Price Index (PPI) releases at 03:30. CPI came in at 0.8% year-over-year, aligned with forecasts, while PPI slightly exceeded expectations at 3.8%. These data points may have an indirect impact on XAUUSD by influencing USD strength and global inflation expectations during Asian and European sessions. No major U.S. monetary policy events are scheduled today, suggesting gold’s price action will likely continue to react to inflation signals and broader macroeconomic cues from China and Europe.
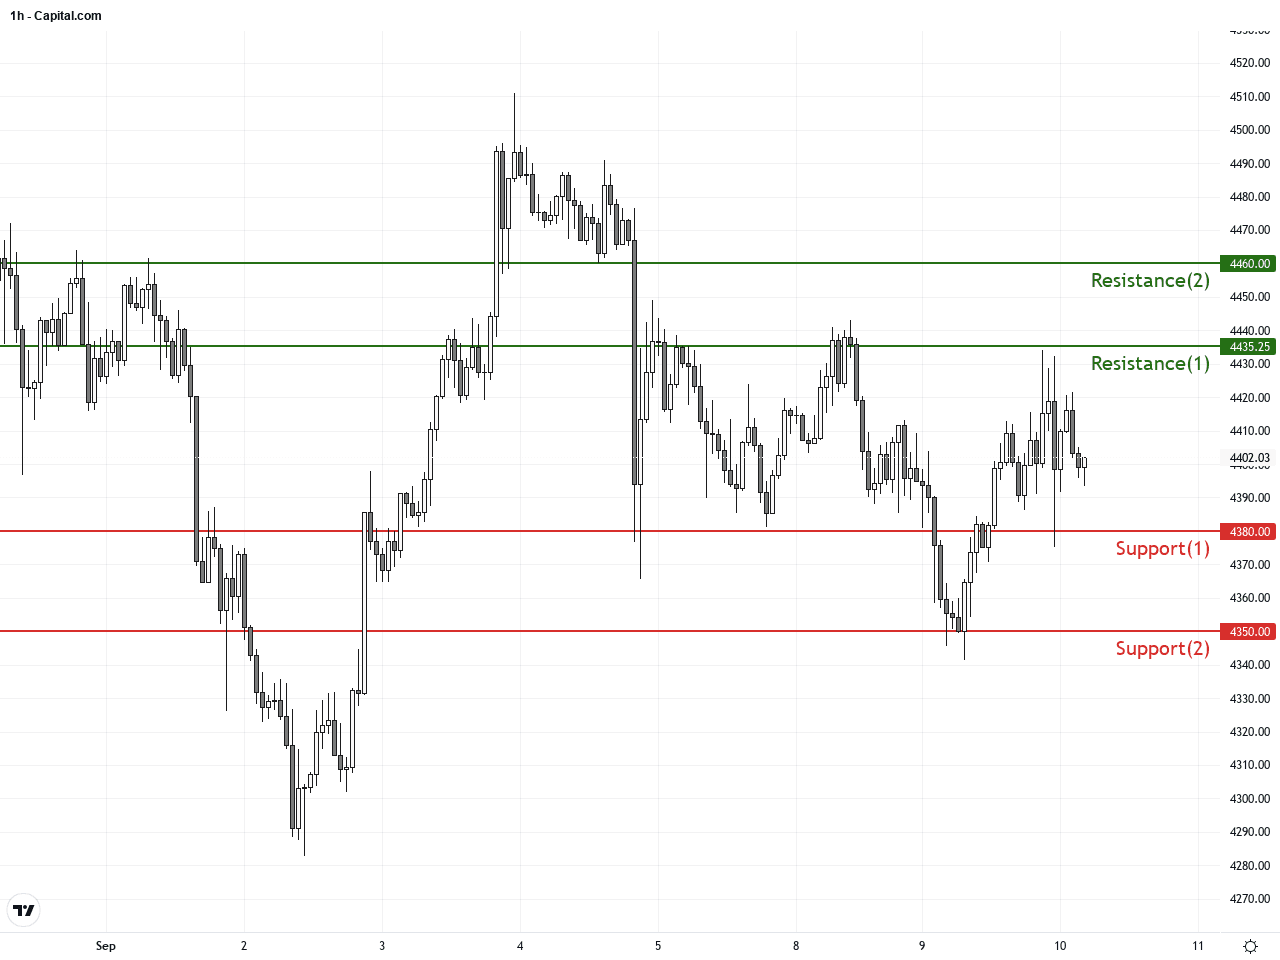
Resistance & Support
The above financial market data, quotes, charts, statistics, exchange rates, news, research, analysis, buy or sell ratings, financial education, and other information are for reference only. Before making any trades based on this information, you should consult independent professional advice to verify pricing data or obtain more detailed market information. 1uptick.com should not be regarded as soliciting any subscriber or visitor to execute any trade. You are solely responsible for all of your own trading decisions.