


 |
| Gold V.1.3.1 signal Telegram Channel (English) |
XAUUSD Technical Breakout and Fundamental Insights: Gold Rebounds Fueling Trading Outlook, September 15, 2026
2026-09-15 @ 05:04
Over the past 24 to 48 hours, the gold market (XAUUSD) experienced notable volatility. Recent data shows gold closed yesterday at $4296.94, down from a session high of $4355.41. This volatility was primarily driven by the 10-year US Treasury yield’s attempt to break above 5.00%, which lost momentum and then pulled back, serving as a key factor behind gold’s rebound.
Among the recent market developments, a notable highlight is gold’s recovery from session lows as Treasury yields declined, reigniting safe-haven demand. Meanwhile, market reactions to the likelihood of Fed rate hikes exerted short-lived pressure on gold, pushing prices lower early in the session. However, as concerns over rising interest rates eased, gold prices stabilized.
In simple terms, recent gold price movements reflect investor sentiment swings between US interest rate policy changes and broader global economic uncertainties. When bond yields rise, gold’s appeal decreases; conversely, when yields pull back, demand for gold as a safe-haven asset rises. For average investors, this means that gold prices could continue to fluctuate in the near term based on interest rate cues, highlighting the importance of closely monitoring macroeconomic indicators when making investment decisions.
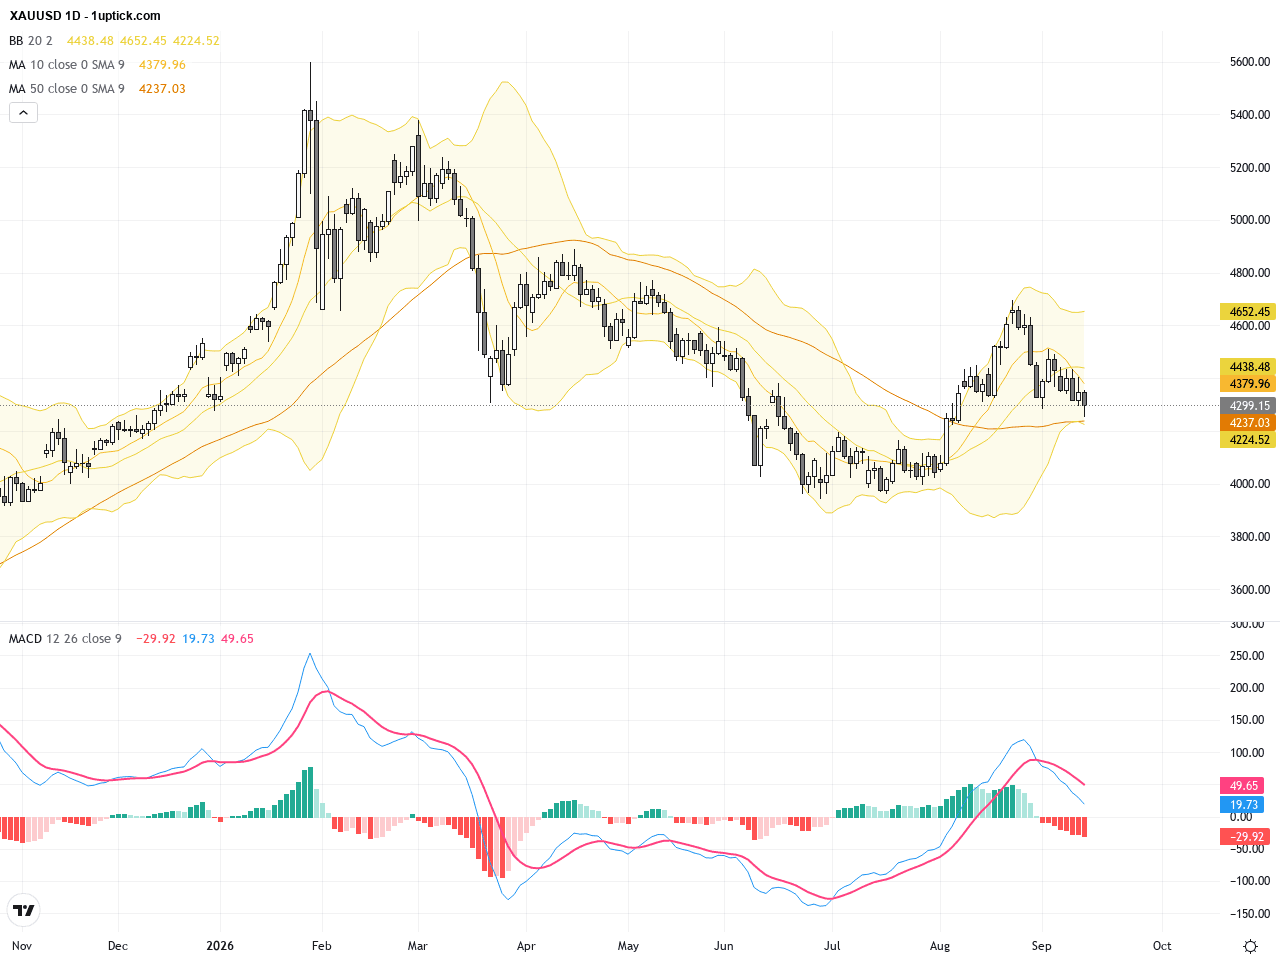
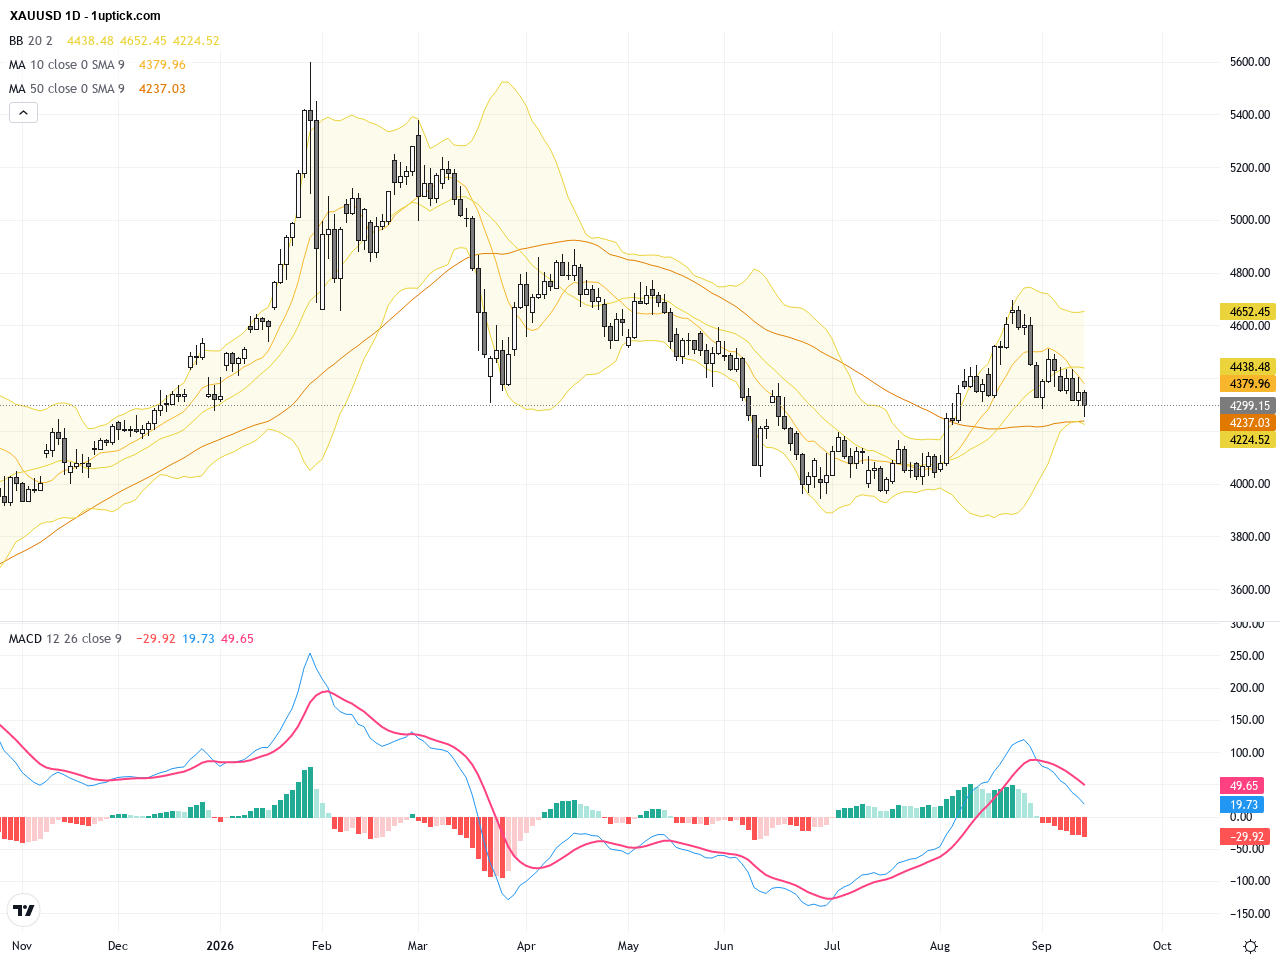
The daily chart illustrates a downtrend in XAUUSD since late August from highs near $4650, with a clear phase of corrective decline. The latest close at $4296.94 positions price near long-term descending channel support and the Bollinger Bands are contracting, signaling reduced volatility. The MACD remains in negative territory, and the shorter-term moving averages have crossed below longer-term ones, confirming bearish momentum. However, recent attempts at recovery indicate buying interest emerging near strong support zones around $4140-$4200. Stability at these levels could set the stage for a technical rebound.
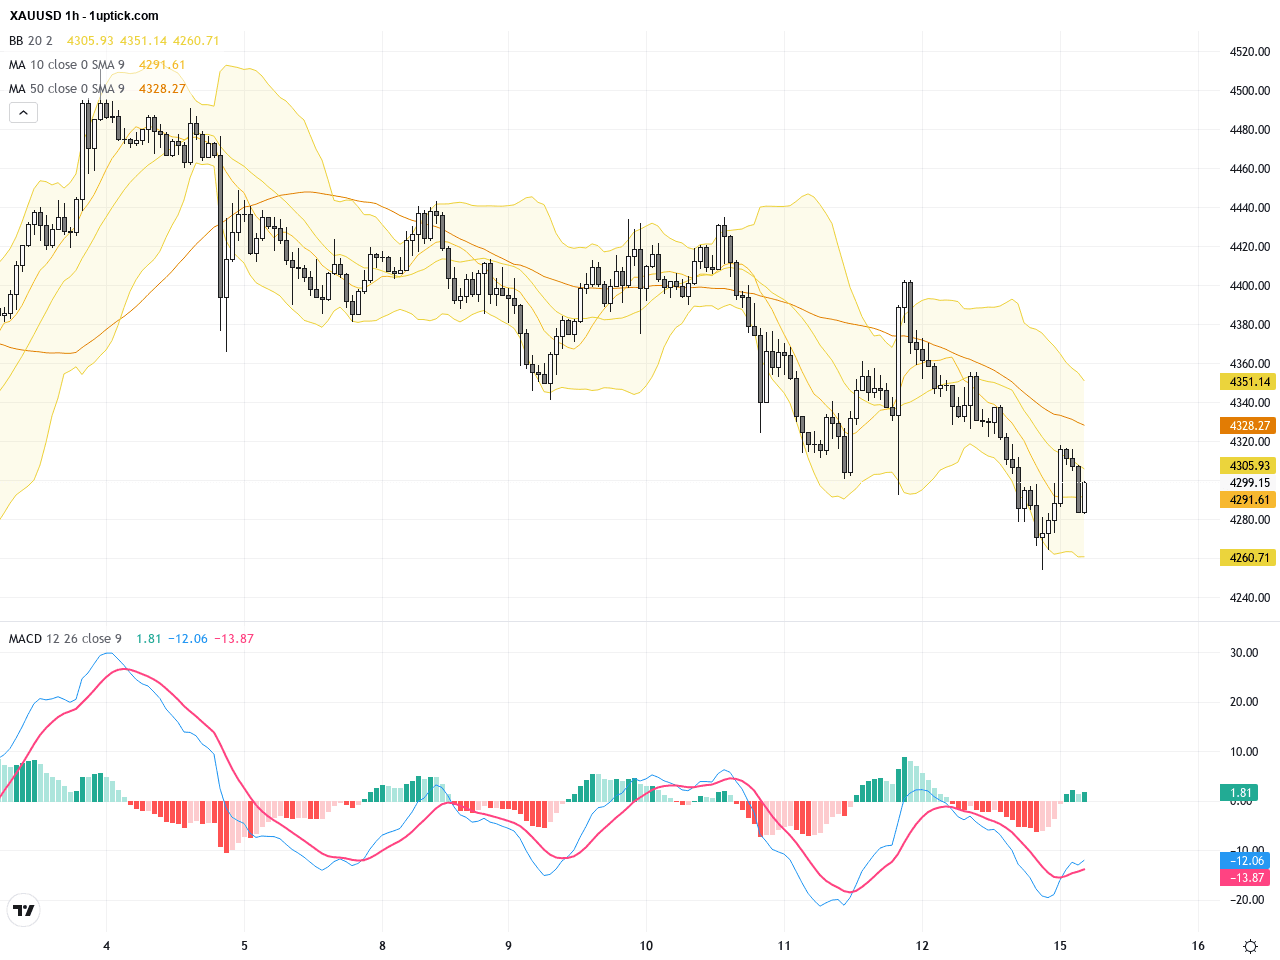
On the hourly chart, price movements over the past 3-5 days range between $4260 and $4335, with the latest prices edging above $4300. The Bollinger Bands suggest several rejections from the lower band followed by price rebounds, while short-term moving averages have been oscillating in consolidation mode. A MACD bullish crossover recently occurred, supporting short-term upward momentum, yet volume remains subdued, implying limited strength for the rebound. Formation of a potential ascending triangle is observed; a breakout above $4335 resistance could ignite a fresh bullish wave.
Technical Trend: Current trend is cautiously consolidative with emerging rebound signals.
Technically, XAUUSD is displaying signs of a potential bottoming process, with the MACD on the daily chart narrowing its negative momentum and an ascending triangle pattern emerging on hourly intervals. The recent candlestick engulfing pattern signals a short-term reversal or corrective upswing. Combined with easing Treasury yields and persistent Fed rate hike concerns, gold is expected to trade within a range with periodic bullish surprises in the near term.Today’s economic calendar shows Japan’s July Industrial Production final reading and China’s August Producer Price Index among events linked to XAUUSD influences. These data points impact gold indirectly through global economic sentiment rather than direct USD-related news. No major US economic data is scheduled today, so near-term gold price action is likely to hinge on Treasury yields and geopolitical developments instead.
Resistance & Support

The above financial market data, quotes, charts, statistics, exchange rates, news, research, analysis, buy or sell ratings, financial education, and other information are for reference only. Before making any trades based on this information, you should consult independent professional advice to verify pricing data or obtain more detailed market information. 1uptick.com should not be regarded as soliciting any subscriber or visitor to execute any trade. You are solely responsible for all of your own trading decisions.