


 |
| Gold V.1.3.1 signal Telegram Channel (English) |
WTI Crude Oil Technical & Fundamental Analysis: Middle East Tensions Support Short-Term Rebound
2025-12-30 @ 08:01
Over the past 24 to 48 hours, the WTI crude oil market experienced noticeable volatility, with prices fluctuating slightly around yesterday’s close of $57.79. The market was driven higher by escalating geopolitical tensions in Yemen and stalled Ukraine peace talks, pushing WTI prices up by over 2.5%. These geopolitical factors heightened concerns over potential supply disruptions, supporting crude oil prices.
Simultaneously, the market remains cautious due to looming risks of global supply surplus. Although there are hopeful signs of demand recovery in Asia for natural gas and oil, the surplus supply outlook is limiting further price gains. This is also reflected in the continuous reduction of net speculative long positions in crude oil futures, signaling ongoing doubts about supply tightness.
For the average investor, recent oil price moves illustrate how international geopolitical uncertainties directly influence energy markets. When conflicts remain unresolved, supply risks keep prices well supported. However, persistent global oversupply concerns could cap the upside potential. Investors should stay attentive to these developments and manage their exposure accordingly.

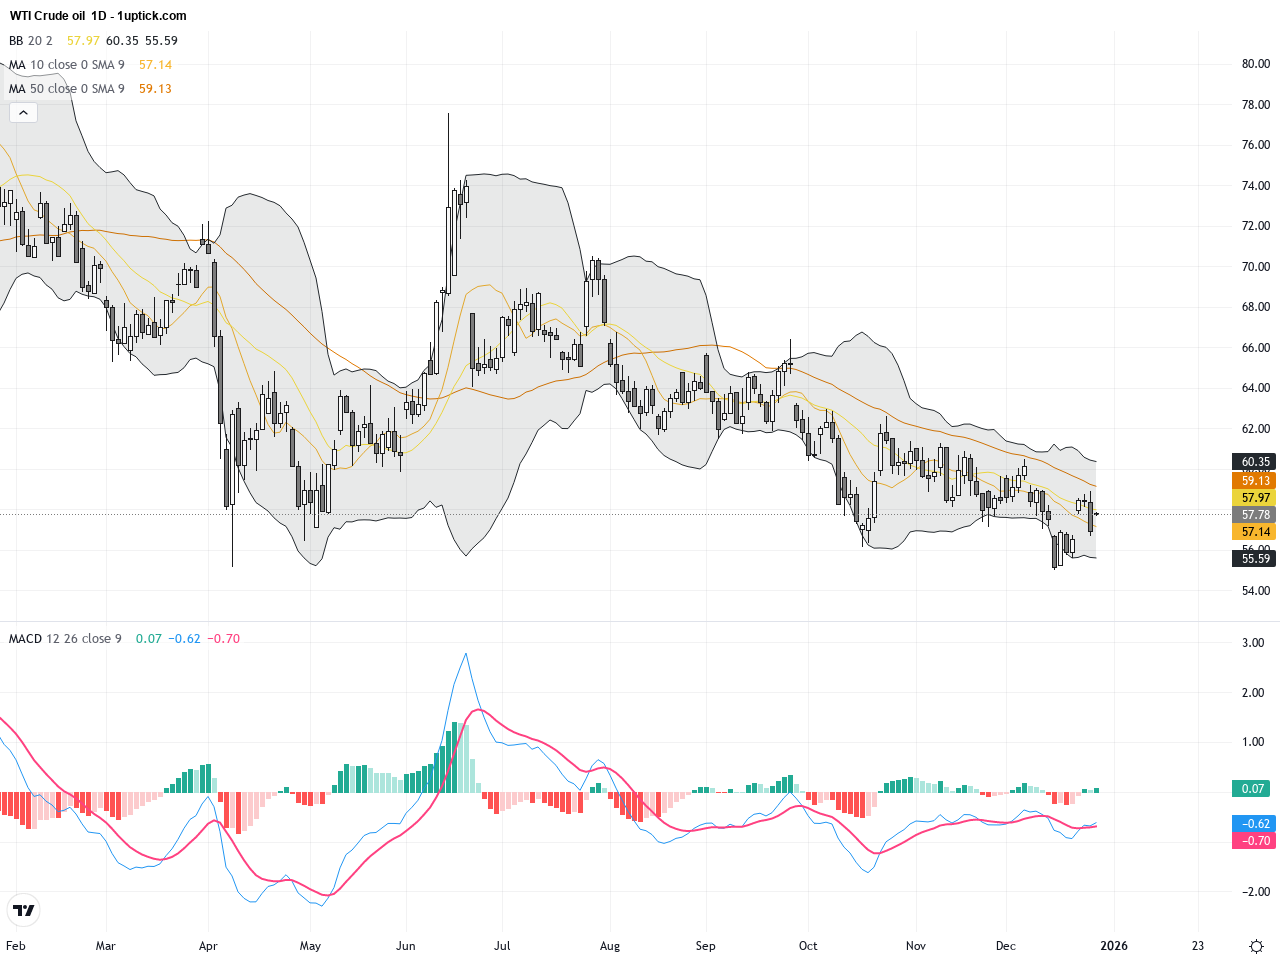
The WTI daily chart reveals a consolidating price range around the $58 mark since mid-December. Key long-term support is holding firm, and the 50-day and 200-day moving averages are converging, suggesting a potential golden cross formation. Bollinger Bands have tightened, indicating reduced volatility but the possibility of a breakout. The MACD is oscillating near the zero line with a slight bullish divergence, reflecting a slowly recovering upward momentum. Overall, the trend is a sideways consolidation with upward biases.
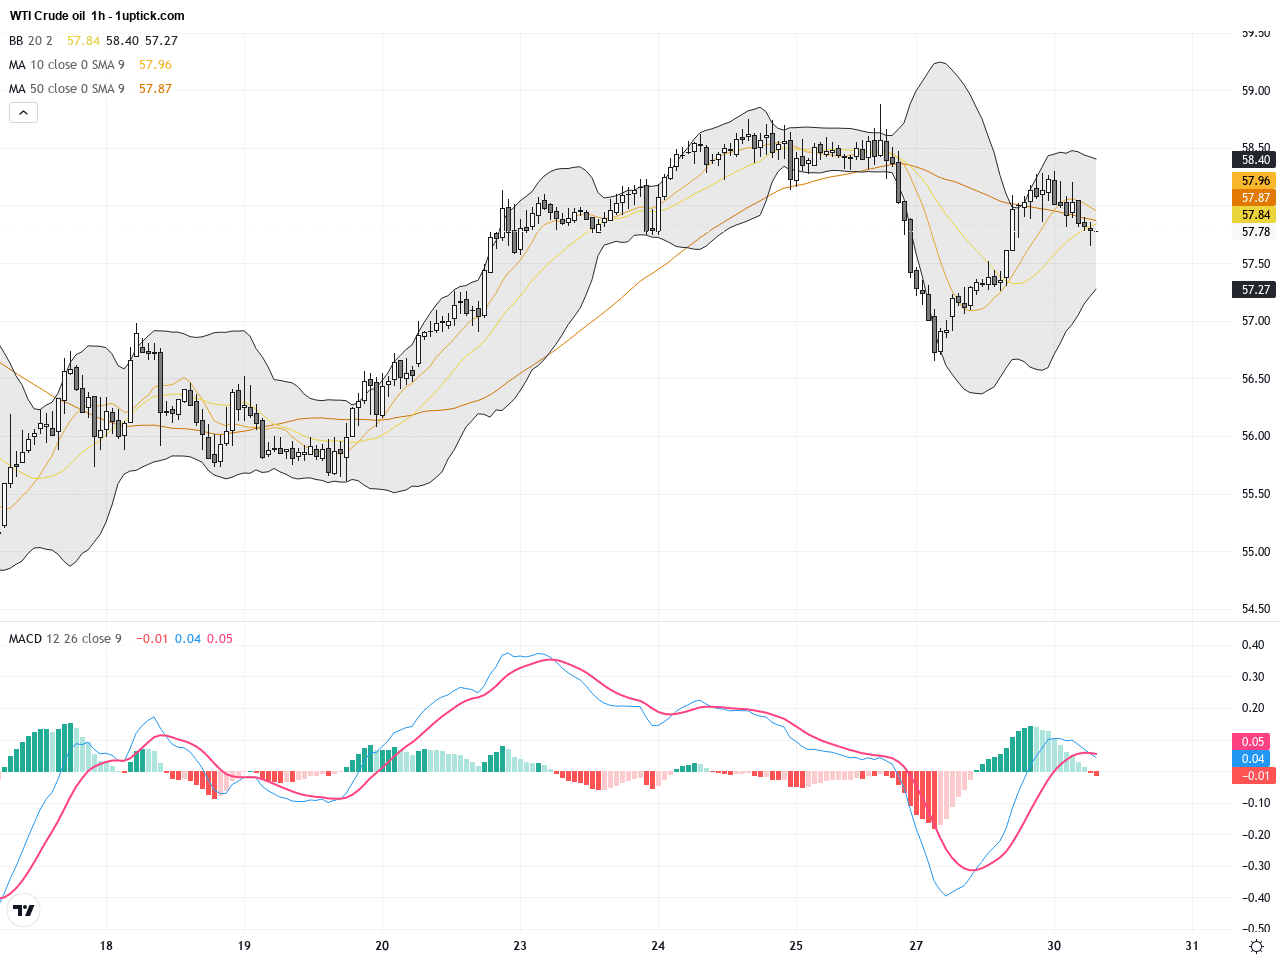
The past five days on the WTI hourly chart show a gradual upward move from the $56 floor towards recent highs near $58.29, depicting a minor bullish rally. The 50-hour moving average provides solid support as price remains above Bollinger Band midline. Momentum indicators like MACD have formed a bullish crossover, and RSI hovers near 55, indicating moderate momentum. The most notable recent candlestick pattern is the bullish engulfing on December 29, hinting at a likely continuation of gains in the next 24 hours.
Technical Trend: The current trend for WTI Crude Oil is assessed as ‘Cautiously Bullish’ with possibilities to break above resistance, though supply-side uncertainties still present downside risks.
Technical insights highlight that WTI is oscillating within a consolidation zone on the daily timeframe but showing signs of bullish recovery. The hourly golden cross and bullish engulfing pattern point to a potential near-term rebound. However, bearish supply concerns remain a threat if geopolitical tensions ease. Watching MACD crossovers and Bollinger Band expansion will be key to spotting high-probability trading opportunities.There are no major economic events today expected to directly impact WTI Crude Oil prices. Current market moves continue to be driven primarily by geopolitical developments and supply-demand fundamentals. Traders should monitor upcoming U.S. inventory reports and Middle East geopolitical updates for further directional cues.
Resistance & Support

The above financial market data, quotes, charts, statistics, exchange rates, news, research, analysis, buy or sell ratings, financial education, and other information are for reference only. Before making any trades based on this information, you should consult independent professional advice to verify pricing data or obtain more detailed market information. 1uptick.com should not be regarded as soliciting any subscriber or visitor to execute any trade. You are solely responsible for all of your own trading decisions.