


 |
| Gold V.1.3.1 signal Telegram Channel (English) |

USDJPY: Triangle Consolidation Near Key Resistance Ahead of Central Bank Decisions
2026-04-27 @ 11:01
Over the past 24 to 48 hours, the USD/JPY pair traded within a narrow range between 159.25 and 159.63, closing yesterday at 159.33, reflecting muted volatility. The market adopted a wait-and-see stance as investors held back ahead of upcoming interest rate decisions from the Bank of Japan (BoJ) and the Federal Reserve (Fed). Rising energy prices triggered by Middle East tensions have intensified inflationary pressures, placing synchronized monetary policy moves on the world’s major central banks.
Recent news reveals investors are awaiting clarity on the stances from both central banks, particularly whether the BoJ will maintain its dovish stance amid rising inflation. The Fed is widely expected to hold rates steady but faces inflation challenges due to surging oil prices. Meanwhile, the Japanese yen has weakened due to uncertainty over BoJ policies, causing the USD/JPY to edge higher, reflecting a mix of risk sentiment and monetary policy expectations.
For the average investor, this means USD/JPY is currently in a stable yet sensitive phase, driven by central bank policy outlook and geopolitical risks. Near term, the key to gauging market direction lies in the rate decisions; any unexpected shifts could trigger sharp currency moves. Investors should remain cautious and monitor developments closely while positioning accordingly.

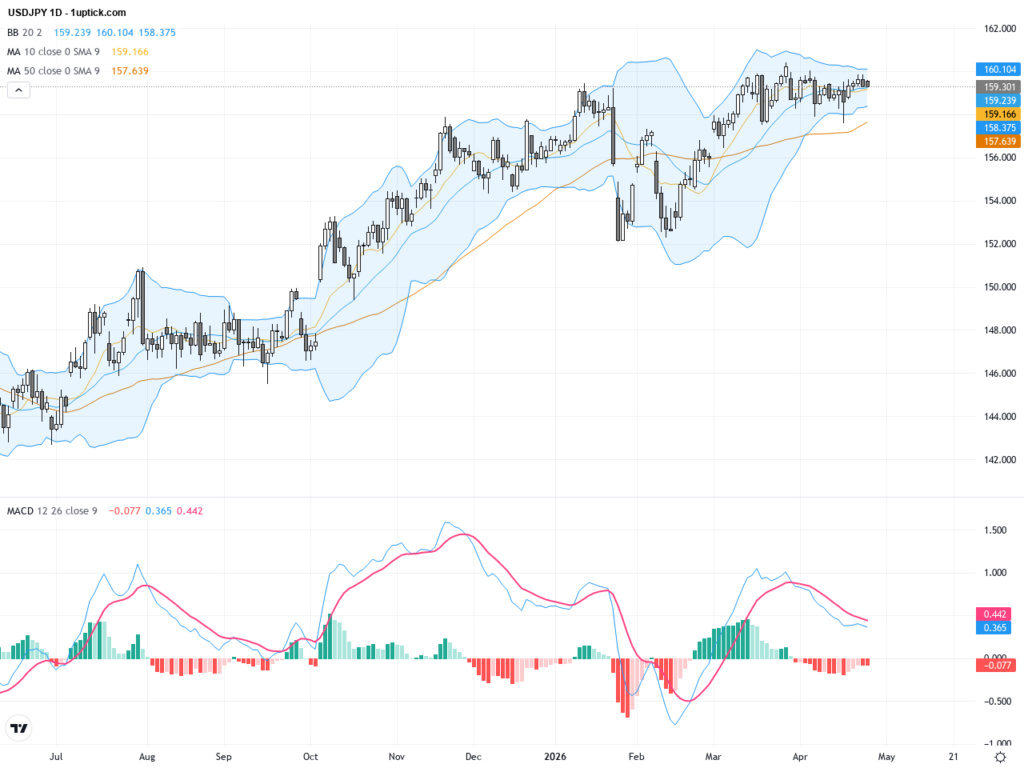
The daily chart shows USDJPY in a sustained uptrend since early in the year, with price consolidating between 158 and 160 recently. The 50-day moving average remains above the 200-day, confirming bullish bias. Bollinger Bands are contracting, indicating decreased volatility, while MACD histogram nears the zero line, suggesting momentum is stabilizing and poised to pick up. The triangular consolidation pattern signals an imminent breakout is likely to define the next directional move.
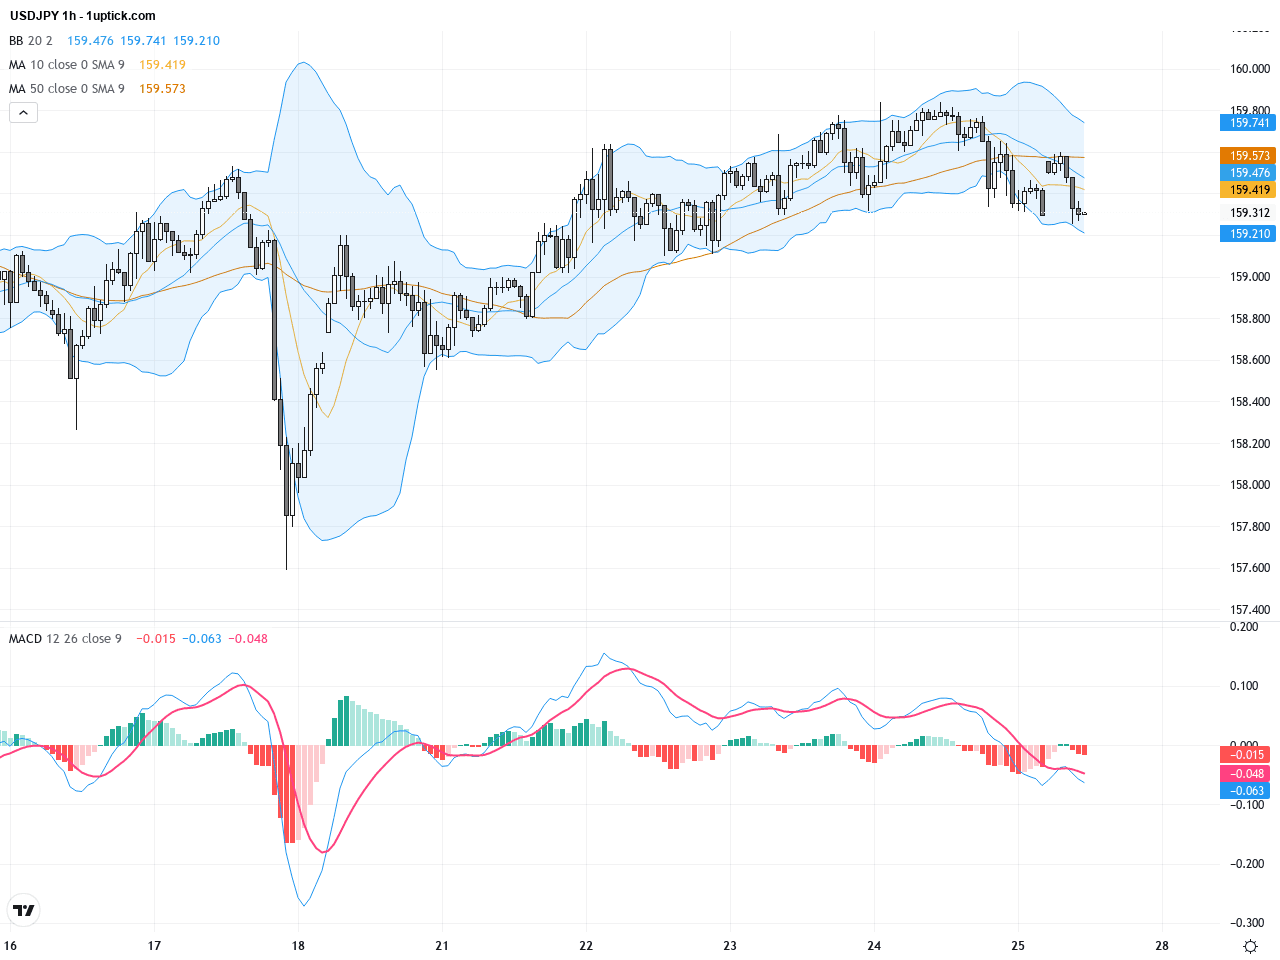
Analysis of the last 3-5 days on the hourly chart reveals price oscillating between 159 and 160.5, with moving averages coalescing near 159.5 acting as short-term support. The MACD recently formed a bullish crossover, indicating upward momentum may build shortly. The Bollinger Bands’ narrowing reflects a market awaiting catalyst, and the triangular formation anticipates a near-term breakout. Traders should watch for volume and volatility expansion to confirm directional bias.
Technical Trend: Cautiously bullish consolidation awaiting breakout
Technically, USDJPY’s price remains in a key triangular consolidation stage, signaling anticipation of a breakout. The daily chart’s bullish moving average alignment, combined with the hourly chart’s MACD bullish cross, suggests improved upside potential in the near term. No recent strong candlestick reversal patterns have emerged, indicating the tug-of-war between bulls and bears continues. Traders should stay alert to central bank announcements as crucial catalysts that could trigger higher volume and directional breakout.Today’s GMT+1 economic calendar lists Germany’s GfK Consumer Confidence, the UK’s CBI Realized Sales, and the US Dallas Fed Manufacturing Index. None of these have a direct material impact on USDJPY, which is most sensitive to US and Japanese data and policy announcements. Therefore, no significant economic data today will likely sway USDJPY materially, leaving market attention focused squarely on the forthcoming central bank interest rate decisions.
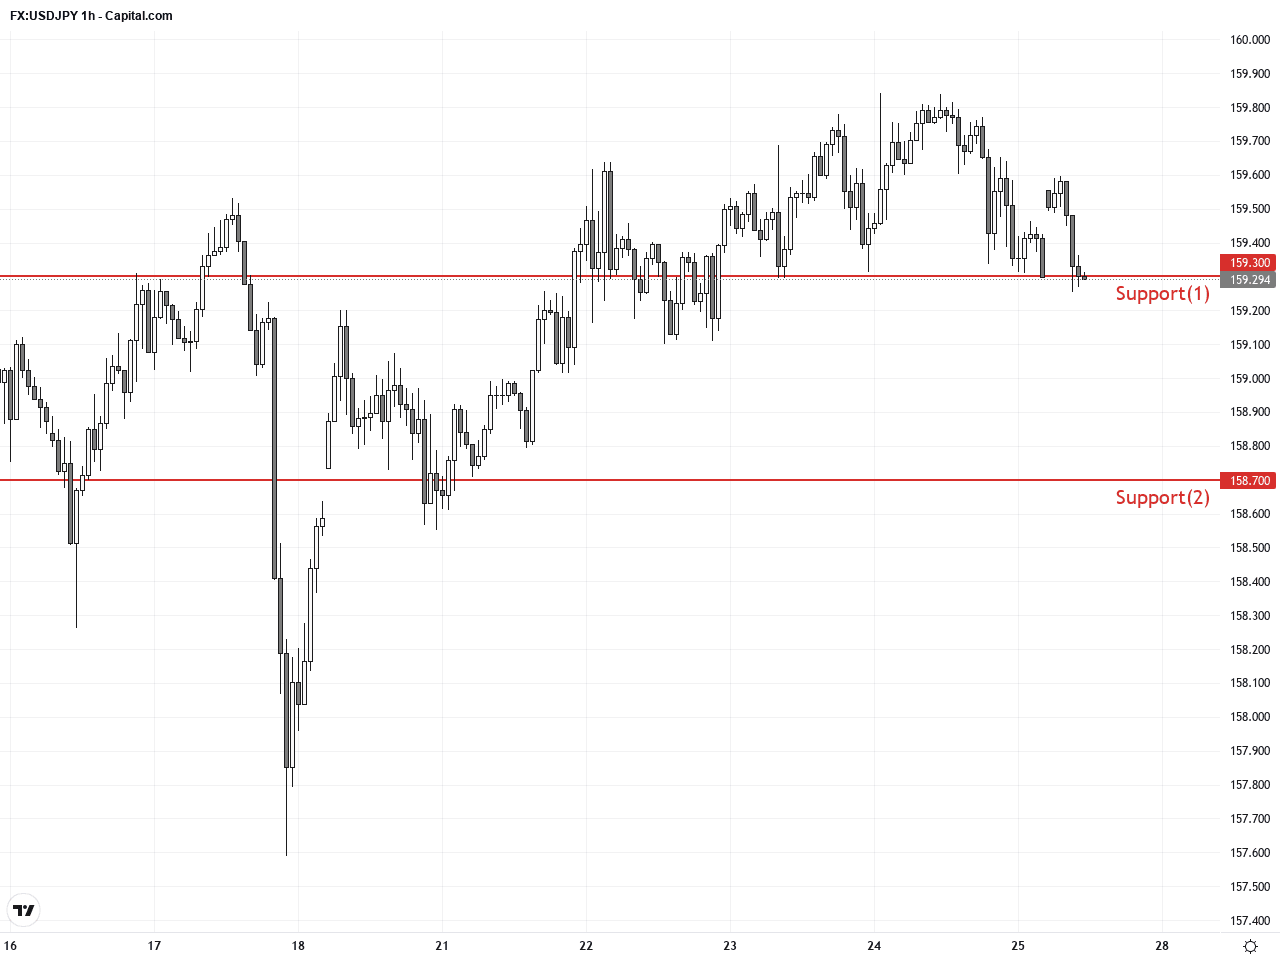
Resistance & Support
The above financial market data, quotes, charts, statistics, exchange rates, news, research, analysis, buy or sell ratings, financial education, and other information are for reference only. Before making any trades based on this information, you should consult independent professional advice to verify pricing data or obtain more detailed market information. 1uptick.com should not be regarded as soliciting any subscriber or visitor to execute any trade. You are solely responsible for all of your own trading decisions.