


 |
| Gold V.1.3.1 signal Telegram Channel (English) |

EURUSD: Holding Above 1.17 with Technical Patterns Hinting at a Rebound Opportunity
2026-04-27 @ 09:01
Over the past 24 to 48 hours, the EUR/USD currency pair experienced notable volatility, fluctuating around yesterday’s close of 1.17162. After touching a low near 1.1665, the pair rebounded, briefly surpassing the 1.1700 level, reflecting subtle shifts in market sentiment.
The latest market news points to several driving factors behind this move. Firstly, the extension of the US-Iran ceasefire eased tensions in the Middle East, reducing safe-haven demand for the US dollar and pushing the Dollar Index (DXY) down to around 98.30. This environment supported a partial recovery in the euro as investors regained some confidence in risk assets.
However, economic data from the Eurozone painted a less optimistic picture. The composite Purchasing Managers’ Index (PMI) dropped from 50.7 in March to 48.6 in April, signaling a potential contraction. The weakness in the services sector alongside gains in manufacturing created a notable divergence, leaving market participants cautious on the euro’s outlook.
For the average investor, this fundamental backdrop translates into a scenario where easing geopolitical risks temporarily weaken the US dollar, allowing the euro to gain slightly; yet underlying economic fragility in the Eurozone limits the euro’s broader strength. This implies ongoing uncertainty, underscoring the importance of a cautious and flexible approach to trading EUR/USD amid a still unsettled market environment.
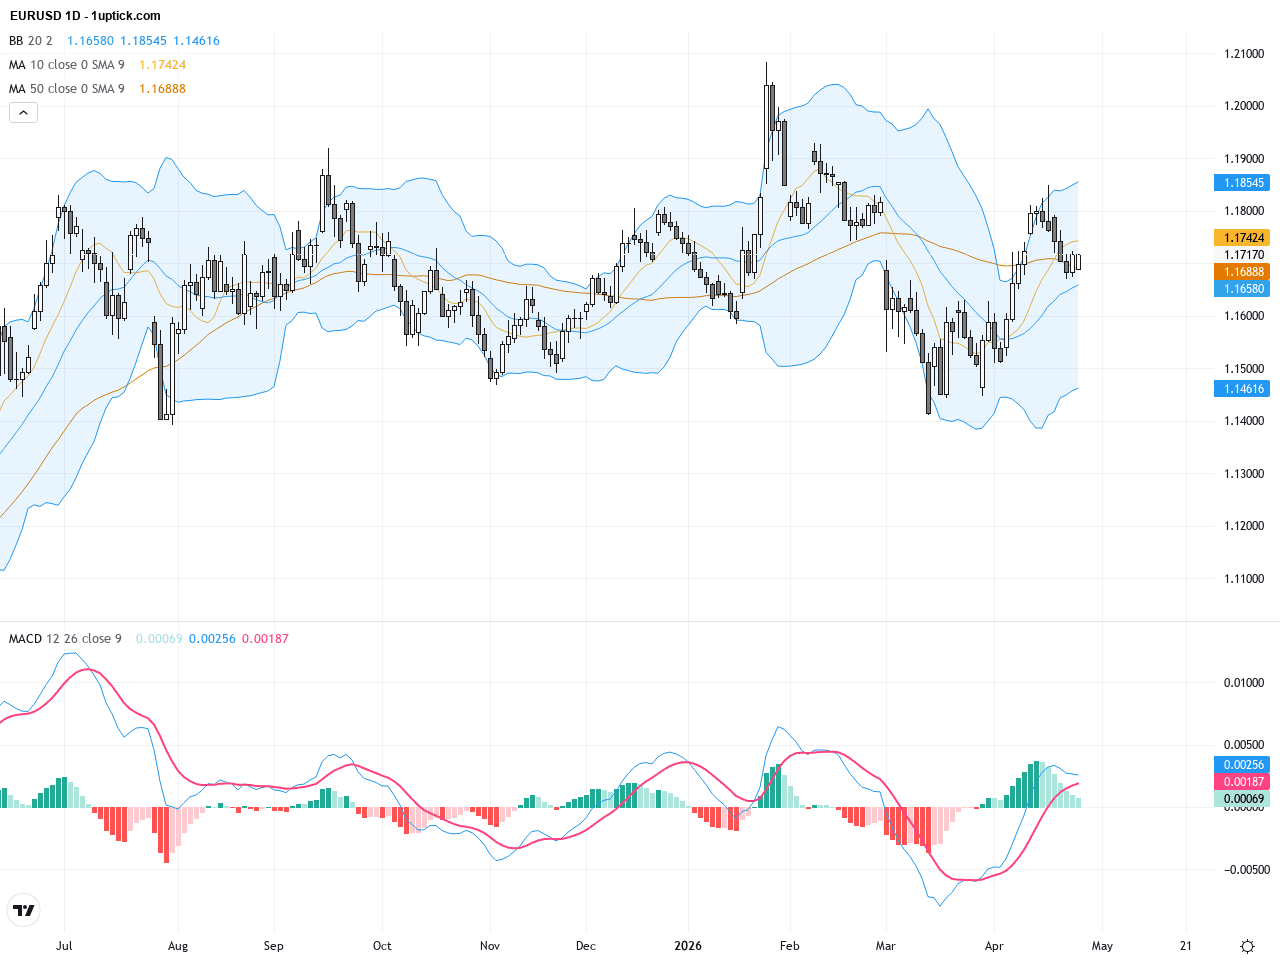
The daily chart of EURUSD shows a roughly 1.5% pullback from recent highs, with prices consolidating between 1.1680 and 1.1720. The pair remains above the 50-day (1.1618) and 200-day (1.16806) moving averages, indicating sustained underlying bullish momentum. Bollinger Bands are contracting, signaling lower volatility but hinting at an imminent breakout. The MACD indicator is near the signal line, suggesting a possible bullish crossover forming soon, which could push prices higher.

The past 3-5 days on the hourly chart reveal a short-term recovery pattern, with EURUSD repeatedly testing support at 1.1700 and bouncing higher with small bullish candles. Bollinger Bands are widening, suggesting increasing volatility ahead. The MACD remains near the zero line, showing balanced momentum; a growing MACD histogram would imply a strong trading opportunity in the near term.
Technical Trend: Trend Direction: Cautiously Bullish Sideways
Key technical signals for EURUSD reveal strong support at 1.17 with daily MACD close to a bullish crossover, offering short-term rebound potential. The hourly chart’s Bollinger Bands expansion suggests stronger volatility, and traders should watch the 1.1730 resistance level for a breakout, which would confirm a bullish bias. No clear head and shoulders or major reversal patterns have formed recently, but multiple support zones reinforce bullish sentiment within a consolidation range.There are no significant or directly relevant economic events scheduled today (GMT+1) that would impact EURUSD. Market participants are likely to continue focusing on technical developments and geopolitical news such as Middle East tensions.
Resistance & Support

The above financial market data, quotes, charts, statistics, exchange rates, news, research, analysis, buy or sell ratings, financial education, and other information are for reference only. Before making any trades based on this information, you should consult independent professional advice to verify pricing data or obtain more detailed market information. 1uptick.com should not be regarded as soliciting any subscriber or visitor to execute any trade. You are solely responsible for all of your own trading decisions.