


 |
| Gold V.1.3.1 signal Telegram Channel (English) |
EURUSD Technical & Fundamental Analysis: Price Rebounds at Key Support Amid Dollar Pressure
2026-01-14 @ 04:51
Over the past 24 to 48 hours, the EUR/USD exchange rate has shown noticeable volatility, fluctuating slightly around yesterday’s close at 1.16494, with an overall pattern of initial decline followed by a rebound. The market experienced a pushback from the US dollar, leading to a temporary weakness in the euro against the dollar, but later stabilized and bounced back under positive demand and technical signals.
Recent market news highlights the US dollar’s reluctance to give up, as it attempts to resist gains in both the euro and pound sterling in the short term. This played a key role in the dollar’s rebound observed yesterday. Meanwhile, with US inflation data stabilizing, the market is cautiously awaiting Fed actions, resulting in a relatively contained movement in the euro, which remains range-bound.
For the average investor, the market movement over this period can be likened to a tug of war — forces between the dollar and euro are back-and-forth, with the dollar actively seeking stability amid ongoing inflation pressures and the euro leveraging favorable conditions to hold its ground. Overall, this led to the EUR/USD pair fluctuating between 1.16 and 1.17. Investors should watch upcoming inflation data and policy updates closely, as they will determine the next directional move between these two currencies.

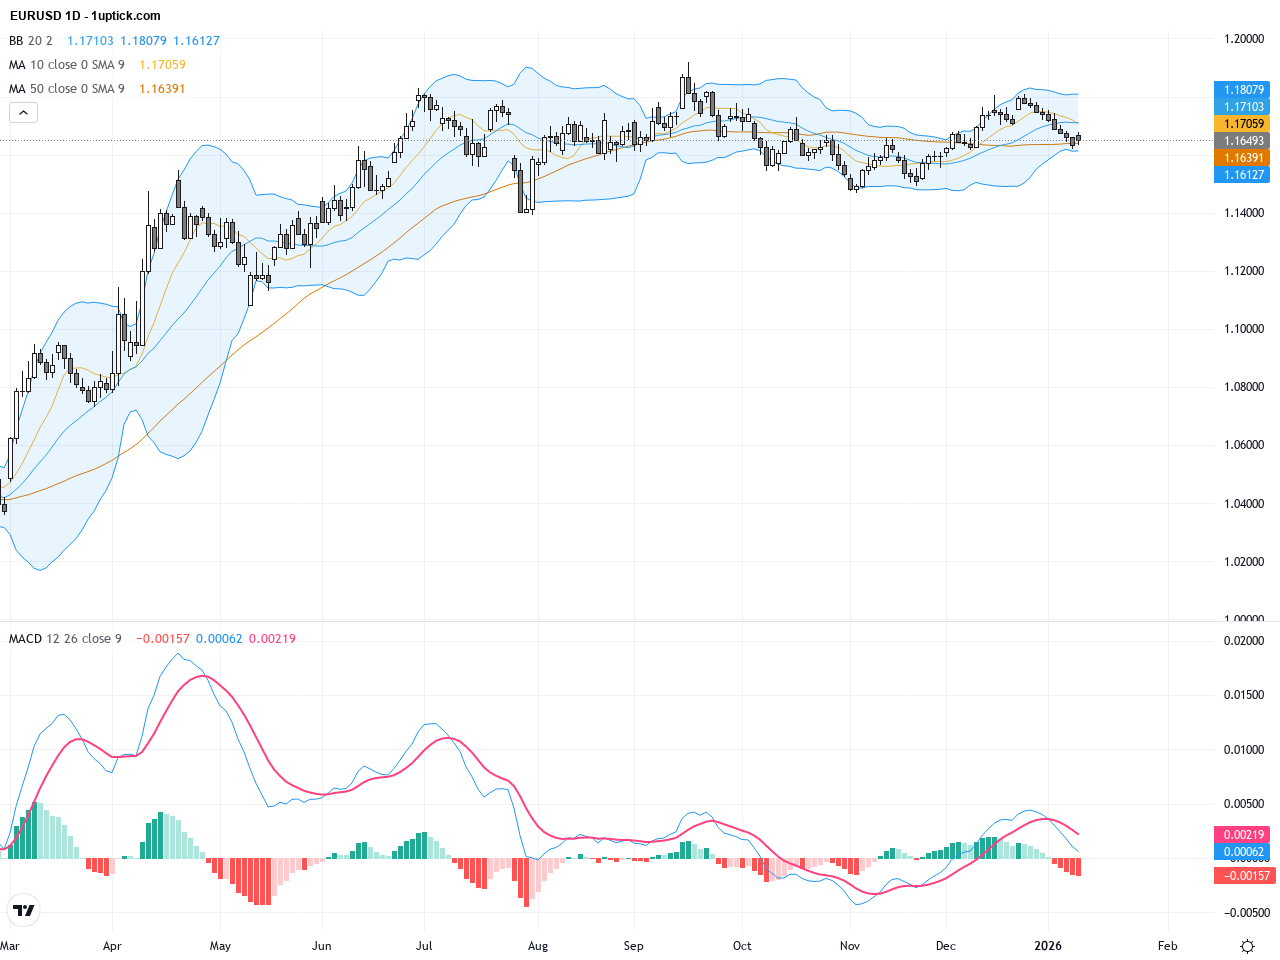
The daily chart shows EURUSD fluctuating between 1.1600 and 1.1700 since the start of the year. The 50-day moving average stands near 1.1671, slightly above current price levels, while the 200-day average at 1.1640 provides strong support. Bollinger Bands are contracting, indicating consolidation, and the MACD histogram, although below zero, shows signs of convergence suggesting potential bullish reversal. Overall, the trend is range-bound, awaiting a decisive breakout.
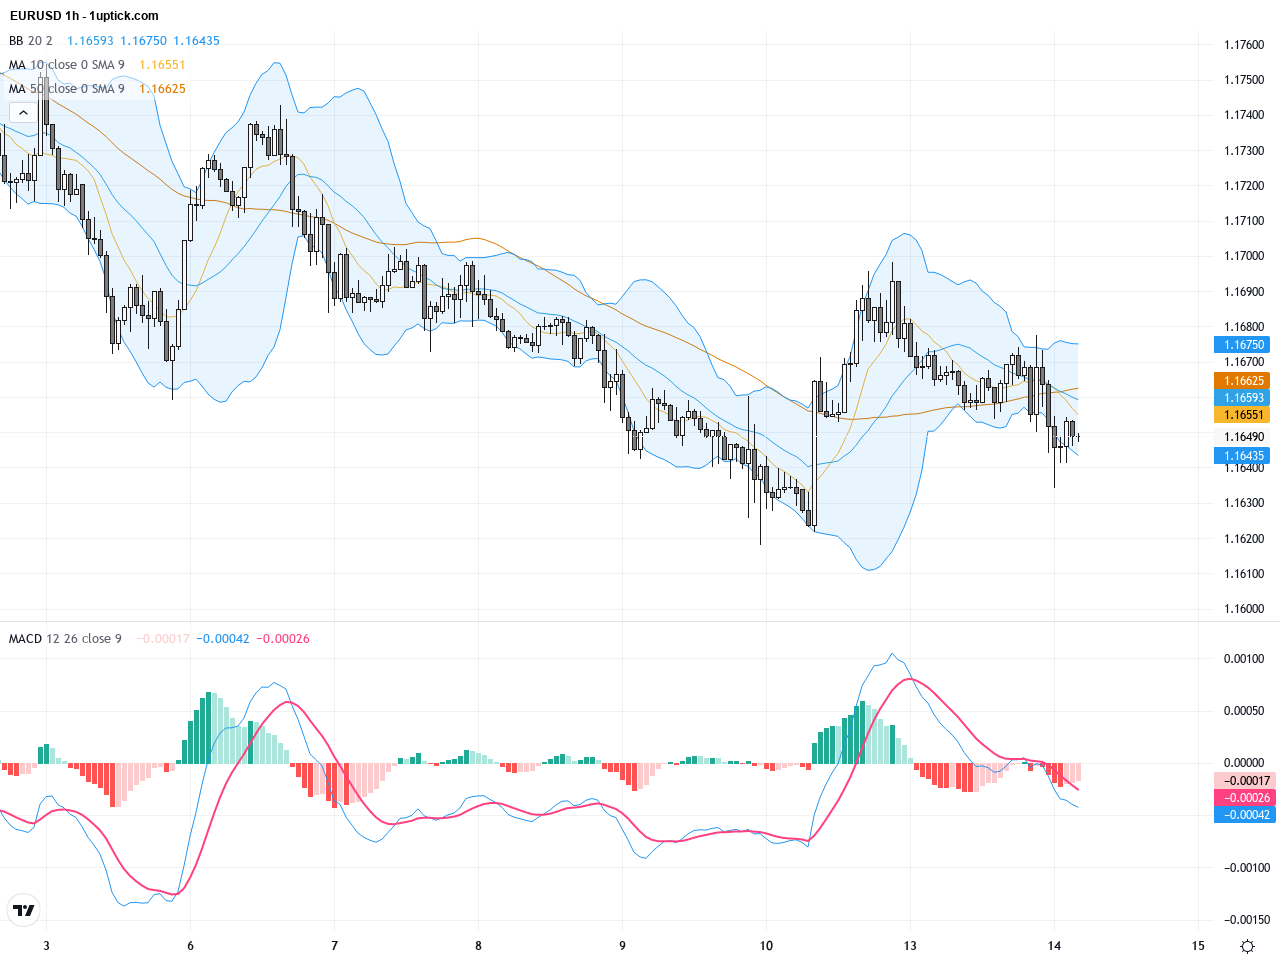
The hourly chart reflects price movements over the past 5 days, with EURUSD oscillating between 1.1635 and 1.1675. Bollinger Bands expansion suggests increased short-term volatility. MACD recently crossed upwards, signaling strengthening bullish momentum. Price has just broken above the 20-period moving average, showing short-term buying pressure. Additionally, a double bottom pattern has formed, hinting at a possible rebound imminently.
Technical Trend: EURUSD is currently in a cautiously bullish consolidation phase, showing a slow upward recovery.
Key technical insights feature the daily MACD convergence with positive RSI divergence, supporting growing bullish momentum. On the hourly chart, a MACD golden cross paired with the Bollinger Band expansion and a double bottom pattern provides strong evidence for an upcoming breakout. Traders should monitor the market’s reaction to the US CPI report as it will heavily influence short-term trend and trading setups for EURUSD.Today’s economic calendar in GMT+1 highlights US Consumer Price Index (CPI) and Core CPI releases at 14:30, alongside speeches from FOMC members. These events are highly relevant to EURUSD, as stronger-than-expected US inflation data or hawkish Federal Reserve comments could strengthen the dollar, pressuring EURUSD downward. Conversely, weaker data or dovish tones will likely support the euro. There are no significant Eurozone events today, so focus remains on US developments.
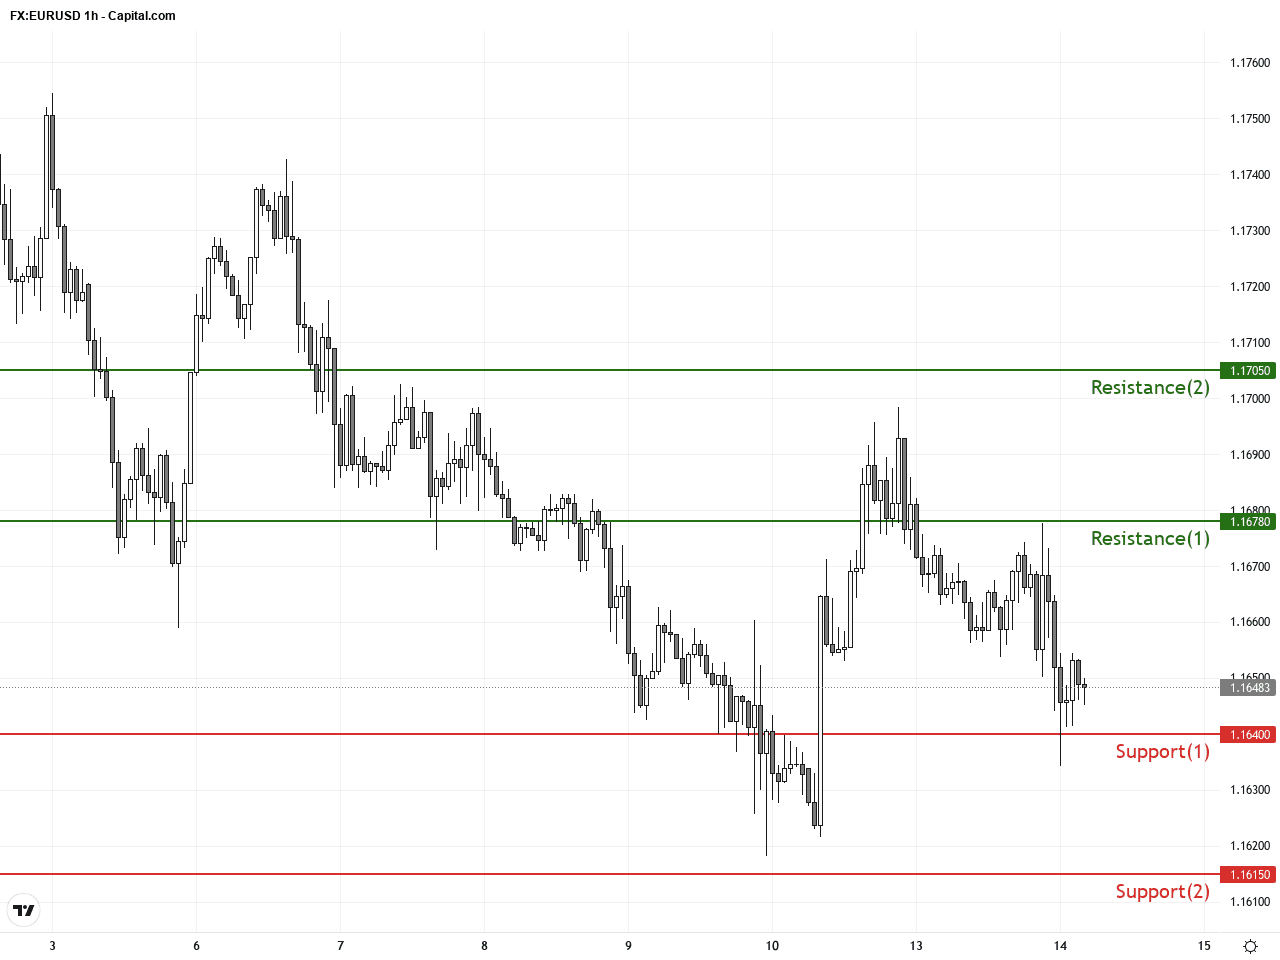
Resistance & Support
The above financial market data, quotes, charts, statistics, exchange rates, news, research, analysis, buy or sell ratings, financial education, and other information are for reference only. Before making any trades based on this information, you should consult independent professional advice to verify pricing data or obtain more detailed market information. 1uptick.com should not be regarded as soliciting any subscriber or visitor to execute any trade. You are solely responsible for all of your own trading decisions.