








 |
| Gold V.1.3.1 signal Telegram Channel (English) |

USDJPY: Head and Shoulders Pattern Signals Potential Short-term Weakness with Key Technical Levels
2026-04-20 @ 11:01
Over the past 48 hours, USD/JPY has experienced increased volatility, closing yesterday at 158.88, slightly higher than the previous day. Market sentiment was influenced by several key factors, including the Bank of Japan Governor Kazuo Ueda’s unclear stance on interest rates, which pressured the yen and boosted the USD/JPY exchange rate. Additionally, easing geopolitical tensions in the Middle East, particularly the reopening of the Strait of Hormuz, contributed to market stability, indirectly supporting the US dollar.
Recent market news highlights a complex mix of resilient economic data and evolving central bank signals shaping market uncertainty and volatility. Japan’s ongoing low-rate policy compared with higher US yields continues to drive the USD/JPY rate in the long term. Investors remain cautious as shifts in yield differentials and geopolitical developments can quickly alter currency prices.
For the average investor, the recent USD/JPY movements illustrate how global political and economic factors directly impact currency values. Especially amid trade tensions and fluctuating Middle East ceasefire hopes, currency markets present a landscape of both risks and opportunities. Those holding or trading USD/JPY should closely follow policy developments in Japan and the US alongside geopolitical news to stay attuned to market dynamics and mitigate risk.
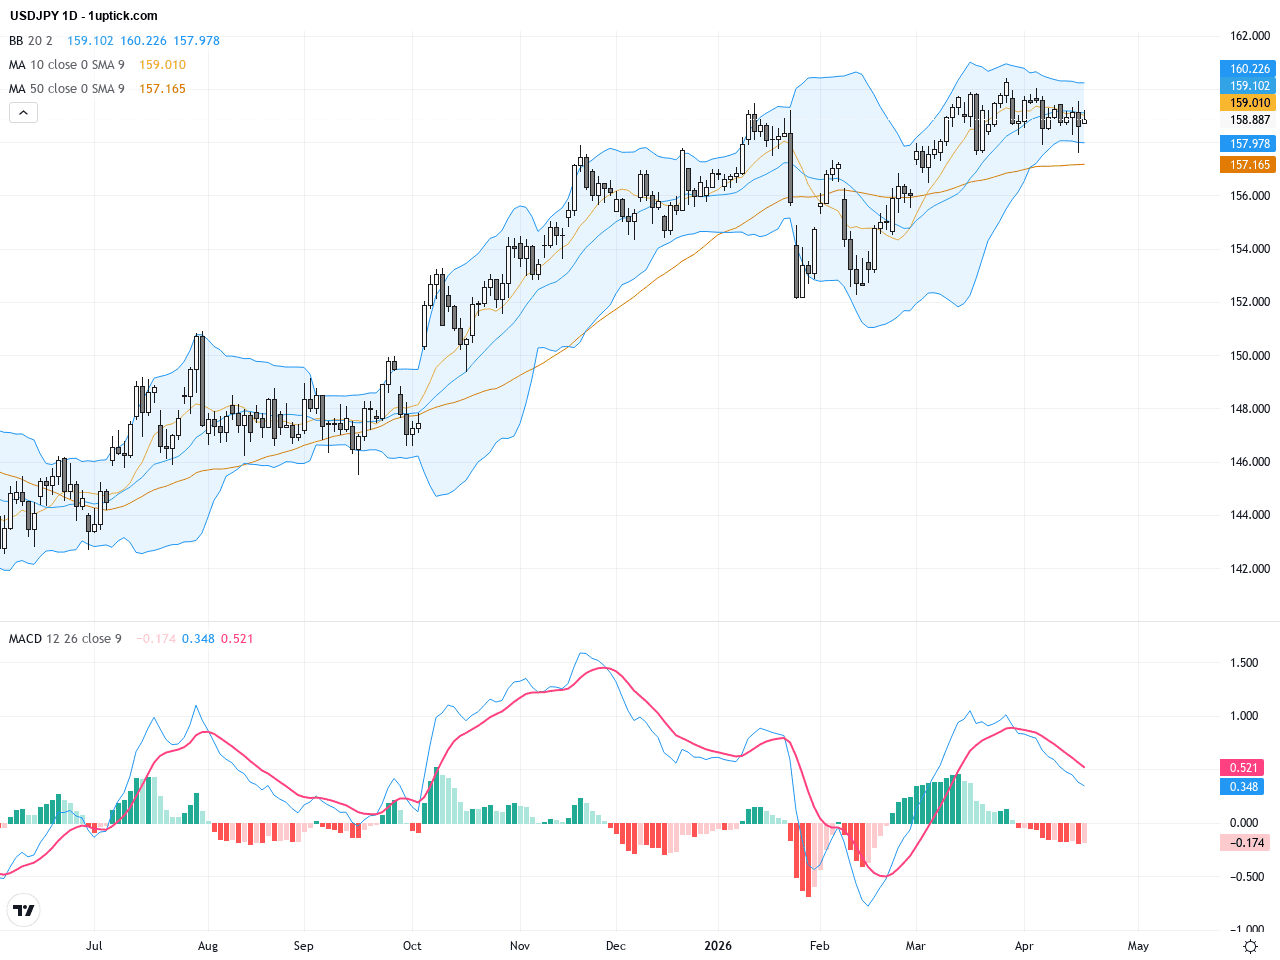
The daily chart shows a sustained uptrend in USDJPY since early this year, now forming a prominent head and shoulders pattern. The head peaks near 160, with shoulders positioned approximately at 159 and 158 respectively, indicating potential mid-term trend weakening. The 50-day and 200-day moving averages remain upward but are converging, hinting at a possible bearish crossover ahead. Bollinger Bands are narrowing, signaling decreased volatility, while MACD histogram turned negative, reflecting weakening bullish momentum and prompting traders to watch for trend reversal cues.
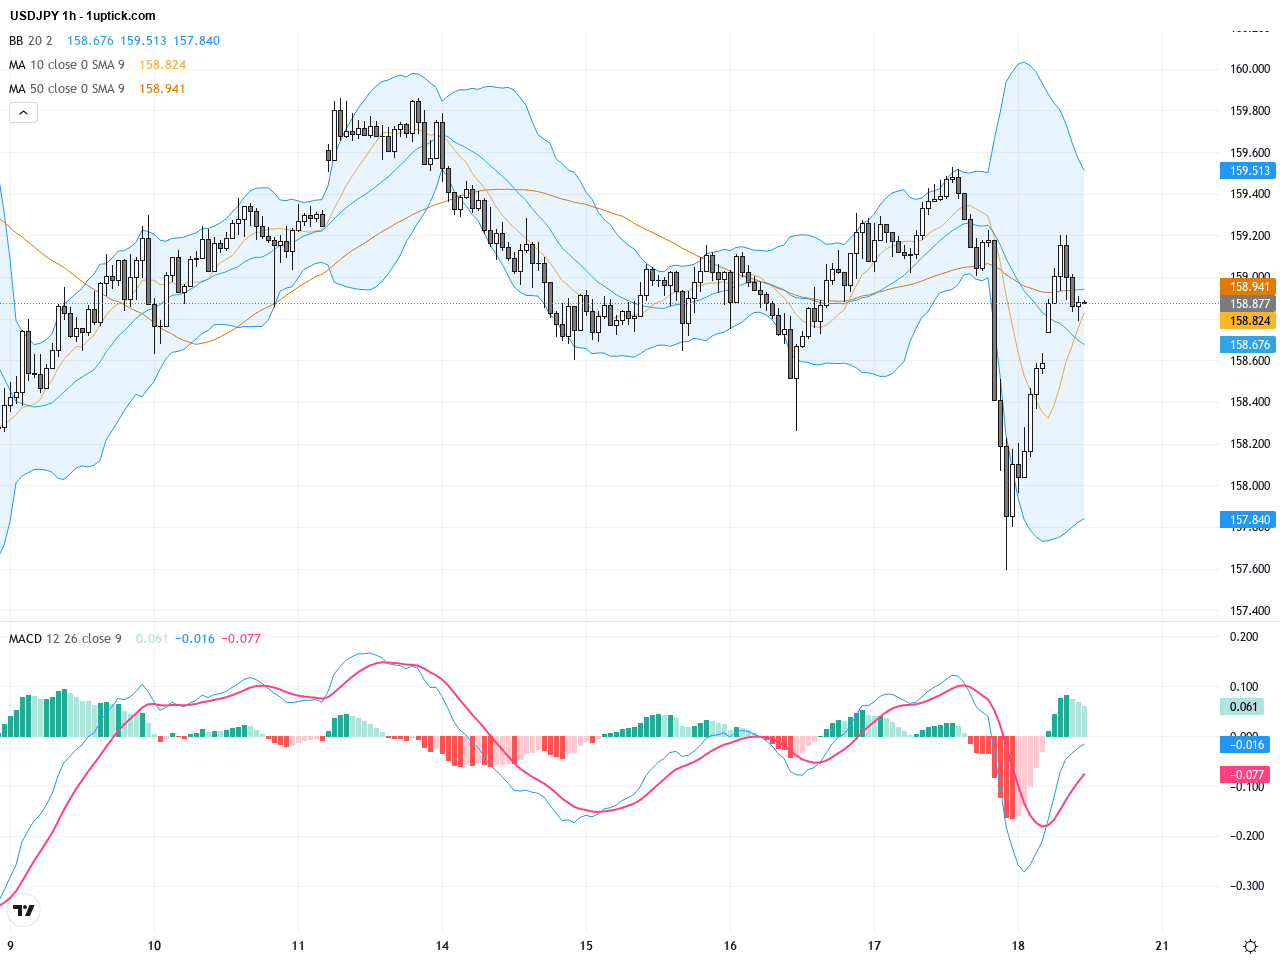
The hourly chart over the last 3 to 5 days reveals choppy price action within a symmetrical triangle formation near 158.5 support. Short-term moving averages (20 and 50 periods) are intertwined, and the MACD shows signs of bearish divergence. Price faces resistance near the upper Bollinger Band, suggesting limited upside. A recent bearish engulfing candlestick pattern implies increasing selling pressure in the short run. Traders should monitor for any decisive break below 158.5 support to confirm downside momentum.
Technical Trend: The current trend is cautiously bearish, shifting from bullishness toward consolidation with elevated short-term downside risks.
The developing head and shoulders pattern on the daily chart warns of a possible trend reversal for USDJPY. Negative MACD momentum and Bollinger Band constriction elevate the chances of a downside breakout. The symmetrical triangle on the hourly chart acts as a congestion zone; a break below 158.5 support level would confirm a bearish technical correction. Traders are advised to watch volume and momentum signals for high-probability trade setups combined with fundamental updates.Today’s GMT+1 economic calendar does not feature any major events directly impacting USDJPY. Key data include Canada’s Consumer Price Index and the European Central Bank Chairman’s speech, which are unlikely to significantly affect USDJPY. Market participants should focus on upcoming US and Japan-related news later in the day for clearer direction.
Resistance & Support

The above financial market data, quotes, charts, statistics, exchange rates, news, research, analysis, buy or sell ratings, financial education, and other information are for reference only. Before making any trades based on this information, you should consult independent professional advice to verify pricing data or obtain more detailed market information. 1uptick.com should not be regarded as soliciting any subscriber or visitor to execute any trade. You are solely responsible for all of your own trading decisions.