


 |
| Gold V.1.3.1 signal Telegram Channel (English) |

AUDUSD Technical & Fundamental Report: Aussie Bulls Defend 0.7200 Resistance Amid Hormuz Risk
2026-04-24 @ 06:01
Over the past 24 to 48 hours, the AUD/USD pair hovered slightly around the previous closing price of 0.71298, fluctuating within a narrow range between 0.71215 and 0.71346. During this period, the market remained heavily influenced by geopolitical tensions in the Hormuz Strait region, driving significant volatility in energy prices. With crude oil rebounding by 6.7% and the US Dollar Index (DXY) strengthening, Aussie bulls faced considerable pressure as the market sought to hold the psychologically crucial 0.7200 level.
Latest market insights reveal that the Australian dollar’s resilience has been directly tested by the Hormuz energy supply shock, with central bank rate hike expectations and consumer spending strength temporarily sidelined as risk sentiments dominate. Furthermore, Scotiabank’s view that the AUD remains undervalued and could advance to at least 0.75 offers a medium-term bullish outlook for investors. However, in the near term, with uncertainty around the US-Iran ceasefire hanging over markets, AUD/USD is showing signs of a technical consolidation phase.
For the average investor, this recent price action resembles a storm stirred by international energy security fears and geopolitical risk. Heightened concerns about future energy supplies have boosted safe-haven demand for the US dollar, naturally weighing on the commodity-linked Australian dollar’s upside. Nevertheless, the Aussie’s fundamental support rooted in Australia’s economic strength and resources exports suggests growth potential exists, though short-term volatility is likely to persist.

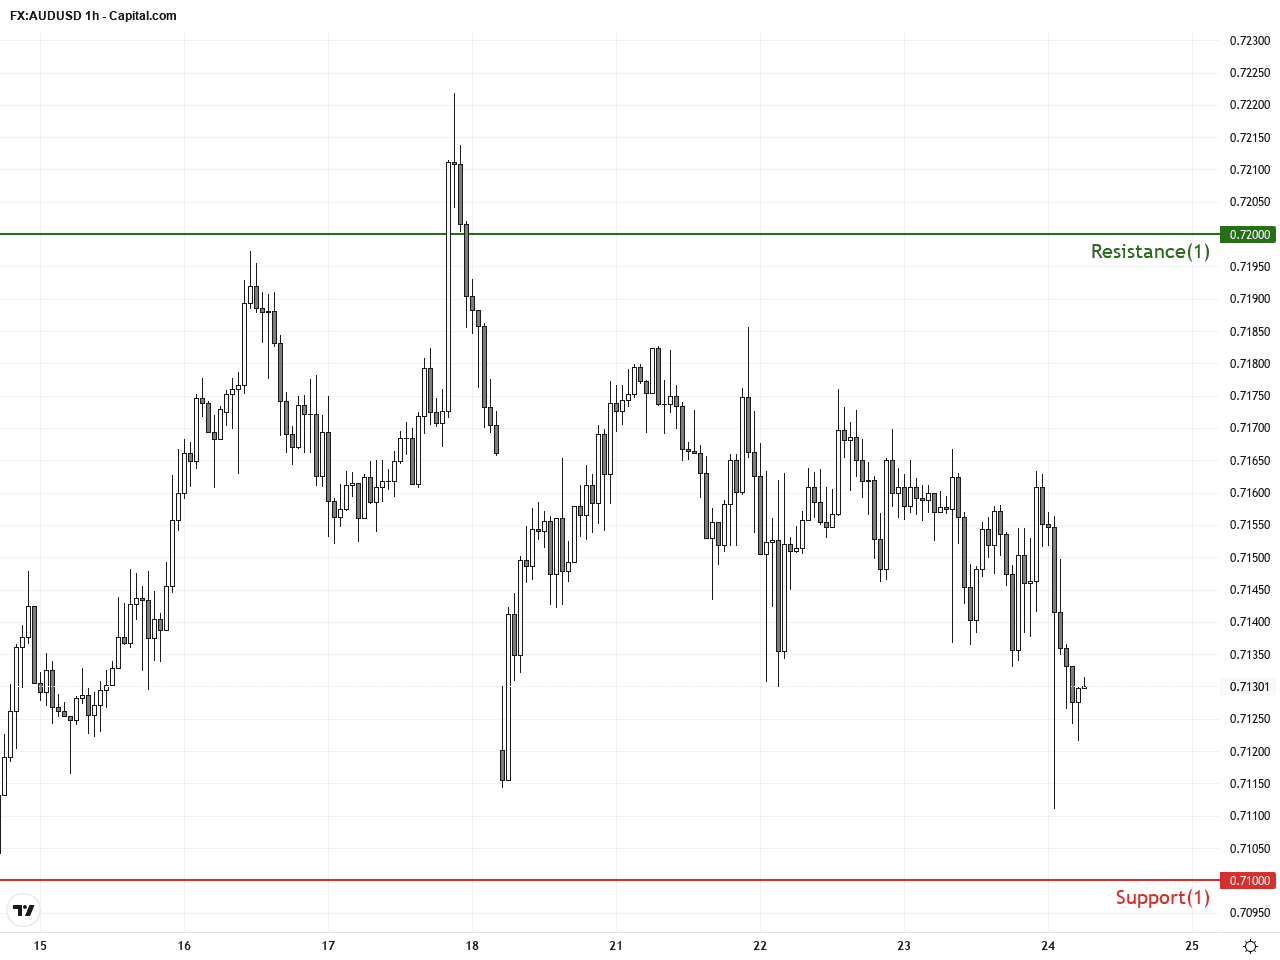
The daily chart shows a strong uptrend for AUDUSD, with prices consistently trading above the 50-day and 200-day moving averages, affirming long-term bullish sentiment. Bollinger Bands remain slightly expanding upward, indicating persistent volatility. The MACD shows positive momentum with the signal line below the MACD line, reinforcing buying strength. Key resistance is located between 0.7060 and 0.7200; surpassing this range could open the door toward the next target near 0.7300.
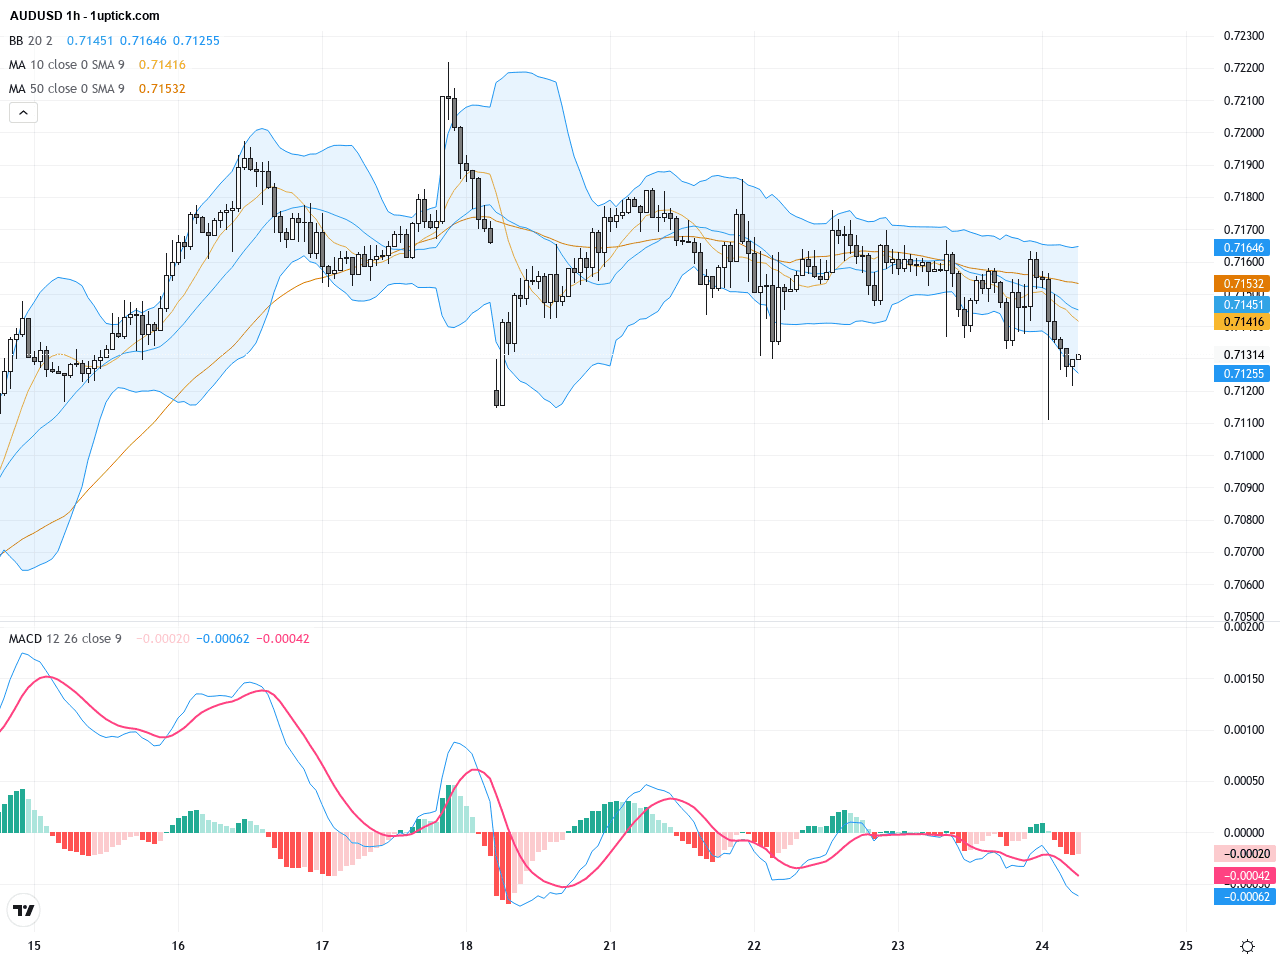
On the hourly chart over the past five days, AUDUSD price action displays a consolidating uptrend. The short-term 30-EMA and 60-EMA have recently crossed bullishly, supported by MACD histogram turning positive, signaling renewed momentum. The price has found strong support around 0.7100 multiple times without breaking lower, forming a bullish flag pattern—usually a continuation pattern indicating potential for a further upside move.
Technical Trend: Clearly established bullish trend, best described as ‘Firmly Bullish,’ with some near-term consolidation risks but overall upward momentum intact.
Technical indicators reflect strengthening bullish momentum on both daily and hourly timeframes. The pair’s ability to maintain support above critical levels combined with a flag pattern suggests higher probability of a breakout above resistance is imminent. Traders should watch closely for a decisive 0.7200 breakout accompanied by rising volume to confirm continuation of the uptrend.Today’s economic releases, including Japan’s CPI and core CPI data, have yet to be published and are unlikely to impact AUDUSD meaningfully at this time. Other events such as European and North American retail sales and inflation forecasts have minimal direct linkage to AUDUSD price action today. Overall, no major economic event scheduled today is expected to cause significant volatility for AUDUSD, leaving geopolitical developments and energy price movements as the primary focus for traders.
Resistance & Support
The above financial market data, quotes, charts, statistics, exchange rates, news, research, analysis, buy or sell ratings, financial education, and other information are for reference only. Before making any trades based on this information, you should consult independent professional advice to verify pricing data or obtain more detailed market information. 1uptick.com should not be regarded as soliciting any subscriber or visitor to execute any trade. You are solely responsible for all of your own trading decisions.