


 |
| Gold V.1.3.1 signal Telegram Channel (English) |
How to Develop Risk Management Frameworks for Forex Pairs Using Options Volatility Surfaces, Carry Trade Unwinds, and Central Bank Forward Guidance in High-Interest Rate Environments
2026-05-01 @ 00:05
Developing Advanced Risk Management Frameworks for Forex Pairs in High-Interest Rate Environments
In today’s complex macroeconomic landscape characterized by elevated interest rates across major economies, forex traders and institutional investors face unprecedented challenges in managing currency exposure. This guide provides a systematic approach to building sophisticated risk management frameworks that leverage options market intelligence, carry trade dynamics, and central bank communication analysis. By integrating these three critical pillars, market participants can better anticipate volatility regimes, protect portfolios from sudden market dislocations, and capitalize on risk-adjusted opportunities.
Step 1: Constructing and Interpreting Options Volatility Surfaces
Begin by building a comprehensive volatility surface for your target currency pairs. A volatility surface maps implied volatility across different strike prices (delta) and expiration dates, providing a three-dimensional view of market expectations. Focus on key metrics including: (1) At-the-money (ATM) implied volatility levels compared to historical realized volatility; (2) Risk reversals (25-delta) that indicate directional bias and tail risk perceptions; (3) Butterfly spreads that measure the pricing of extreme moves. In high-interest rate environments, pay particular attention to the term structure of volatility—an inverted curve often signals near-term event risk such as central bank meetings or economic data releases. Utilize platforms like Bloomberg OVDV or Reuters Eikon to extract real-time surface data, and establish threshold alerts when risk reversals exceed two standard deviations from their 90-day moving average.
Step 2: Establishing Carry Trade Unwind Early Warning Systems
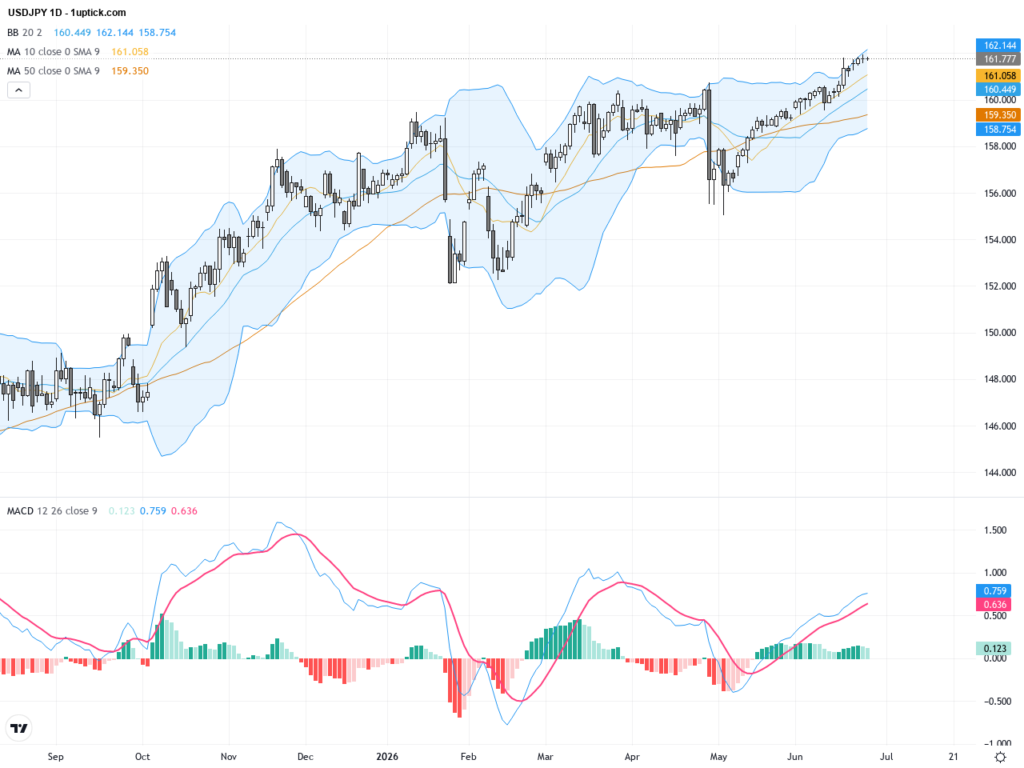
Carry trades—borrowing in low-yielding currencies to invest in high-yielding ones—become particularly vulnerable during risk-off episodes in high-rate environments. Develop a monitoring dashboard that tracks: (1) CFTC Commitment of Traders positioning data for speculative carry exposure; (2) Cross-currency basis swap spreads that indicate funding stress; (3) VIX and currency-specific volatility indices correlation patterns; (4) Emerging market sovereign CDS spreads as leading indicators. When positioning reaches extreme levels (top 90th percentile historically) combined with rising volatility, implement systematic deleveraging protocols. Historical analysis shows that carry trade unwinds during rate hiking cycles—such as the 2018 EM crisis and 2022 JPY intervention period—were preceded by basis swap widening of 15-20 basis points within two weeks.
Step 3: Decoding Central Bank Forward Guidance and Policy Reaction Functions
Central bank communication serves as a primary driver of forex volatility in high-rate regimes. Establish a systematic framework for analyzing forward guidance by: (1) Creating a hawkish-dovish scoring system for monetary policy statements using natural language processing or manual keyword tracking; (2) Monitoring dot plots, SEP projections, and staff forecasts for policy rate trajectories; (3) Tracking the divergence between market-implied rates (OIS curves) and central bank projections; (4) Analyzing press conference tone shifts using sentiment indicators. Key inflection points occur when the gap between market expectations and central bank guidance exceeds 50 basis points over the 12-month horizon—historically, such divergences resolve with significant currency repricing within 4-6 weeks.
Step 4: Integrating Multi-Factor Risk Scoring Models
Combine the three analytical pillars into a unified risk scoring framework. Assign weighted scores to: (1) Volatility surface signals (30% weight)—elevated skew, steep term structure, ATM vol above 75th percentile; (2) Carry positioning indicators (30% weight)—extreme speculative positions, basis swap stress, correlation breakdown; (3) Central bank guidance factors (40% weight)—policy divergence, communication tone shifts, meeting proximity. Generate composite risk scores on a 1-100 scale, with scores above 70 triggering defensive positioning protocols including reduced position sizing, tighter stop-losses, and increased options hedging. Backtest this model across multiple rate cycles including 2015-2019 Fed normalization and 2022-2024 global tightening.
Step 5: Implementing Dynamic Hedging Strategies
Based on your risk scoring output, deploy appropriate hedging instruments calibrated to current volatility surface conditions. When risk scores are elevated: (1) Purchase out-of-the-money puts on high-yielding currencies with 1-3 month expiries, utilizing favorable skew pricing; (2) Implement zero-cost risk reversals that sell upside calls to fund downside protection; (3) Use variance swaps to hedge against volatility regime changes; (4) Consider options on options (volvol) products when surface convexity is extreme. Size hedges relative to portfolio VaR contribution, targeting 50-75% coverage of tail risk scenarios during high-alert periods. Review and rebalance hedging positions weekly or when risk scores change by more than 15 points.
Step 6: Establishing Governance and Review Protocols
Formalize the risk management framework through robust governance structures. Document all model assumptions, data sources, and calibration parameters in a comprehensive policy manual. Establish weekly risk committee reviews examining: (1) Model performance attribution versus realized P&L protection; (2) False positive and negative rates requiring threshold recalibration; (3) Emerging risk factors not captured in current framework; (4) Stress testing results under historical and hypothetical scenarios. Conduct quarterly backtests and annual model validation with independent risk oversight. Maintain audit trails for all position decisions linked to framework signals.
Insider Insight: The most sophisticated institutional forex desks recognize that volatility surfaces, carry dynamics, and central bank guidance are deeply interconnected rather than independent factors. During the 2022-2023 rate hiking cycle, JPY carry trade unwinds were consistently preceded by shifts in BOJ forward guidance interpretation, which manifested first in options risk reversals before spot prices moved. The alpha lies in identifying the transmission sequence: guidance shifts → volatility surface repricing → positioning adjustment → spot movement. By monitoring this cascade in real-time and maintaining disciplined framework adherence, traders can position ahead of the crowd while maintaining robust downside protection. Remember that in high-rate environments, the cost of being wrong increases exponentially—making systematic risk frameworks not optional but essential for survival and sustainable returns.