


 |
| Gold V.1.3.1 signal Telegram Channel (English) |

XAUUSD: Gold Breaks Above 20 & 50-Day Moving Averages, Signaling Strong Technical Rally, May 9, 2026
2026-05-09 @ 04:25
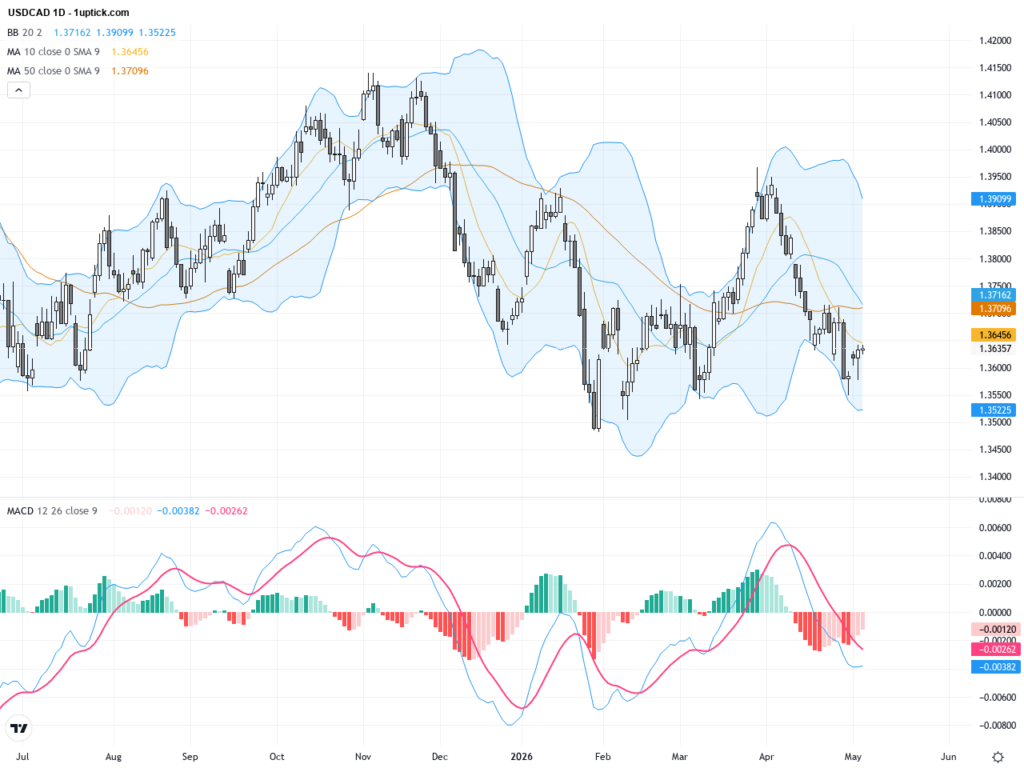
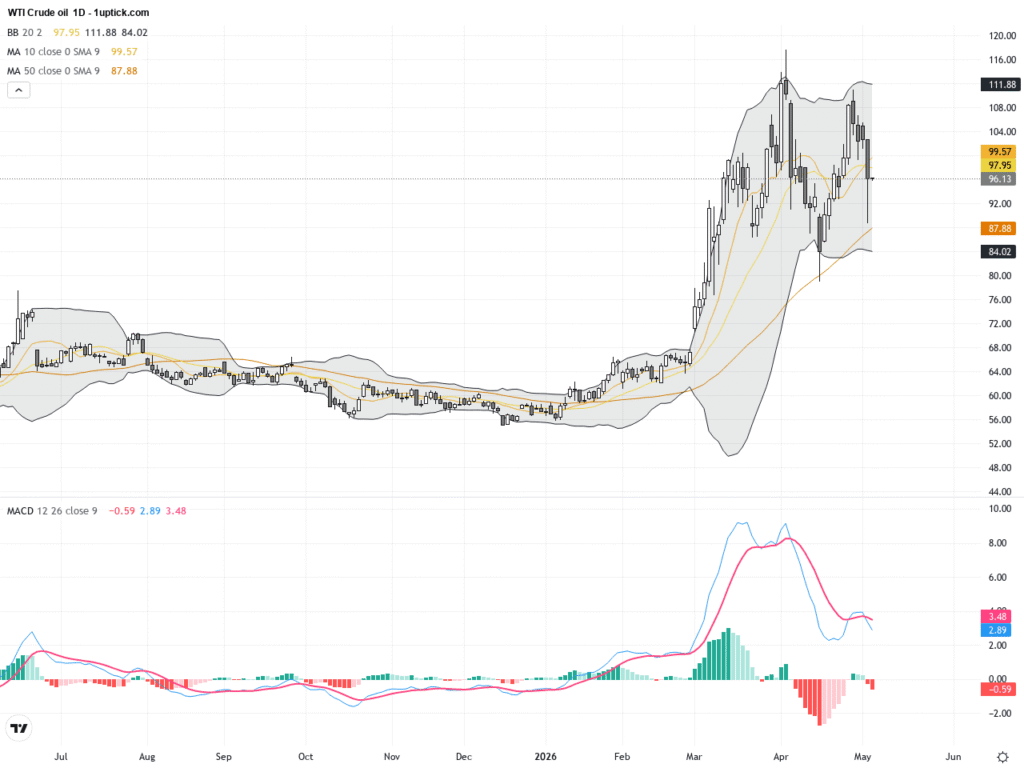
Over the past 48 hours, XAUUSD (Gold) has experienced a robust rally, climbing significantly from the closing price of $4702.355 on May 7, 2026. This upward momentum was largely driven by a weakening US dollar and falling oil prices, prompting investors to flock to gold as a safe haven asset.
According to the latest market news, the surge in gold prices is partly fueled by optimistic progress in US-Iran peace talks, which has eased stagflation fears and boosted demand for risk-averse assets like gold. Additionally, heightened trading volume in gold-related ETFs and CFDs underscores the market’s strong interest in the metal.
To put it simply for the average investor, it’s akin to seeking shelter before a storm — as global risk rises, the dollar weakens and oil prices drop, gold’s appeal as a secure refuge intensifies. This dynamic has propelled gold to stand out as a preferred safe haven asset in recent sessions.
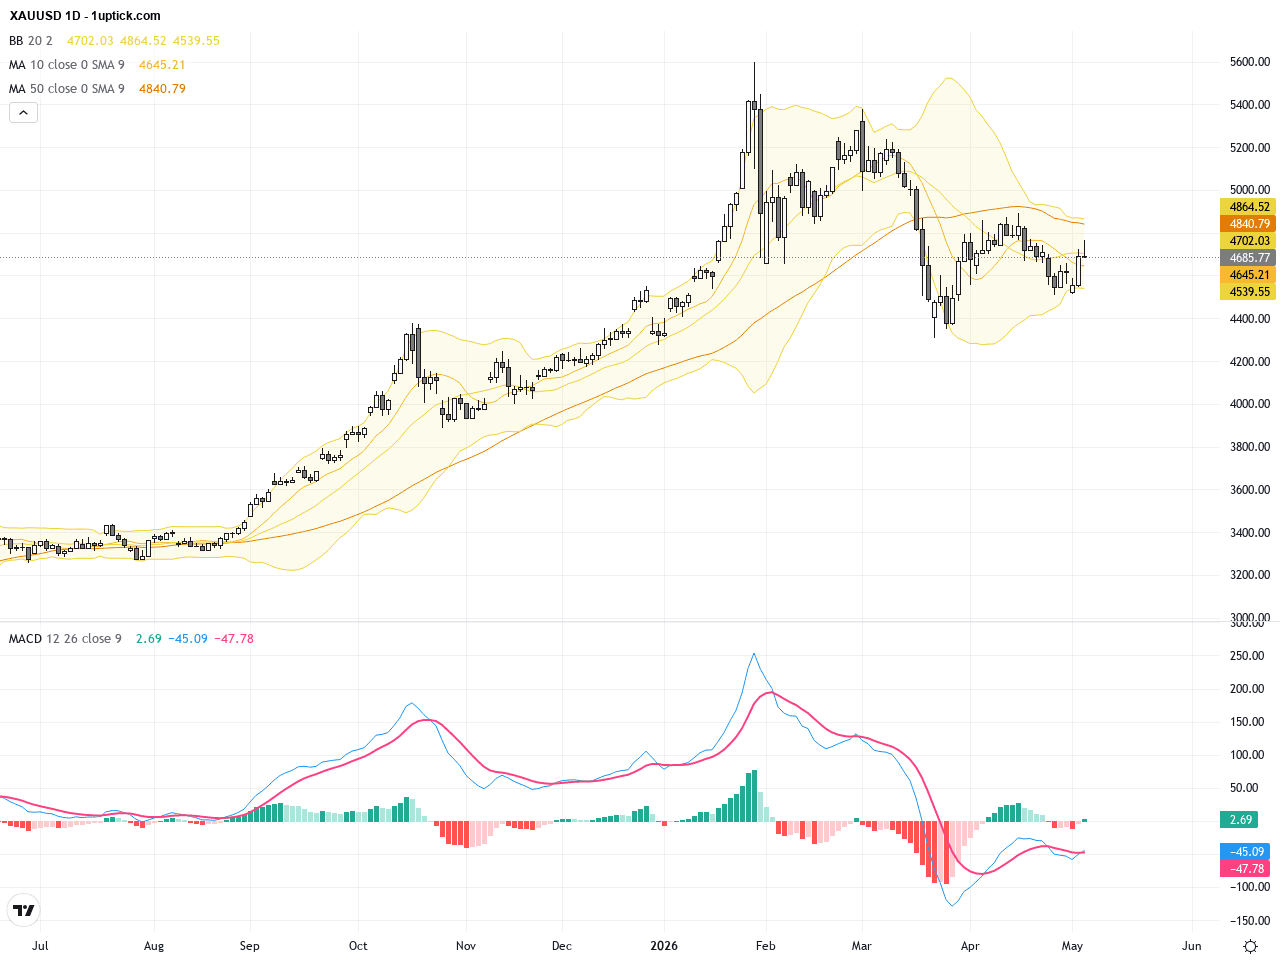
On the daily chart, XAUUSD shows a clear uptrend with a sharp rebound from around 4557 on May 5, breaking above both the 20-day and 50-day moving averages, signaling strong short to medium-term buying interest. The Bollinger Bands are expanding, indicating increasing volatility. MACD is above the zero line and expanding, confirming bullish momentum. The 20-day MA now acts as immediate support, while the break of the 50-day MA signals a potential medium-term trend reversal.
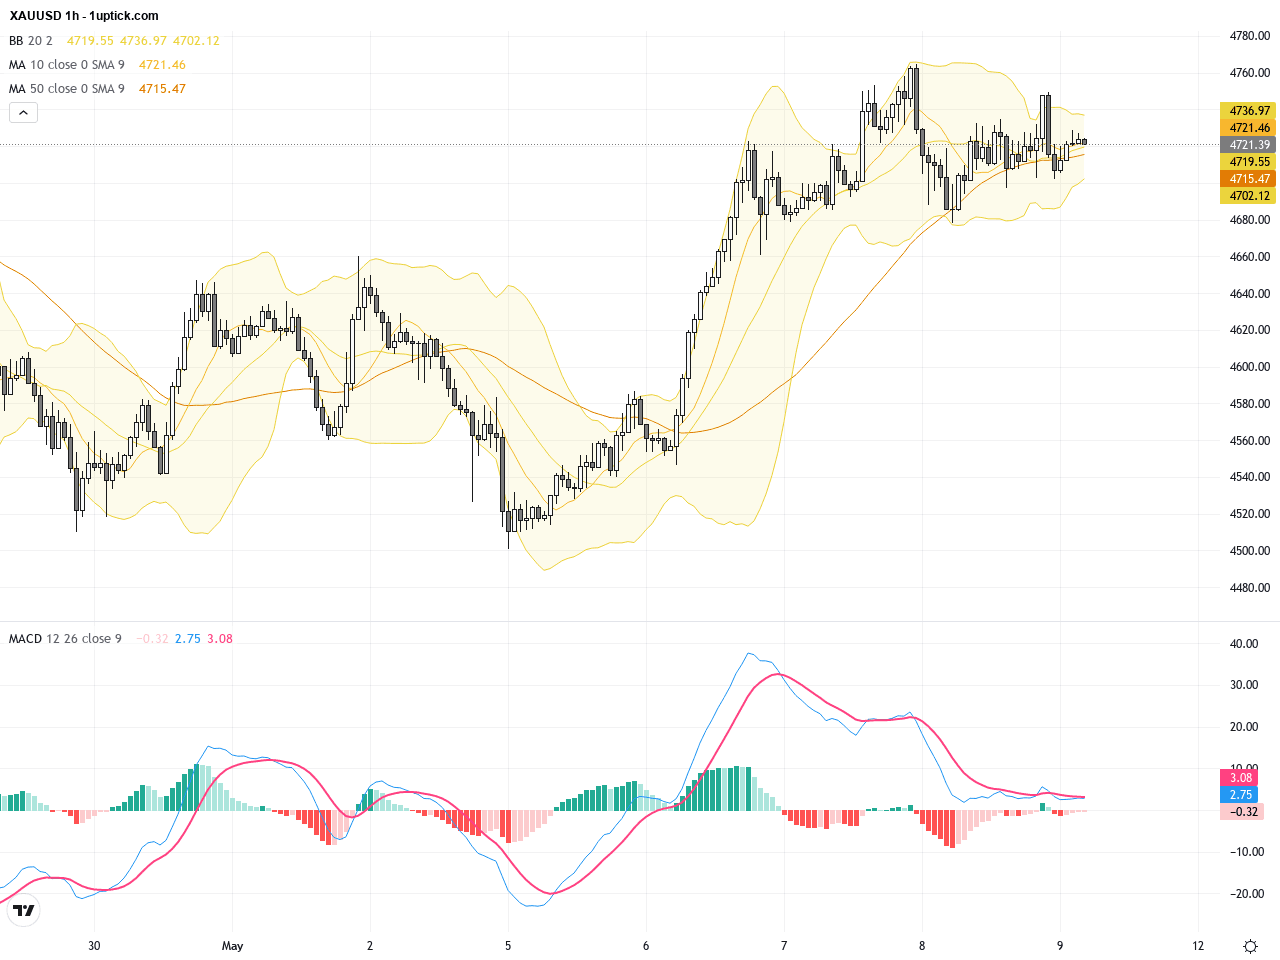
The hourly chart for the past 3-5 days reveals increased volatility and several attempts to push above the 4750 resistance, met with some short-term consolidation. The MACD recently formed a bullish crossover, and RSI remains above 60, indicating strong momentum. Bollinger Bands contracted then expanded in recent hours, suggesting a new wave of price movement incoming. Short-term trend remains bullish but watch for potential pauses near resistance levels.
Technical Trend: Decisively Bullish Trend
Technically, gold’s break above the 20-day and 50-day moving averages signals a robust bullish trend. Daily MACD expansion and widening Bollinger Bands support continued upward potential. The hourly MACD golden cross and elevated RSI underpin sustained short-term buying pressure. Recent flag and retracement patterns provide a good setup for entry. Traders should watch for volatility spikes around the nonfarm payroll release and be mindful of possible short-term pullbacks.Today’s economic calendar includes multiple European industrial and trade data releases, such as Germany’s trade balance, exports, and imports, which have no immediate direct impact on XAUUSD. The key event to monitor is the US nonfarm payroll report at 14:30 GMT+1. If US employment data surpass expectations, the USD may strengthen, putting pressure on gold prices. Conversely, weaker-than-expected data is likely to support further upside in XAUUSD. No other significant events are expected to directly influence the gold price today.
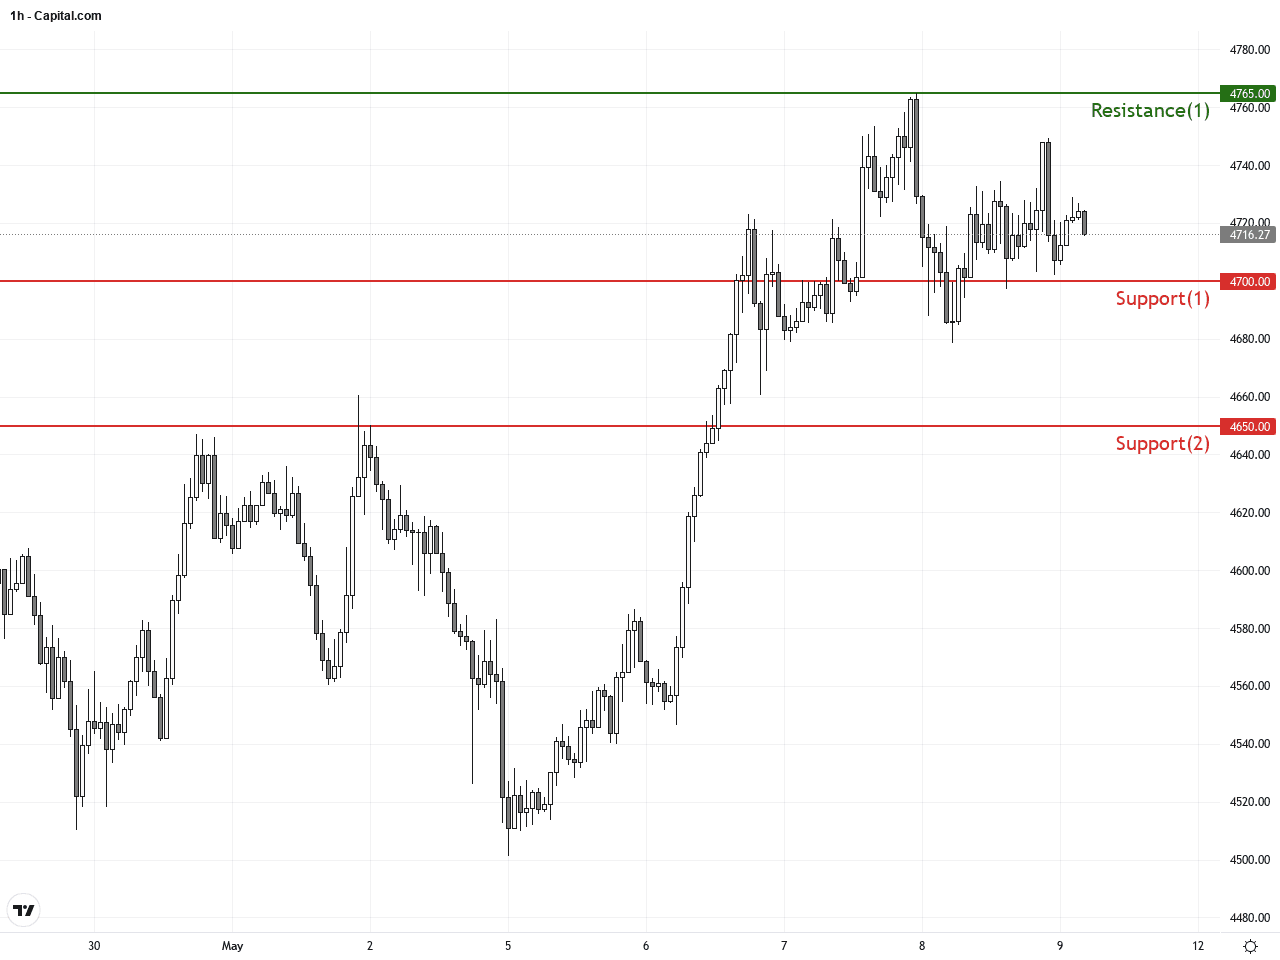
Resistance & Support
The above financial market data, quotes, charts, statistics, exchange rates, news, research, analysis, buy or sell ratings, financial education, and other information are for reference only. Before making any trades based on this information, you should consult independent professional advice to verify pricing data or obtain more detailed market information. 1uptick.com should not be regarded as soliciting any subscriber or visitor to execute any trade. You are solely responsible for all of your own trading decisions.