


 |
| Gold V.1.3.1 signal Telegram Channel (English) |

XAUUSD: Dollar Rally Pressures Gold at Key Support Levels, May 15, 2026
2026-05-15 @ 05:04
Over the past 48 hours, gold (XAUUSD) prices have remained under pressure, showing a noticeable decline compared to the closing price of 4650.665 on May 14. The primary drivers include a four-day sustained rally in the US dollar alongside strong recent US inflation data, which has dampened hopes for significant Fed rate cuts and reduced gold’s appeal as a safe haven.
Recent market news highlights that the strong dollar dampened gold buying momentum, while escalating tensions in Iran boosted oil prices, indirectly weighing on gold prices. Gold struggled to break key resistance levels, indicating bearish dominance in the near term. Meanwhile, silver prices surged driven by robust industrial demand and speculative buying, creating a divergence in precious metal performance.
For the average investor, this situation reflects how a stronger dollar and solid economic data decrease gold’s attractiveness as a non-yielding asset, causing price pressure. Moreover, geopolitical tensions have so far failed to lift safe-haven demand sufficiently to support gold prices. Investors should watch upcoming US economic releases and global risk factors closely to reassess gold’s role as a defensive component in their portfolios.
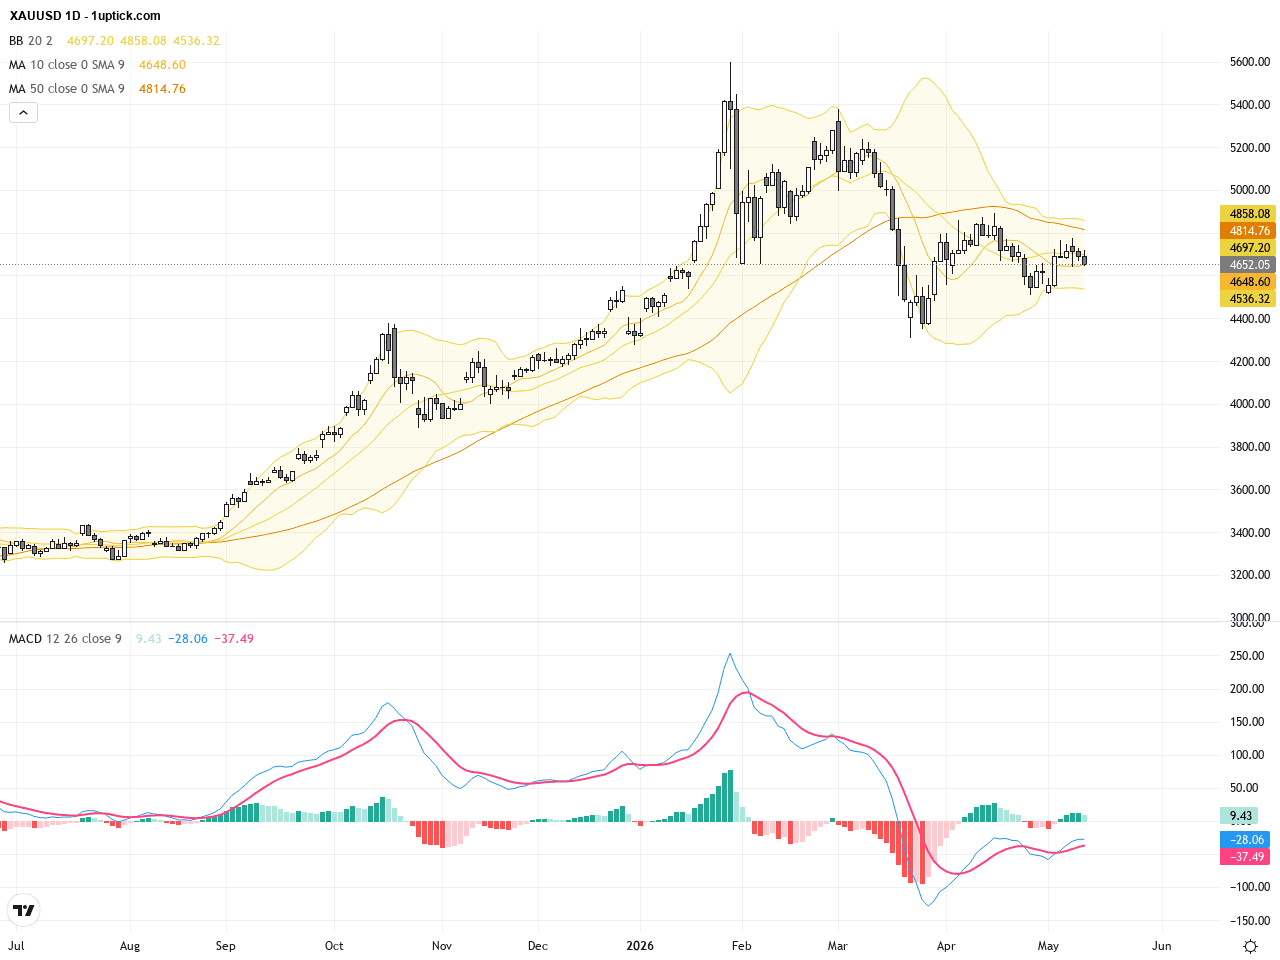
The daily chart shows XAUUSD peaked around 4740 on April 22 before entering a downward retracement phase, sliding under 4700 currently. The 200-day moving average confirms bearish momentum with multiple failed rebounds near resistance zones. Bollinger Bands are narrowing indicating reduced volatility. The MACD is in negative territory but is showing signs of weakening selling pressure, hinting at a potential short-term consolidation. The overall trend leans bearish but short-term rebound opportunities exist, pending how nearby support levels hold.

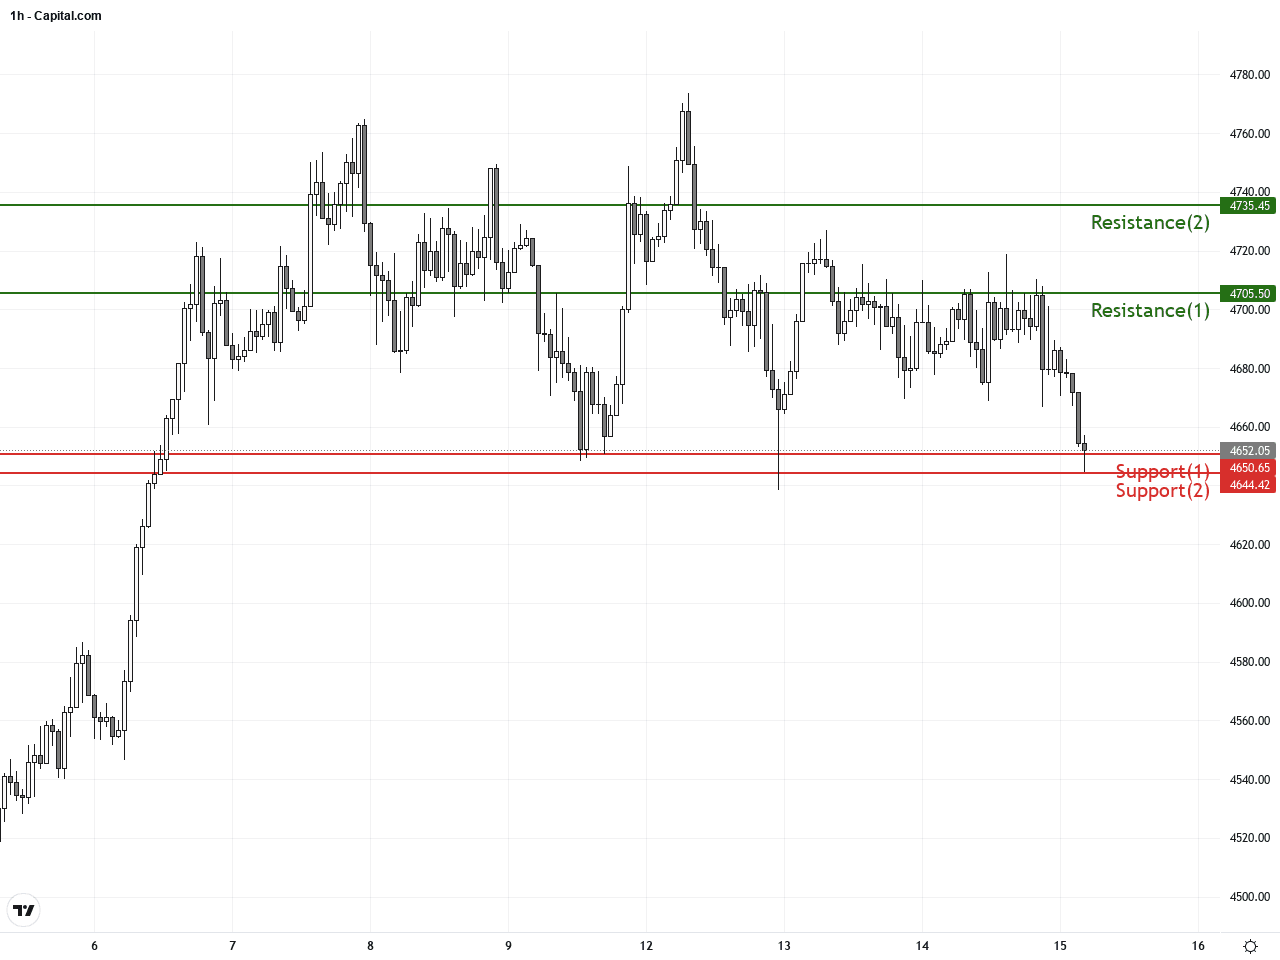
The hourly chart over the last 3 to 5 days highlights a tight range-bound movement between approximately 4660 and 4695. The 20 and 50 short-term moving averages are intertwined, with Bollinger Bands contracting further indicating a momentum pause. A recent MACD bullish crossover suggests short-term buyers are stepping in. Recent candlesticks feature hammer shapes and some closing strength, signaling possible minor recoveries within the dominant bearish environment, albeit capped by the ongoing USD strength.
Technical Trend: Cautiously Bearish Consolidation
XAUUSD is currently at a pivotal juncture between critical support and resistance zones. Both daily and hourly technicals indicate short-term consolidation with a bearish bias driven by a strong USD. The MACD on the hourly timeframe shows a recent bullish crossover, hinting at a potential correction bounce. The presence of hammer candlesticks reinforces this. Traders should monitor USD movements and key economic data releases closely, as these will dictate whether gold sells off further or stabilizes. Breaking below key support could accelerate declines, while reclaiming resistance levels may open the door to a fresh rally.Today’s economic calendar is highlighted by the release of multiple UK March economic data points including GDP, trade balance, industrial and manufacturing output, which mostly beat forecasts and could support the GBP and risk sentiment. This might weigh mildly on the US dollar. Crucially for US data, April’s inflation measures and retail sales will be released later; stronger-than-expected figures could bolster the USD and exert downward pressure on gold. There are no direct major events aimed specifically at gold prices, so market moves will largely depend on USD and risk sentiment dynamics.
Resistance & Support
The above financial market data, quotes, charts, statistics, exchange rates, news, research, analysis, buy or sell ratings, financial education, and other information are for reference only. Before making any trades based on this information, you should consult independent professional advice to verify pricing data or obtain more detailed market information. 1uptick.com should not be regarded as soliciting any subscriber or visitor to execute any trade. You are solely responsible for all of your own trading decisions.