









 |
| Gold V.1.3.1 signal Telegram Channel (English) |
AUDUSD Breaks Key Resistance as Australian Dollar Gains Momentum – Trading Outlook and Technical Patterns, May 29, 2026
2026-05-29 @ 06:01
Over the past 24 to 48 hours, AUD/USD has shown a notable rebound, trading around 0.716—up from yesterday’s closing price of 0.7141. The market was primarily driven by softer Australian jobs data along with growing hopes of a Middle East peace deal, both factors fueling appetite for risk and supporting the Australian dollar.
According to the latest market news, despite the weak employment figures in Australia, investors remain optimistic about the Reserve Bank of Australia’s (RBA) hawkish stance and the reduced uncertainty regarding the US Federal Reserve’s rate outlook. In particular, positive developments in Middle East peace talks eased risk-off sentiment, leading capital flows back into risk-sensitive currencies like AUD.
For the average investor, this shift means that even though economic fundamentals like jobs data appeared weak, improved geopolitical conditions combined with stable central bank policy expectations have been key to underpinning the AUD’s recent strength. In simple terms, favorable international developments and steady policy views have helped the Australian dollar find support amid volatile markets, offering short-term trading opportunities.
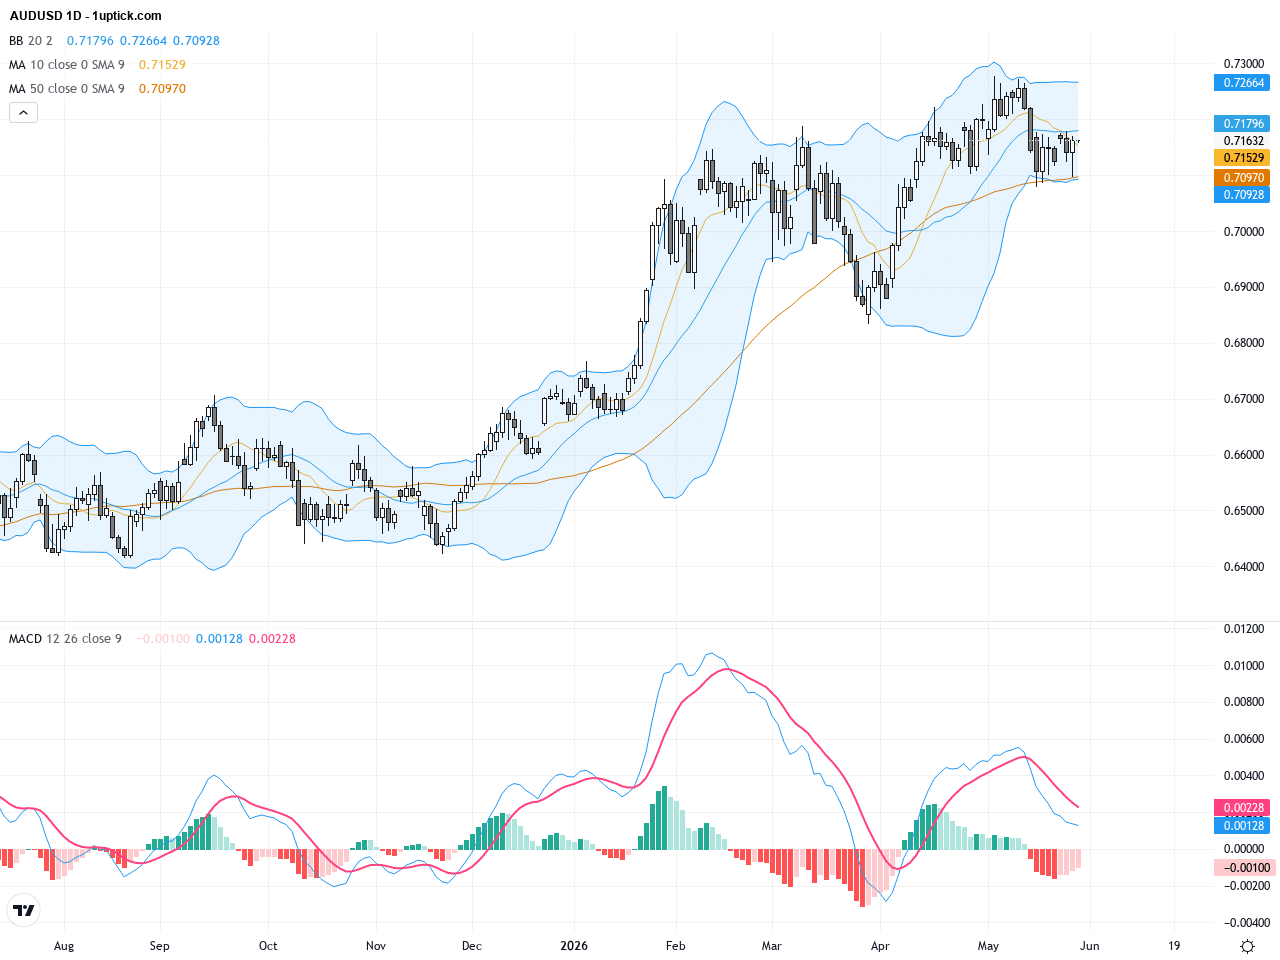
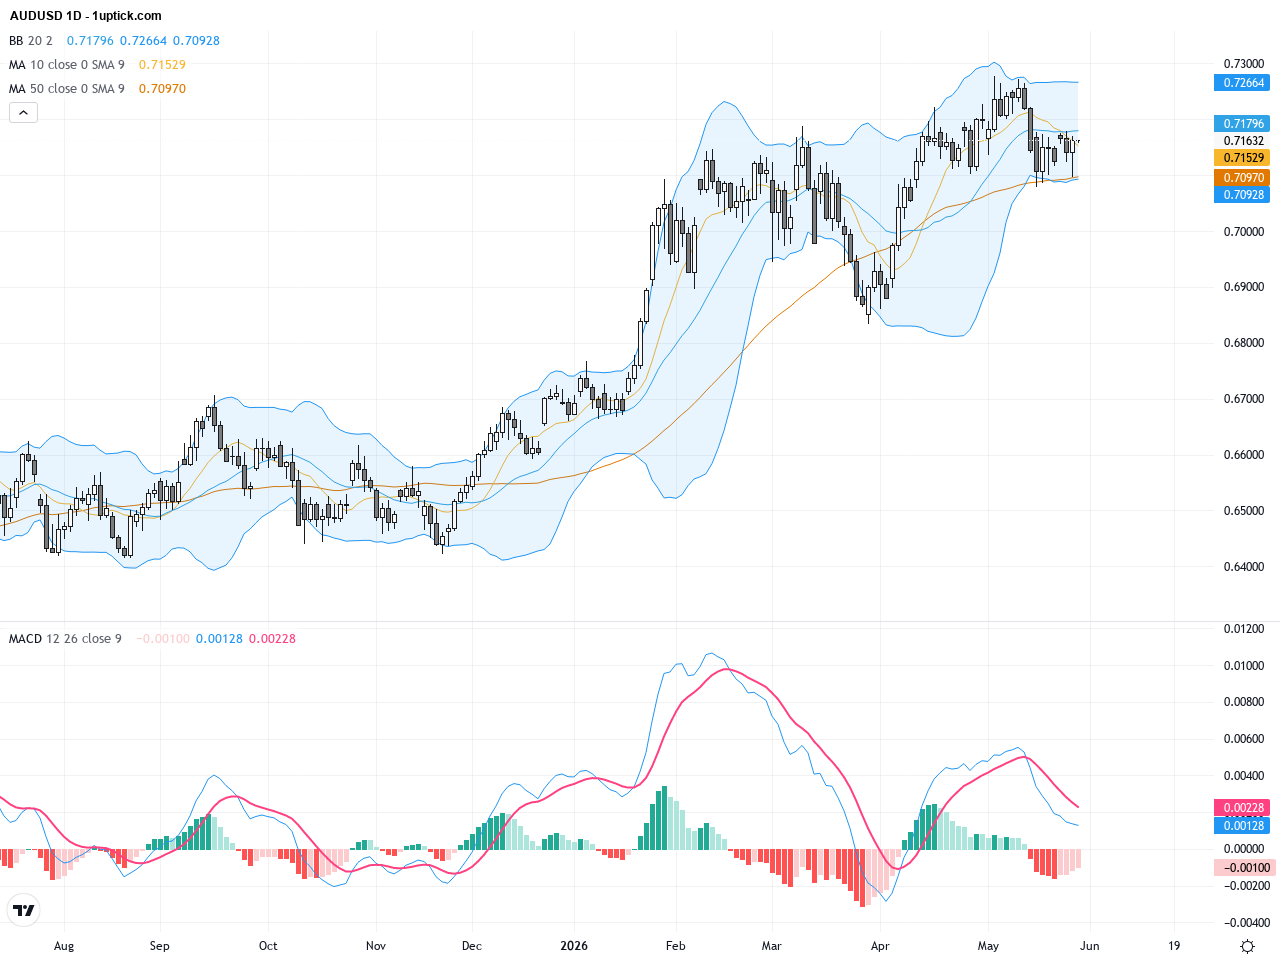
The daily chart depicts AUDUSD gradually recovering from recent lows, forming a rectangle pattern with prices sustaining above 0.7150 and breaching the nine-day EMA resistance. MACD shows increasing bullish momentum with expanding positive bars, and Bollinger Bands widen indicating growing volatility. Long-term moving averages (50-day and 200-day) are aligned bullishly, reinforcing the overall upward trend.
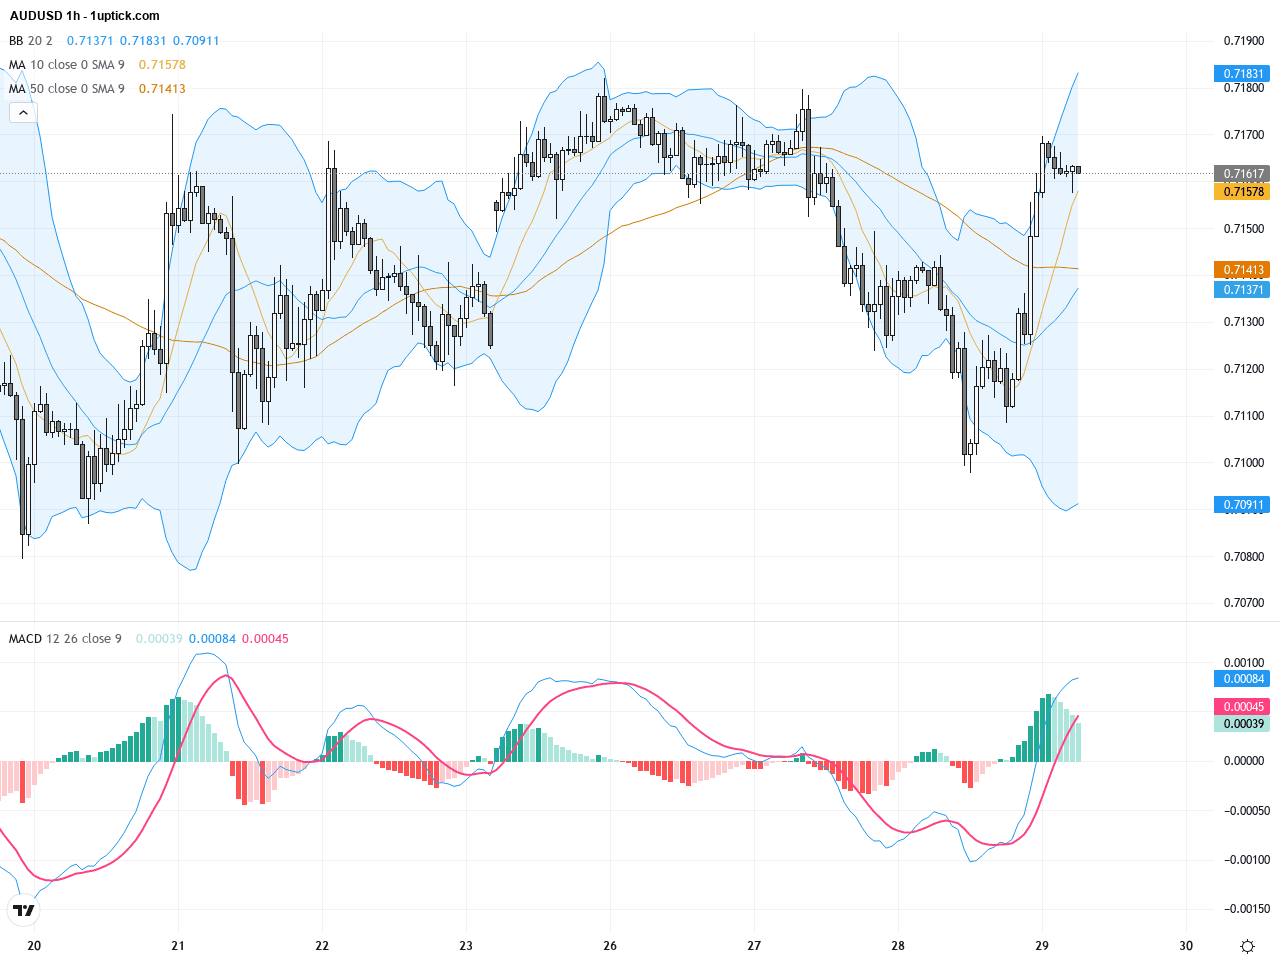
The hourly chart reveals a pronounced rebound over the past 3-5 days, breaking through the key resistance near 0.7120 and holding above 0.7150. A recent golden cross in short-term moving averages, RSI holding in neutral-to-strong zone, and positive MACD histogram indicate active short-term buying pressure. Bollinger Bands are widening, offering room for further upside momentum as prices have not yet reached the upper band.
Technical Trend: The prevailing trend is cautiously bullish, with technical indicators and moving averages aligned in favor of the bulls. However, the pair is constrained by the top of the consolidation range, implying increased volatility and requiring vigilant monitoring for breakout validation.
Key technical insights include AUDUSD currently testing the upper boundary of a daily rectangle consolidation pattern. A breakout here could unlock further bullish momentum. On the hourly chart, the golden cross and expanding MACD bars signal probable continuation of the short-term uptrend. The recent volume increase suggests greater market participation. No definitive candlestick reversal patterns have appeared recently, thus the market remains contested but cautiously optimistic.Today’s economic calendar highlights the Australian Private Sector Credit data release at 03:30 GMT+1, forecasted at 0.6% month-over-month, slightly below the previous 0.7%. A better-than-expected reading could reinforce AUD gains. Several Japanese data points also release early in the morning, but with marginal direct impact on AUDUSD. No significant US economic events are scheduled today, indicating limited influence on USD-related moves.
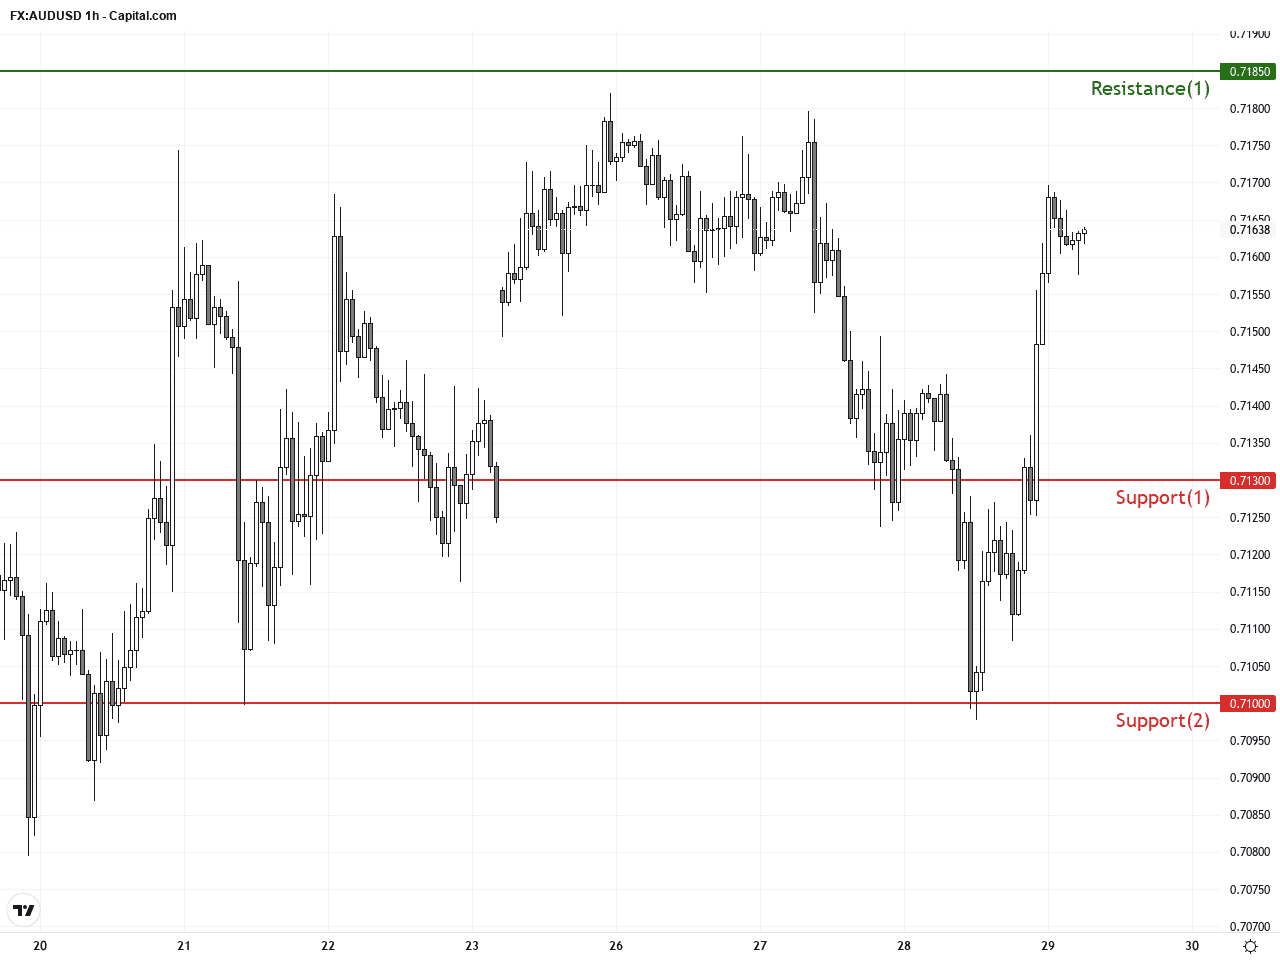
Resistance & Support
The above financial market data, quotes, charts, statistics, exchange rates, news, research, analysis, buy or sell ratings, financial education, and other information are for reference only. Before making any trades based on this information, you should consult independent professional advice to verify pricing data or obtain more detailed market information. 1uptick.com should not be regarded as soliciting any subscriber or visitor to execute any trade. You are solely responsible for all of your own trading decisions.