


 |
| Gold V.1.3.1 signal Telegram Channel (English) |
WTI Crude Oil: Key Support Faces Pressure Amid Dollar Surge and Short-Term Technical Pullback, June 6, 2026
2026-06-06 @ 21:25
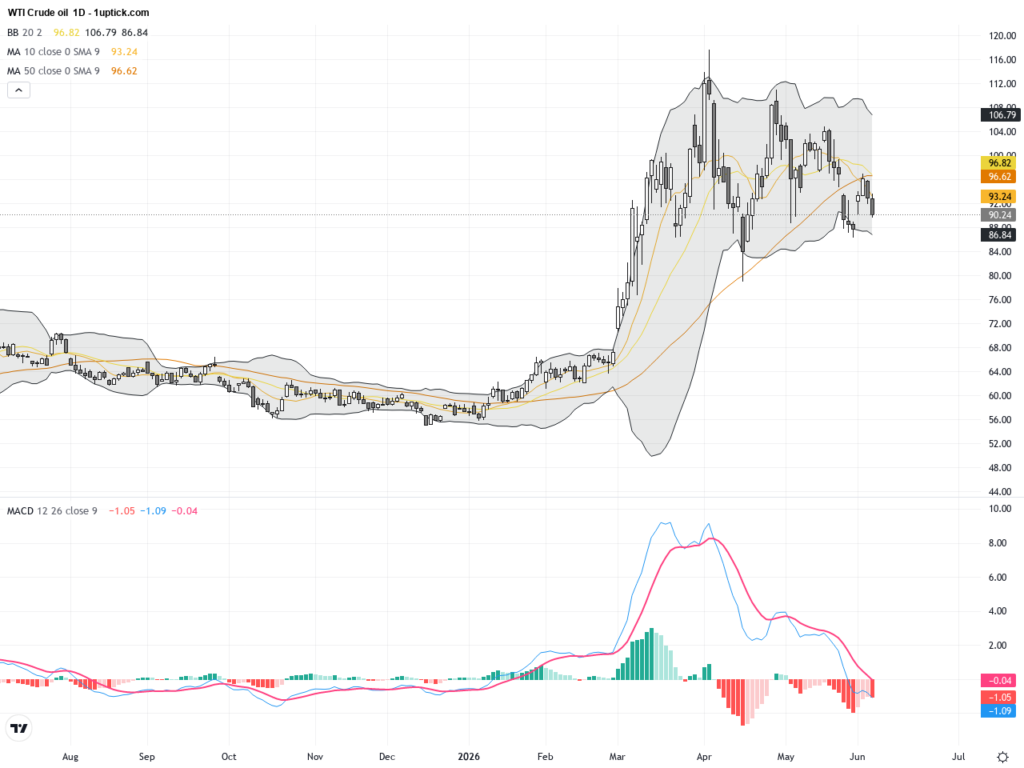
Over the past 24 to 48 hours, WTI crude oil prices have faced notable downward pressure, closing yesterday at $90.54 per barrel, down from $93.04 the day before, marking a drop of over 2.5%. This represents the lowest closing price in nearly a week, indicating a more cautious short-term market sentiment.
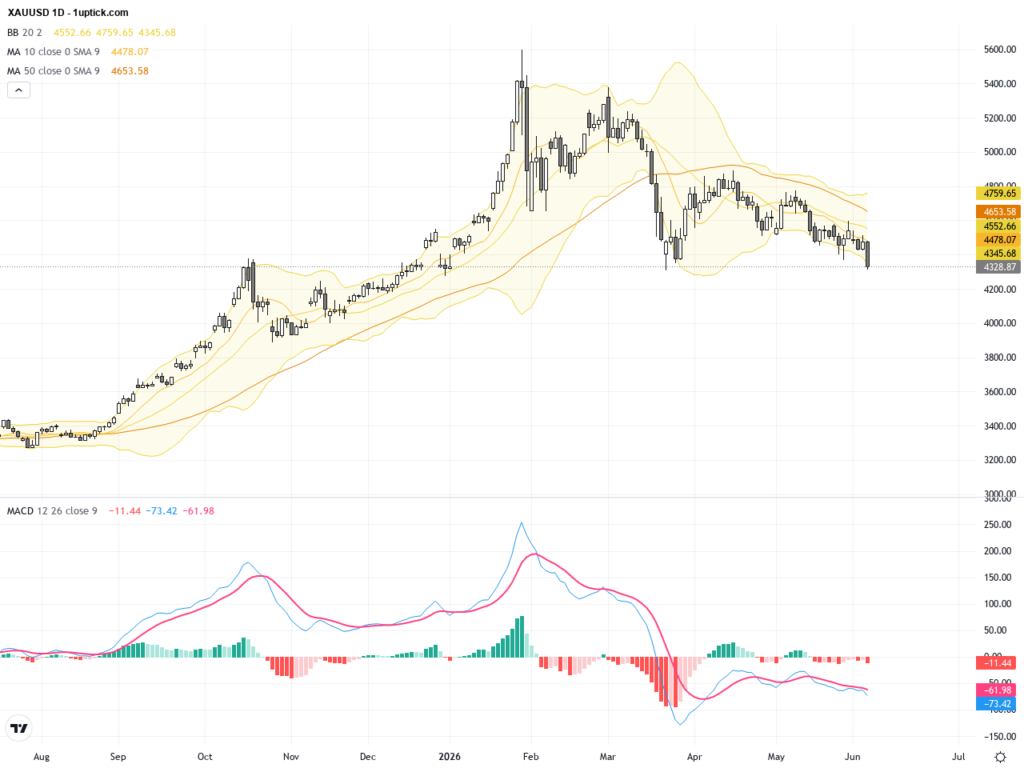
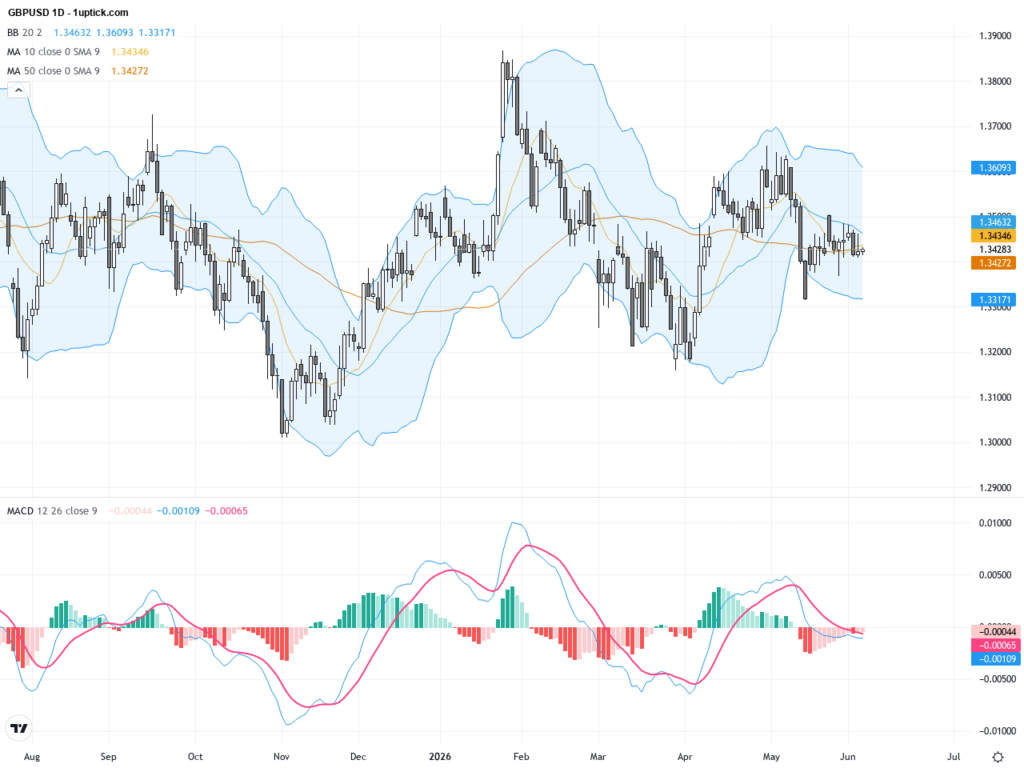
This price movement was mainly driven by several factors: first, tensions between the U.S. and Iran have eased somewhat, with the U.S. president expressing optimism about diplomatic progress between Israel and Lebanon, reducing geopolitical risk concerns in the Middle East and thus easing supply disruption fears. Second, the recent surge in the U.S. dollar has raised the cost of dollar-denominated crude, dampening demand. Despite U.S. crude inventories hitting their lowest level since 2004, market hopes for a peaceful resolution have lessened worries about supply shortages.
For the average investor, these price fluctuations highlight how current oil prices are being influenced by international political climate and currency policies simultaneously, leading to potential volatility in the short term. Investors should monitor geopolitical developments and dollar trends closely, as these will directly impact the direction of oil prices.

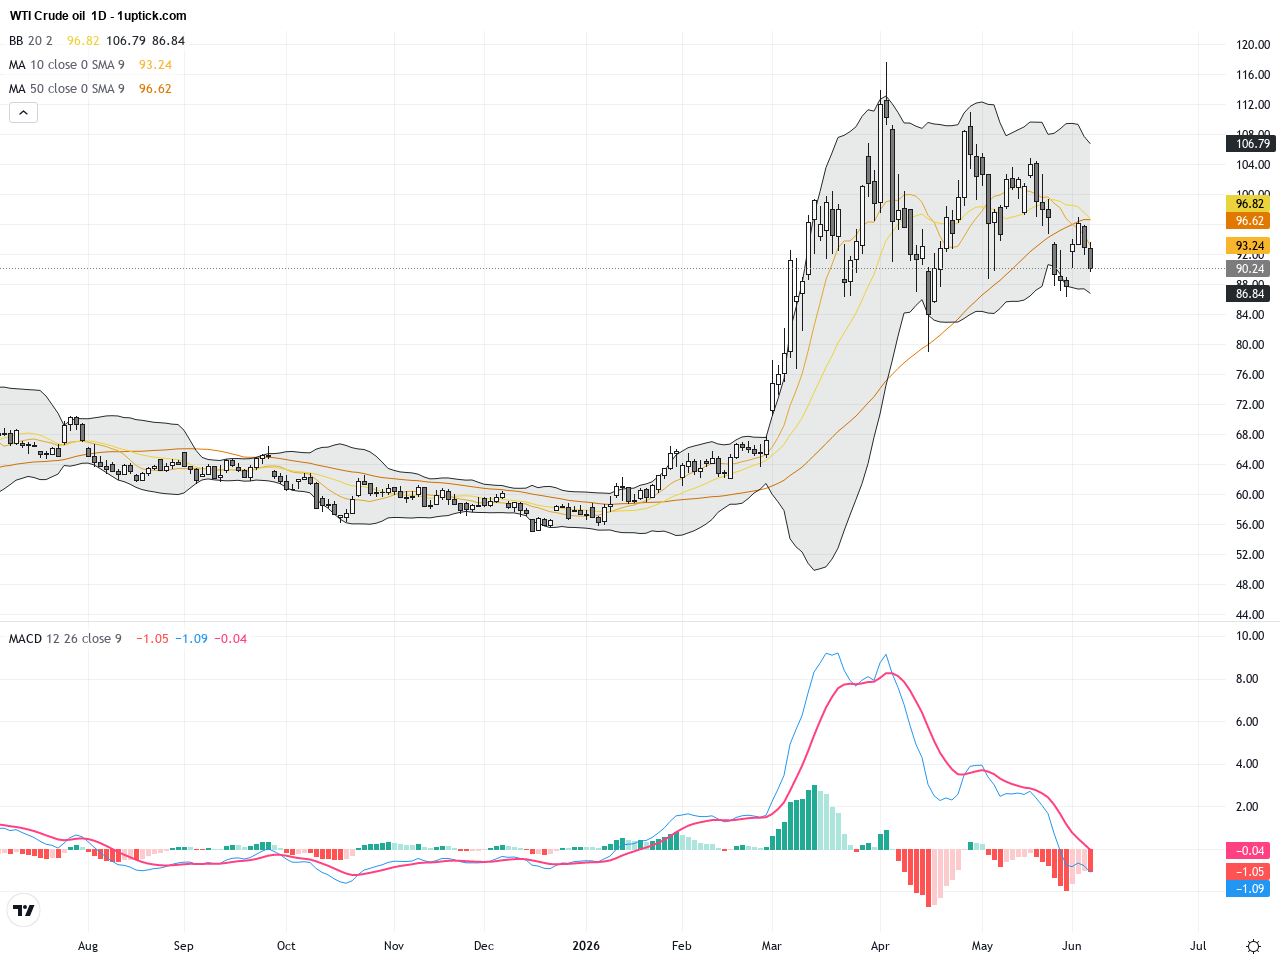
The daily chart of WTI Crude Oil reveals a clear high-level consolidation in recent weeks, retreating from a near 97-dollar peak. Price recently broke below key moving averages, including the 50-day MA, highlighting a cautious medium-term outlook. Bollinger Bands are narrowing with prices moving below the middle band, indicating decreasing volatility and increasing downside pressure. The MACD extends its negative divergence, signaling strengthening bearish momentum. Overall, the daily technical structure suggests that WTI is testing critical support levels, and failure to hold the $90 mark may trigger a deeper correction.

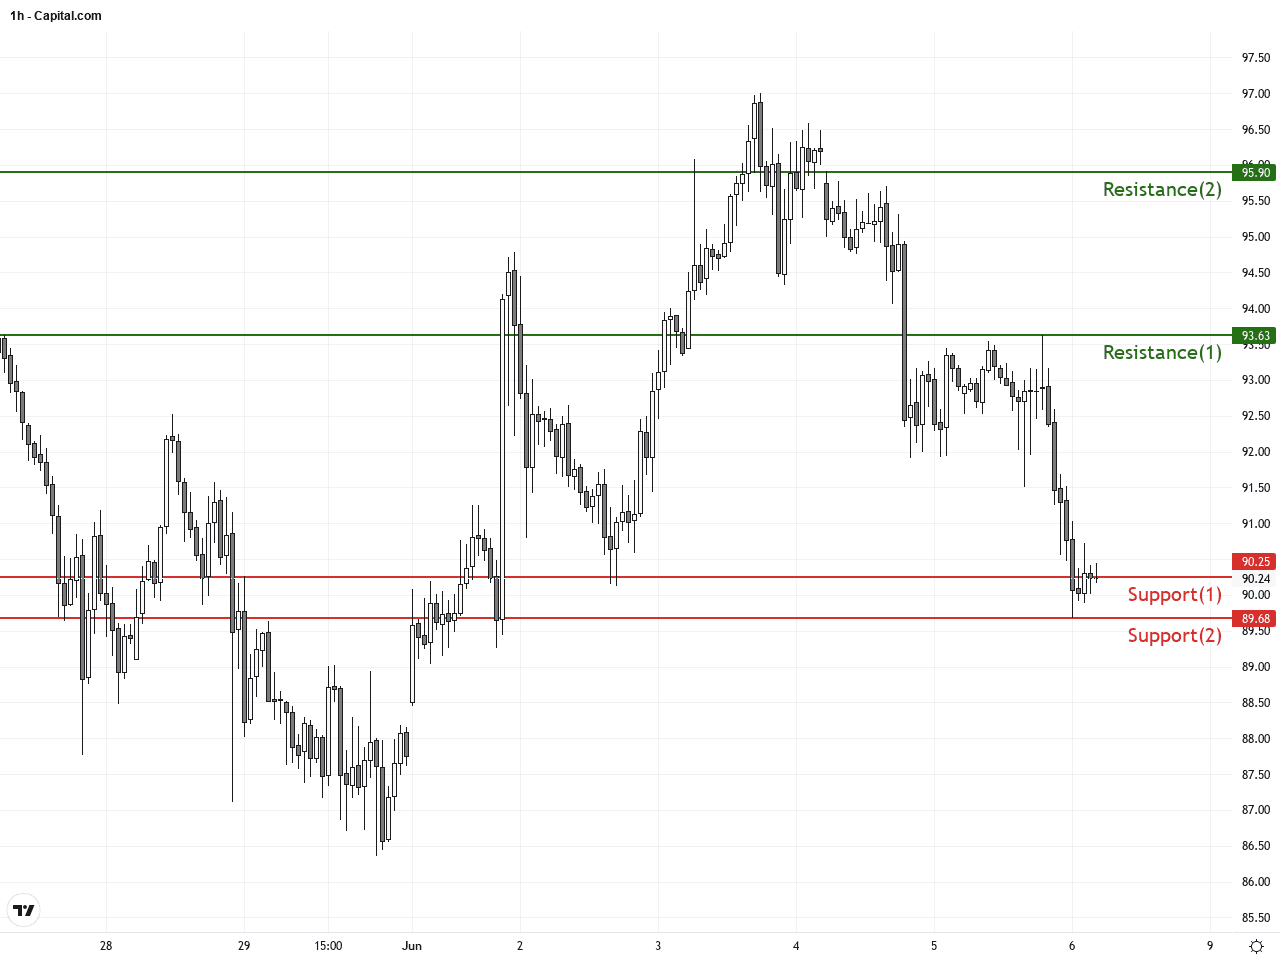
On the hourly chart covering the last 3-5 days, WTI Crude Oil demonstrates a pronounced downtrend. Price attempts to rebound have been capped at the 20-hour moving average and the Bollinger middle band, revealing weak short-term bullish momentum. A downward flag pattern formed over the past three days suggests a potential continuation of the drop upon a breakdown below the pattern’s lower boundary. The MACD shows a bearish crossover while RSI approaches oversold territory, indicating immediate selling pressure remains but ripe conditions for a technical bounce may emerge.
Technical Trend: WTI Crude Oil is currently in a ‘cautiously bearish’ trend mode, with increasing short-term correction pressure and medium-term trend awaiting support confirmation.
WTI Crude Oil’s recent price weakness is primarily driven by a combination of a strong US dollar and more optimistic US-Iran diplomatic progress, dampening risk sentiment. Technically, the daily break below the 50-day moving average and Bollinger middle band suggests medium-term bearish bias. Short-term, the formation of a downward flag and bearish MACD crossover warn of further downside potential. Recent strong bearish candlesticks reinforce selling pressure. Traders should watch the $90 support closely to gauge if the market can stabilize or is poised for a deeper decline.There are no major economic data releases or events today directly impacting WTI Crude Oil. Traders should continue monitoring US dollar trends and geopolitical developments, especially any updates on US-Iran relations, as these remain primary drivers of oil price volatility in the near term.
Resistance & Support
Run Live WTI Crude Oil Analysis
The above financial market data, quotes, charts, statistics, exchange rates, news, research, analysis, buy or sell ratings, financial education, and other information are for reference only. Before making any trades based on this information, you should consult independent professional advice to verify pricing data or obtain more detailed market information. 1uptick.com should not be regarded as soliciting any subscriber or visitor to execute any trade. You are solely responsible for all of your own trading decisions.