







 |
| Gold V.1.3.1 signal Telegram Channel (English) |

WTI Crude Oil: US-Iran Deal Sparks Sharp Drop to Three-Month Lows Amid Hormuz Strait Reopening, June 16, 2026
2026-06-16 @ 06:03
Over the past 24 to 48 hours, WTI Crude oil prices have experienced a significant decline, falling noticeably from yesterday’s closing price of $80.75, reflecting clear volatility and downward momentum. The primary catalyst behind this drop is the recent US-Iran 60-day ceasefire deal, which includes reopening the crucial Strait of Hormuz, easing Middle East geopolitical tensions and positively impacting global oil supply expectations.
This development triggered a strong market reaction, with many investors interpreting it as a reduction in global oil market risk. Following the announcement, oil prices slid to a three-month low, while tech stocks and global equities surged, illustrating a shift towards greater risk appetite. Specifically, oil futures dropped nearly 5% in direct response to the news, underscoring the market’s immediate reassessment of supply risk.
For the average investor, this means the recent dip in oil prices is not due to weakening demand but rather the easing of geopolitical risks, which expands supply outlooks. Lower crude prices could exert downward pressure on energy costs in the short term, potentially influencing gasoline and diesel prices—though local fuel price changes often lag behind global moves. Overall, market sentiment has improved markedly, but investors should watch closely for ongoing developments in the region since full reopening of the Strait of Hormuz faces logistical hurdles and may take time to normalize supply flows.

The daily chart shows a clear downtrend in WTI Crude Oil since mid-May highs. Recent price action has broken below key moving averages, including the 20-day and 50-day MA, while approaching the lower Bollinger Band — signaling strong bearish momentum. The MACD has crossed down twice reinforcing the bearish narrative. However, prices are nearing a significant March low support which may offer short-term stabilization. Traders should monitor how this support holds against further selling pressure.

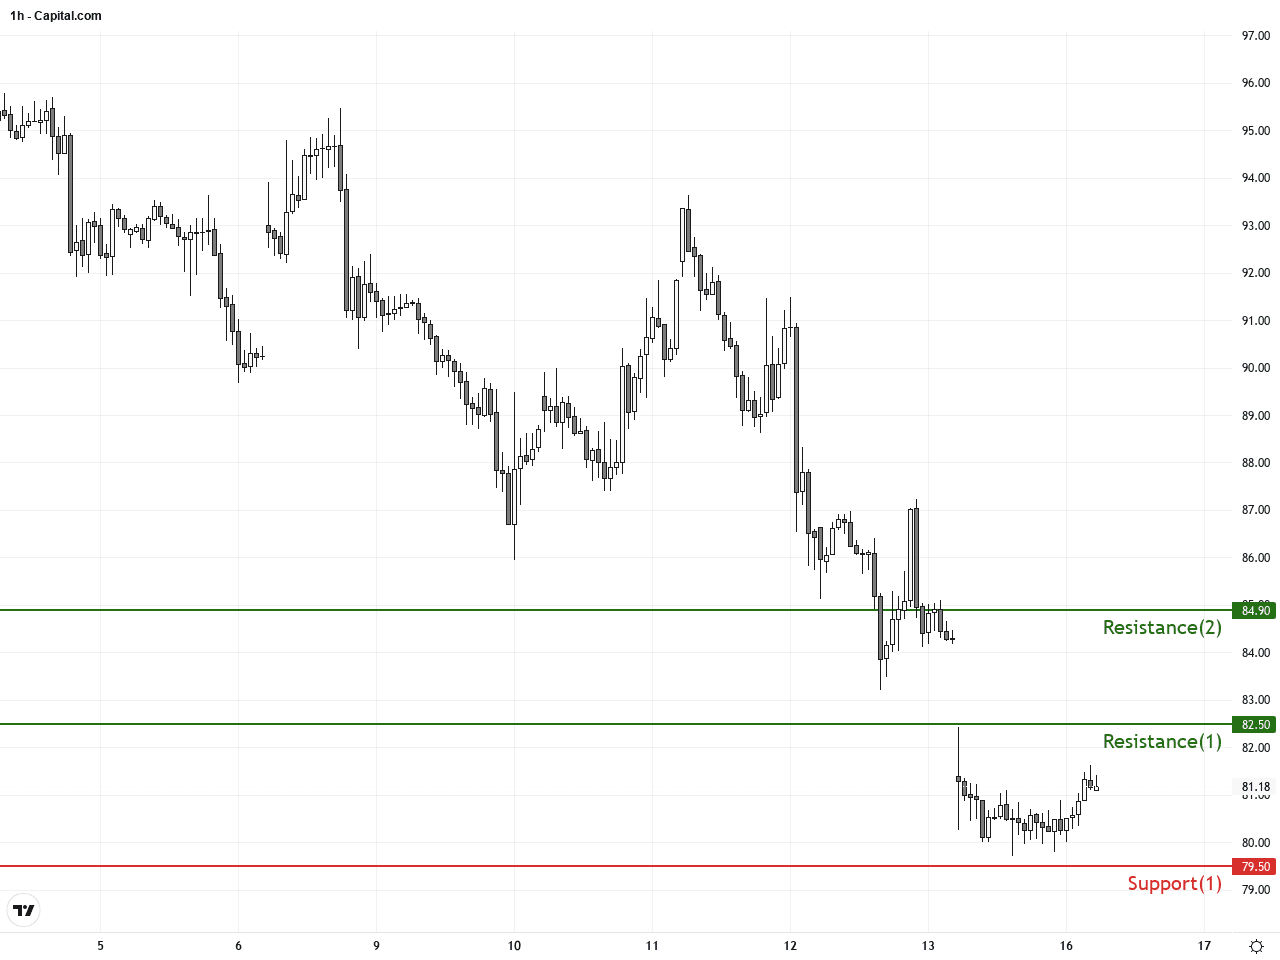
The hourly chart over the past 3-5 days reveals a choppy downward pattern with several minor rebounds capped by resistance zones. The 20-period moving average remains descending and Bollinger Bands are widening, indicating increased volatility. While the MACD histogram shows signs of contraction, it remains negative, suggesting sustained bearish momentum. A recent bearish engulfing candlestick hints at potential continuation of downward moves in the next 24 hours.
Technical Trend: Cautiously Bearish
Technically, WTI Crude Oil remains bearish with MACD death crosses and multiple moving averages broken, indicating strong selling pressure. Traders must watch whether price breaks below the March low support to confirm deeper corrective phases. Hourly bearish engulfing signals put near-term downside risk on alert. Given the geopolitical underpinnings from the US-Iran deal, volatility and uncertainty are likely to persist — caution with long positions is advised.There are no significant or directly relevant economic events scheduled today impacting WTI Crude Oil. Market attention remains fixed on geopolitical developments in the Middle East and progress in US-Iran negotiations. Traders should watch for any breaking news from the region which could swiftly affect oil supply risk premium and prices.
Resistance & Support
Run Live WTI Crude Oil Analysis
The above financial market data, quotes, charts, statistics, exchange rates, news, research, analysis, buy or sell ratings, financial education, and other information are for reference only. Before making any trades based on this information, you should consult independent professional advice to verify pricing data or obtain more detailed market information. 1uptick.com should not be regarded as soliciting any subscriber or visitor to execute any trade. You are solely responsible for all of your own trading decisions.