








 |
| Gold V.1.3.1 signal Telegram Channel (English) |
USDJPY: Key Technical Resistance at 158.55 Signals Potential Near-Term Volatility, August 10, 2026
2026-08-10 @ 11:01
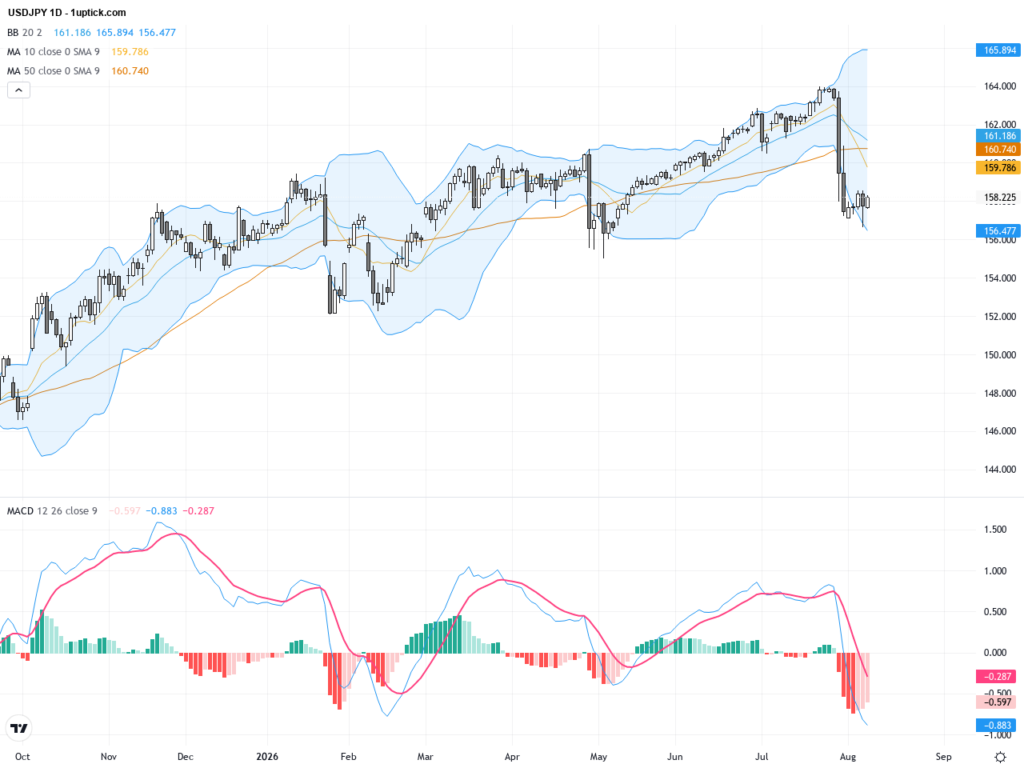
Over the past 24 to 48 hours, USD/JPY has experienced notable price movements amidst heightened volatility. Yesterday’s closing price was 158.227, with trading ranging between 157.578 and 158.315 recently. The US dollar index slid this week as market doubts over the Federal Reserve’s rate hike outlook put pressure on the dollar, driving the USD/JPY lower.
Recent market news highlights that US July nonfarm payrolls unexpectedly declined, intensifying concerns over US economic growth prospects and pushing the dollar index to a seven-week low. Meanwhile, gold prices rallied on safe-haven demand. The dollar’s weakness, triggered by fears of a pause or slowdown in Fed hikes, contrasts with the Japanese yen’s recent but limited support from coordinated US-Japan interventions. USD/JPY is losing momentum near the key 158.55 resistance level, reflecting market caution ahead of critical economic data release.
For the average investor, the recent price action resembles a market test of US economic health. The negative surprise from employment figures made the dollar stumble, much like a company posting disappointing earnings that drags its stock price down. Heightened uncertainty about future interest rates has increased selling pressure on USD/JPY, further influenced by sensitivities to geopolitical risks and central bank interventions. Overall, recent USD/JPY volatility underscores the need to closely monitor upcoming economic data and policy signals.
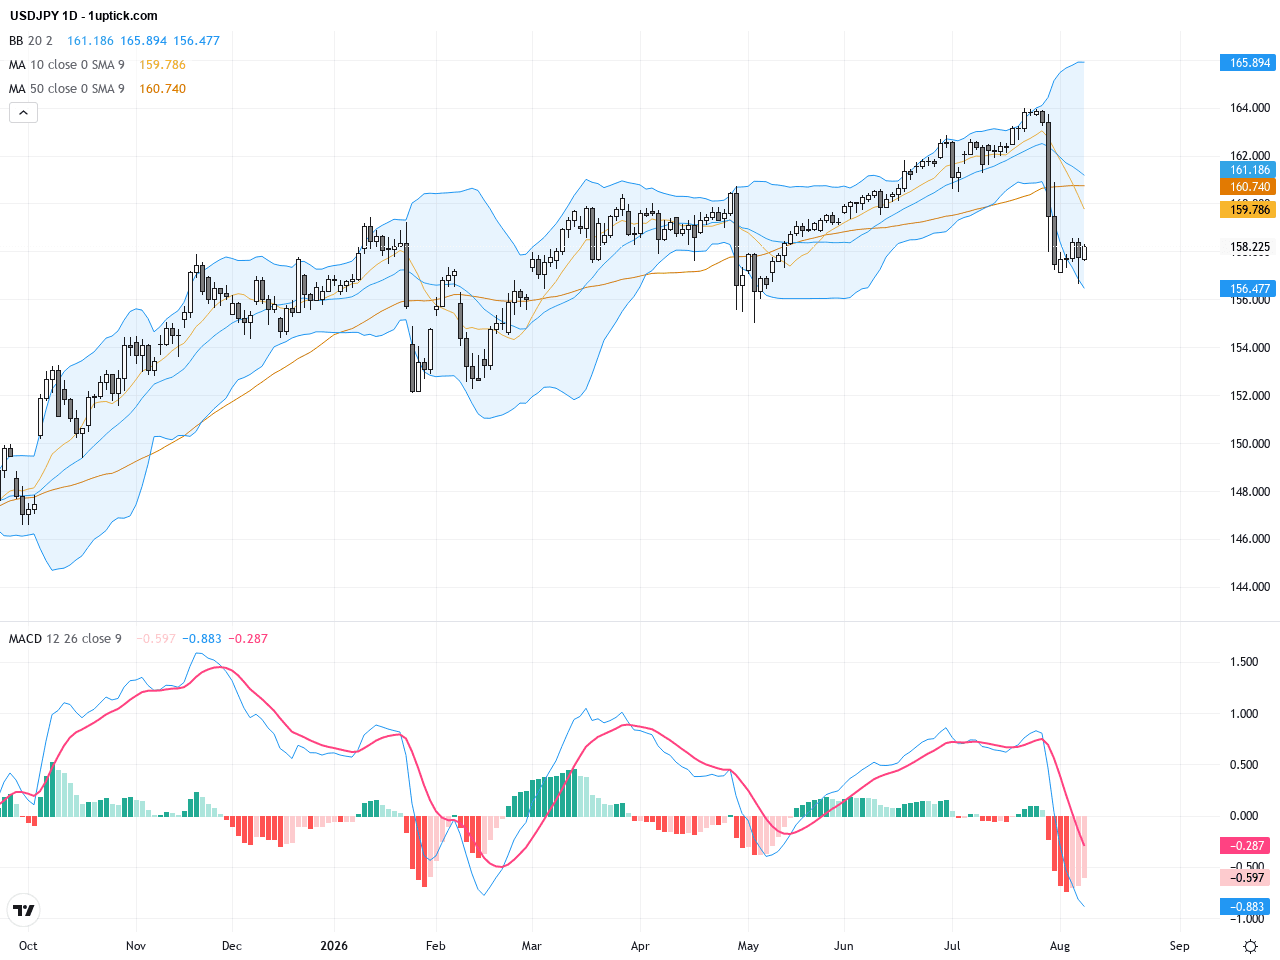
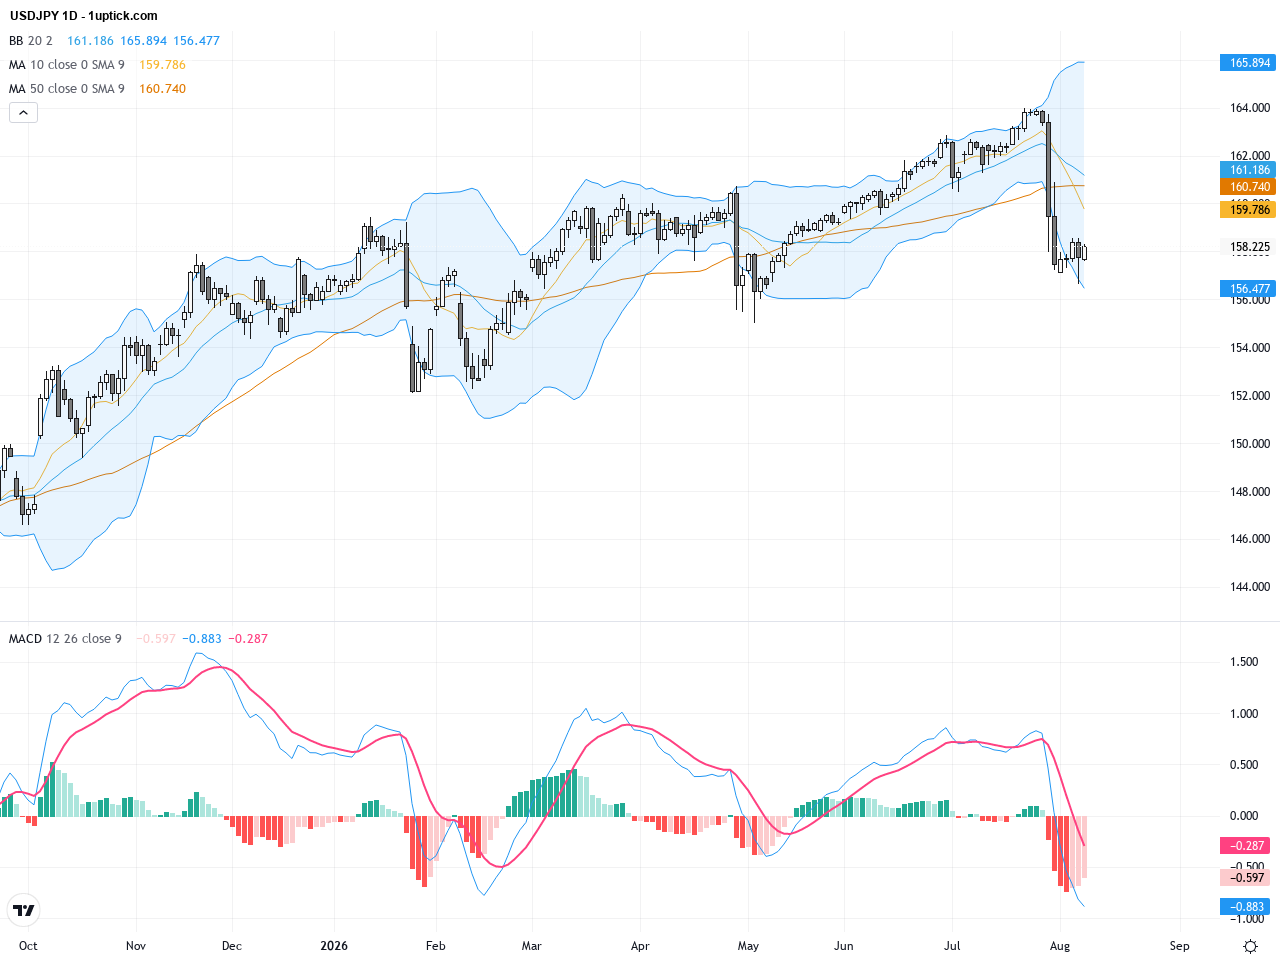
The daily chart shows USDJPY trading with a slightly bullish bias but with slowing momentum. The pair has repeatedly tested the resistance zone around 158 to 158.5. Bollinger Bands are contracting, indicating reduced volatility. The 200-day moving average at 158.03 serves as an important support level. The MACD is near the zero line, signaling balance between bulls and bears. Overall, the daily trend suggests consolidation with a mild upward tilt, awaiting a decisively directional breakout.
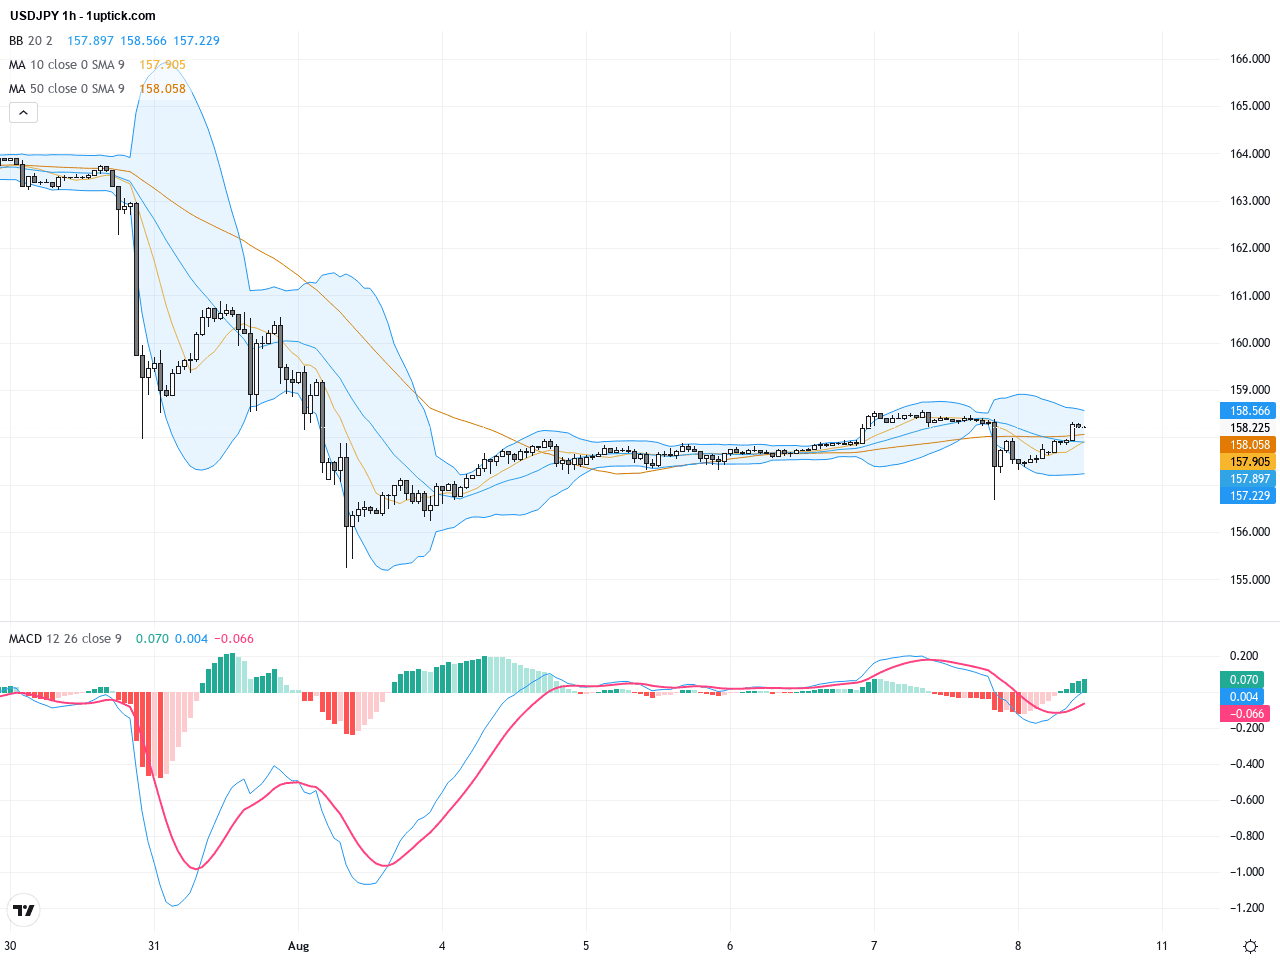
The hourly chart highlights USDJPY meeting resistance near 158.55 over the last 3-5 days and pulling back, signaling a potential short-term top. Recent candlesticks include small bearish bodies and doji patterns, reflecting indecision. The MACD displays a bearish crossover, and RSI has declined from overbought territory, pointing towards weakening bullish momentum. Bollinger Bands have contracted with price near the middle band, indicating possible continued range-bound trading or a minor correction short-term.
Technical Trend: The short-term trend is cautiously sideways with a mild bullish bias but notable risk of pullback.
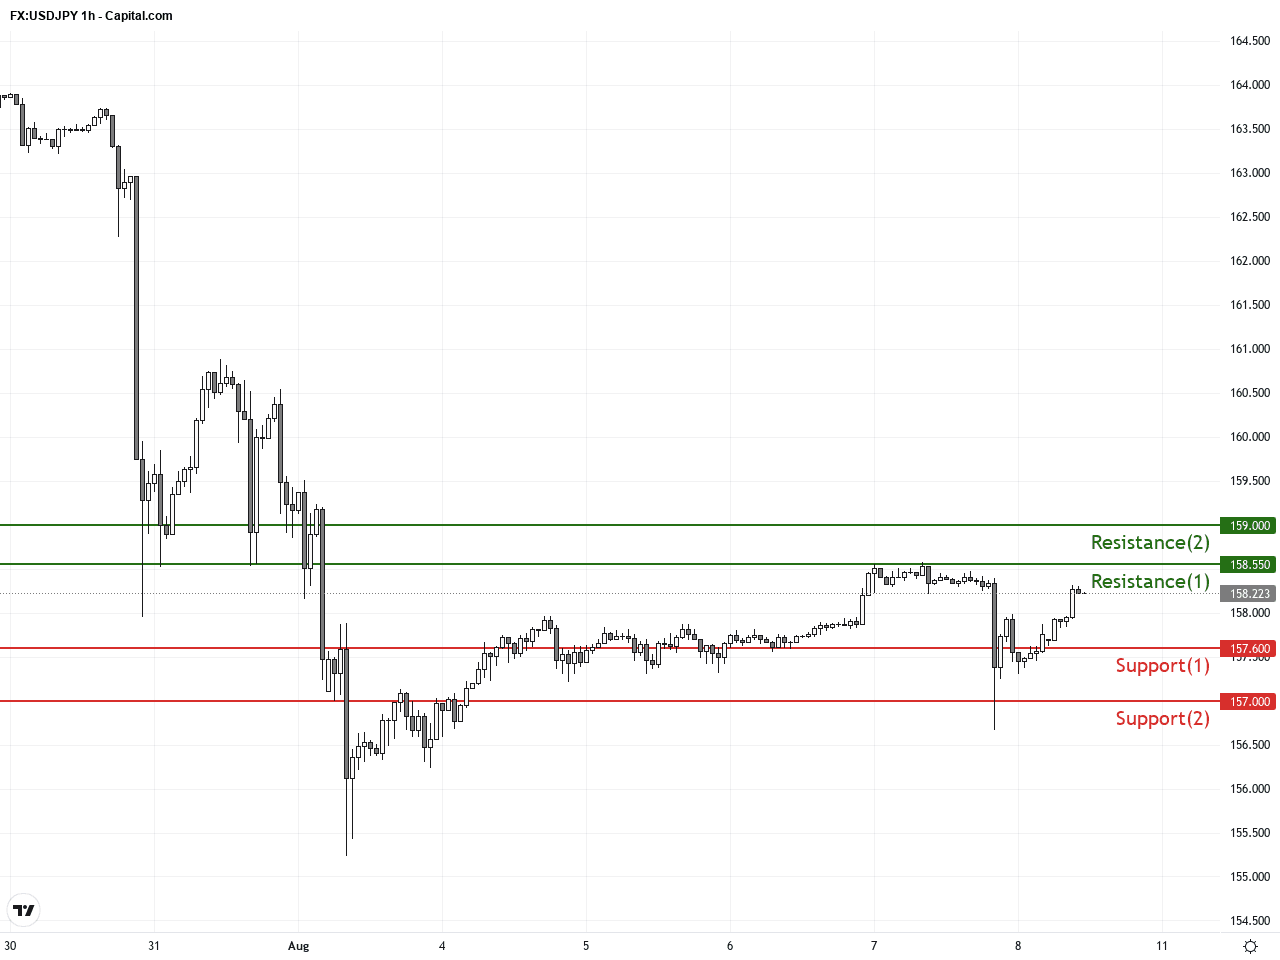
The critical technical insight for USDJPY is the formation of a near-term top around the key resistance at 158.55. The MACD bearish crossover and RSI decline indicate waning upwards momentum. On the daily timeframe, the 200-day MA acts as a significant dividing line between bulls and bears. A break below this level would likely trigger a corrective pullback. Traders should monitor key price reactions closely for high-probability short-term trading setups.At 01:50 Japan time today, the Japanese June seasonally adjusted current account figures will be released. Other key data include China’s July new loans and money supply numbers, which are not expected to directly impact USDJPY intraday. Therefore, USDJPY’s price action today is likely to be driven primarily by technical factors and upcoming US data rather than significant Japan-specific events.
Resistance & Support
The above financial market data, quotes, charts, statistics, exchange rates, news, research, analysis, buy or sell ratings, financial education, and other information are for reference only. Before making any trades based on this information, you should consult independent professional advice to verify pricing data or obtain more detailed market information. 1uptick.com should not be regarded as soliciting any subscriber or visitor to execute any trade. You are solely responsible for all of your own trading decisions.