








 |
| Gold V.1.3.1 signal Telegram Channel (English) |
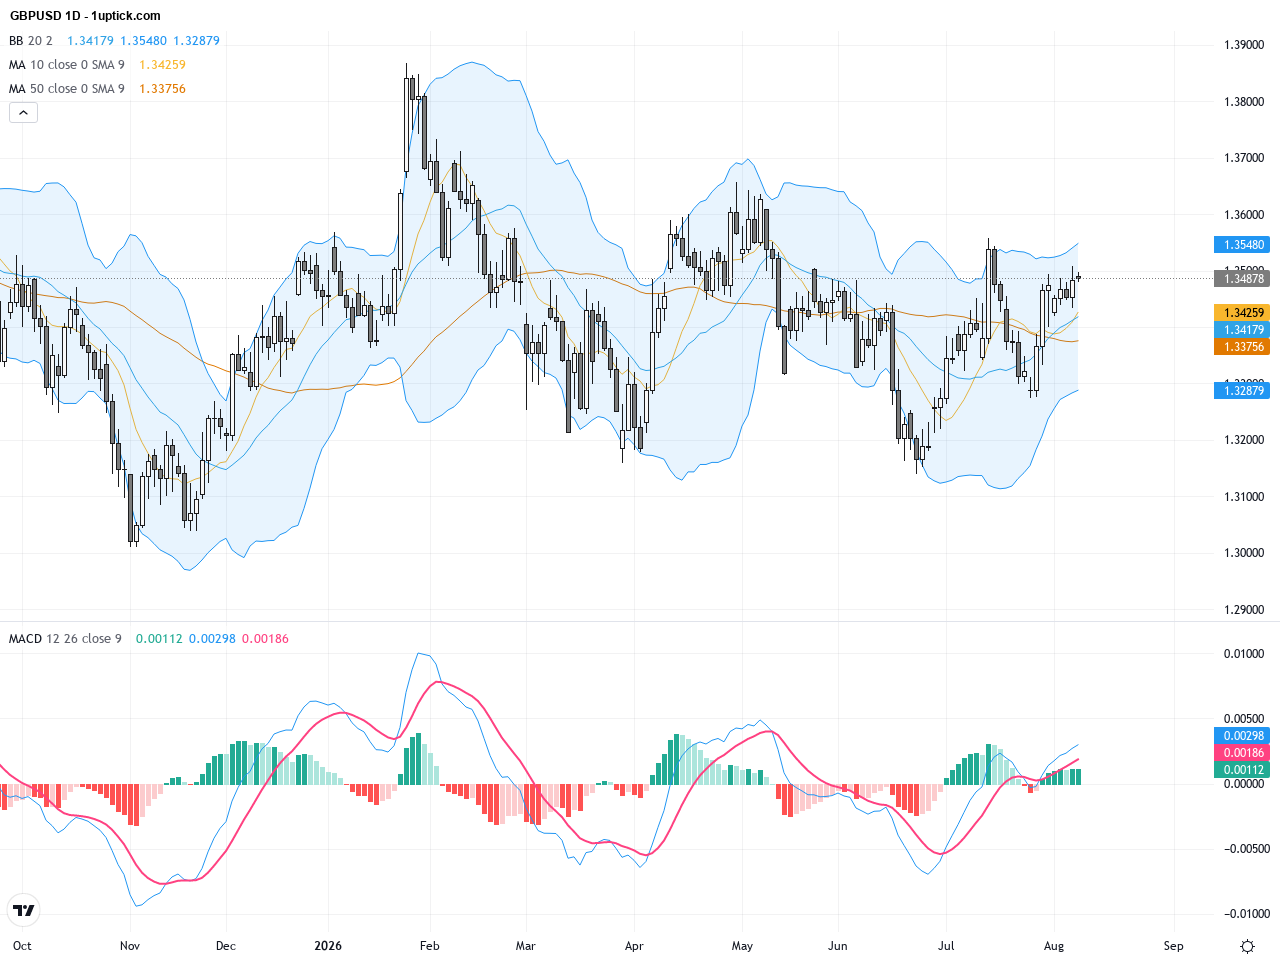
GBPUSD: Breakout Above Key Resistance Signals Bullish Trading Outlook, August 10, 2026
2026-08-10 @ 13:01
Over the past 24 to 48 hours, the GBP/USD currency pair experienced noticeable volatility in the forex market. The pair closed yesterday at 1.34879, slightly down from the opening price of 1.34904, reflecting a tug-of-war between buyers and sellers during the trading session. The weakening of the US dollar was one of the key drivers supporting the pound, especially after the US nonfarm payroll data came in significantly below expectations, placing downward pressure on the dollar.
Recent market news highlights that weaker US labor figures have weighed on the dollar, simultaneously boosting USD-denominated currencies including GBP/USD. Furthermore, the UK services sector is showing signs of recovery and the pound is considered cheap based on long-run valuation metrics, which has attracted renewed investor interest in the sterling. Easing US-Iran tensions have also reduced safe-haven demand, further supporting the pound.
For the average investor, the GBP/USD price movement over the last couple of days can be seen as a reaction to disappointing US economic data leading to a short-term dollar slowdown, thereby increasing the pound’s appeal. Despite some fundamental weaknesses in the UK economy, the current price level reflects strong support amid dollar softness. Investors should watch upcoming US employment reports closely as they will likely continue to influence the direction of GBP/USD in the near term.
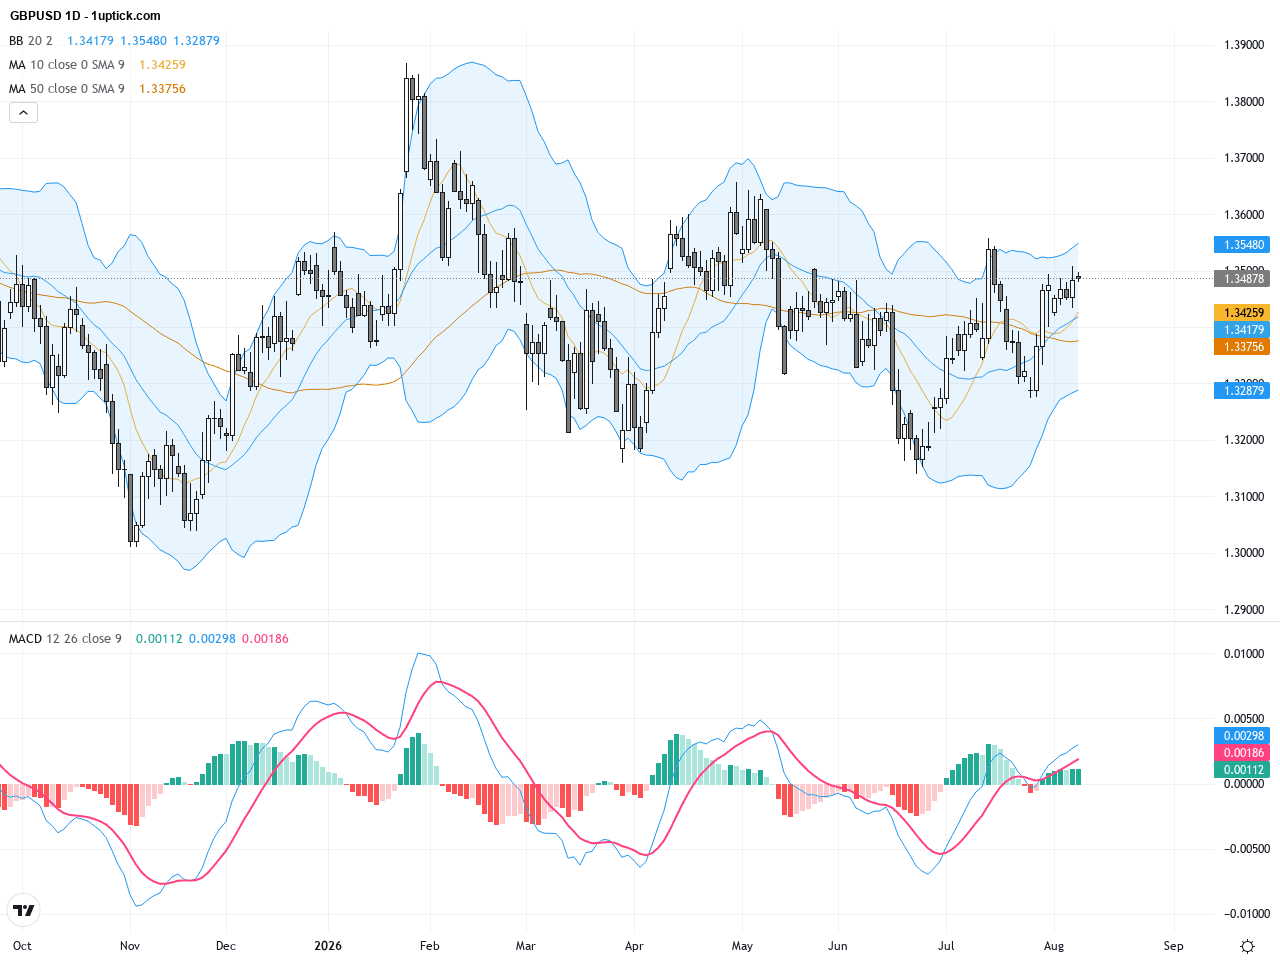
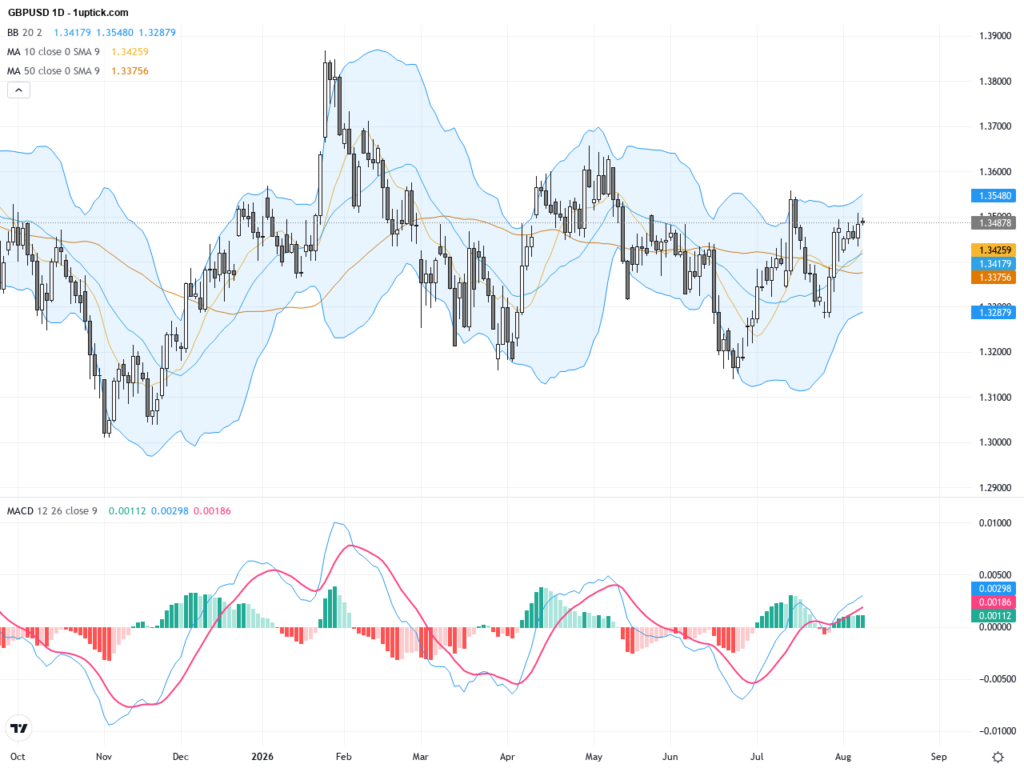
The daily chart shows GBPUSD maintaining a consistent uptrend over recent weeks, with prices holding firmly above both the 50-day and 200-day moving averages, indicating strong medium to long-term bullish momentum. The pair recently broke through the 1.345 resistance and continued higher, with Bollinger Bands widening to indicate higher volatility. The MACD remains in a bullish crossover, reinforcing the upward trend seen on the daily timeframe.
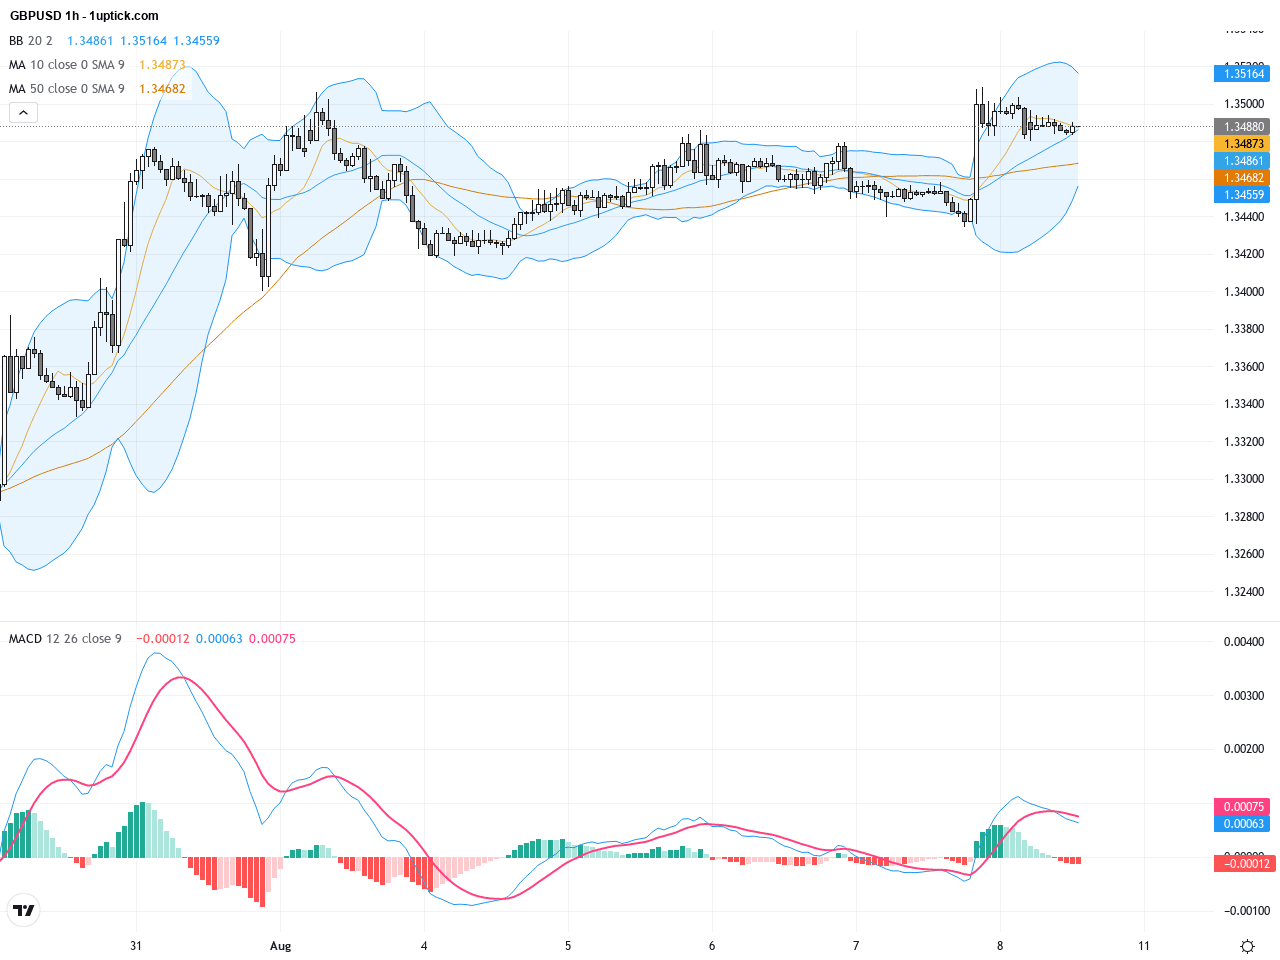
The hourly chart over the last 3 to 5 days reveals heightened volatility around the 20-day moving average, forming an ascending flag pattern that suggests consolidation within an overall uptrend. A recent bullish engulfing candlestick pattern signals potential continuation of the upward move in the next 24 hours. The MACD crossover and rising volume on the hourly scale further support the prospects for a short-term rally.
Technical Trend: GBPUSD is currently in a clearly bullish trend, described as decisively bullish with a steady short-term upward trajectory.
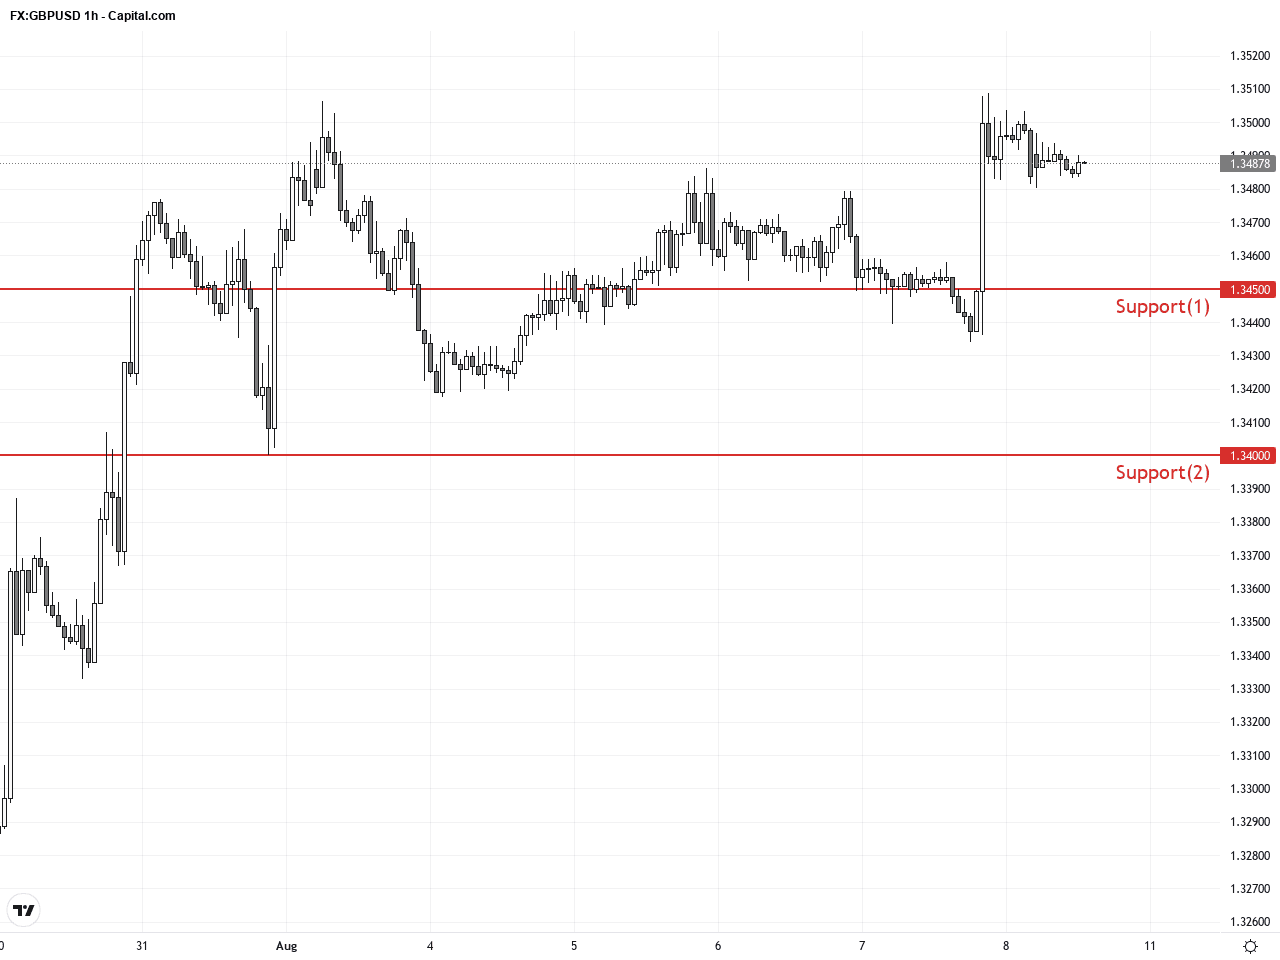
Technically, GBPUSD is at a crucial breakout point, with daily close prices staying above key moving averages which strengthens bullish conviction. The hourly bullish engulfing candlestick along with a MACD crossover further indicates short-term upside momentum. Traders should monitor key support levels for potential pullbacks, as a break below the 20-day moving average could signal a short-term correction.Today’s economic calendar does not feature any major events directly impacting GBPUSD. While China’s new loans and M2 money supply data and Japan’s current account figures are scheduled, these hold minor relevance. Traders should instead watch for upcoming US labor market and UK service sector updates for more direct impact on GBPUSD price action.
Resistance & Support
The above financial market data, quotes, charts, statistics, exchange rates, news, research, analysis, buy or sell ratings, financial education, and other information are for reference only. Before making any trades based on this information, you should consult independent professional advice to verify pricing data or obtain more detailed market information. 1uptick.com should not be regarded as soliciting any subscriber or visitor to execute any trade. You are solely responsible for all of your own trading decisions.