Category: Technical Analysis

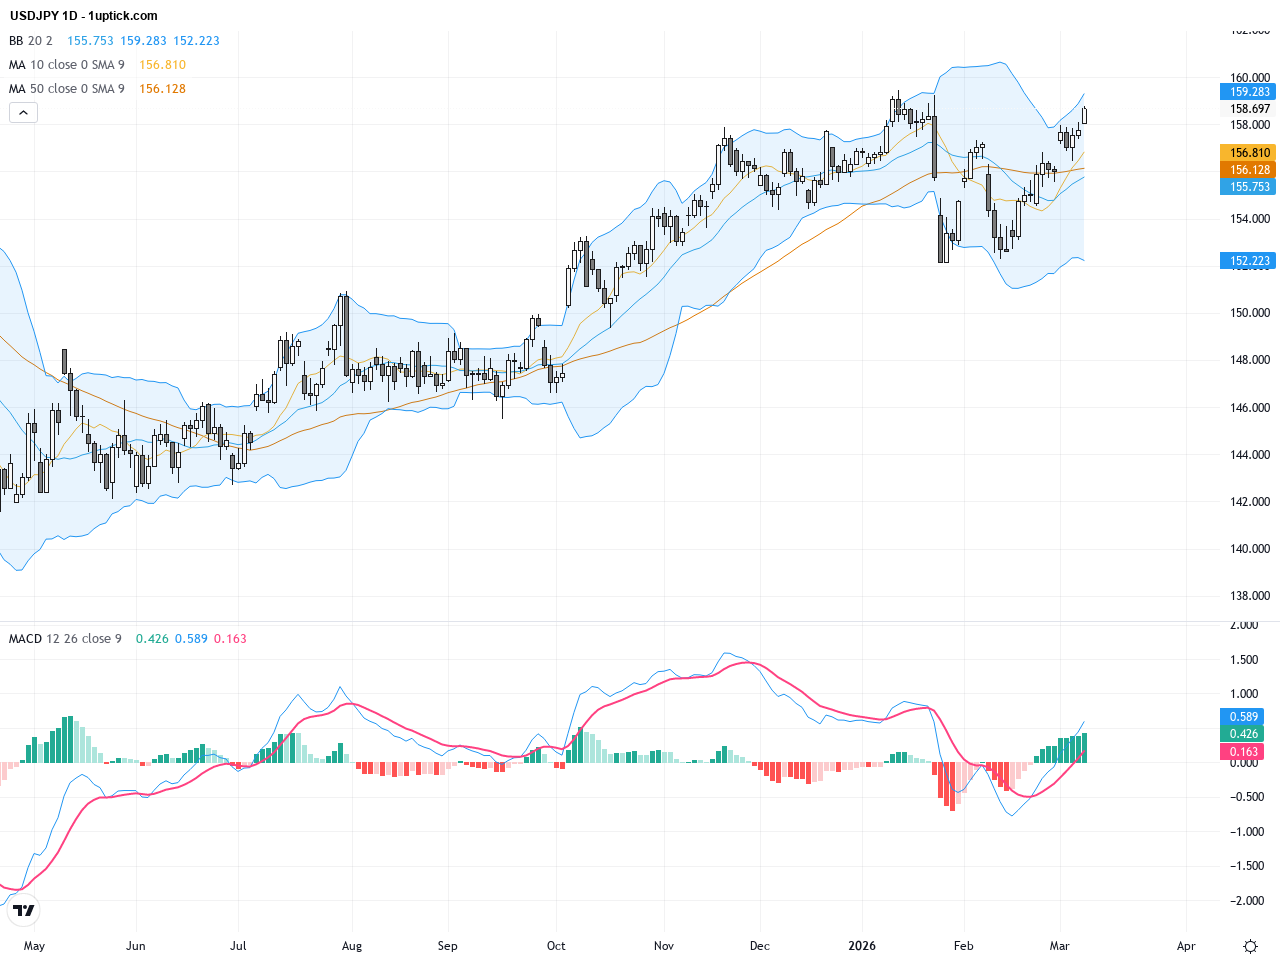
USDJPY: Key 158 Level Holds Amid Risk of Short-Term Technical Reversal

USDJPY has been consolidating around the 158 level amidst mixed influences from easing Middle East conflict and a weakening US dollar. Over the past three trading days, despite downward pressure on the dollar linked to hopes for de-escalation in Iran, safe-haven demand for the Japanese yen has kept USDJPY stable near 158.28. Investor sentiment remains highly uncertain amid geopolitical tensions and global trade concerns. This week’s conditions suggest heightened short-term volatility; traders should carefully monitor support and resistance levels and keep an eye on major economic releases that could sway the pair’s momentum further.

EURUSD Surges on Geopolitical Ease: Technical Patterns Signal Potential Rebound Momentum

EURUSD has experienced notable volatility over the past three trading days, rallying more than 150 pips as geopolitical tensions eased, with the price currently hovering around 1.18289. Despite the US dollar’s strength supported by robust economic data, the euro is under pressure due to cooling inflation in the Eurozone and a critical test of the 1.1578 support level. For investors, this scenario reflects a short-term correction amid political relief and economic divergence between the US and Europe, suggesting key technical levels will dictate near-term price action. Upcoming US CPI data and ECB signals will be pivotal, framing the trading outlook for EURUSD in the days ahead.

AUDUSD: Multi-Year High Breakout at 0.7168 Signals Strong Trading Outlook

Over the past three trading days, AUDUSD has displayed strong bullish momentum, breaking through the multi-year high of 0.7168 and closing yesterday at 0.71164. The market is heavily influenced by the hawkish stance of the Reserve Bank of Australia (RBA) and a widening interest rate differential against the U.S. dollar, alongside mixed geopolitical risk aversion dynamics. Recent news highlights a bullish base forming at the 20-day moving average, pointing toward potential targets at 0.7200 and beyond. For everyday investors, it’s like a stock rally pushing through key resistance levels, signaling increased risk appetite but with caution needed below 0.7100 level that could trigger a pullback. Overall, the AUDUSD trading atmosphere is optimistic but warrants close monitoring of upcoming economic data and geopolitical events.

USDCAD: Oil Surge Pressures USD as Technical Patterns Signal Bearish Momentum

Over the past three trading days, USDCAD has experienced a steady decline from a recent high near 1.3660, closing yesterday at 1.35894. A sharp rise in oil prices above the $100 mark has strengthened the Canadian dollar, putting downward pressure on the pair. Additionally, weaker-than-expected U.S. employment data weighed on the U.S. dollar, further supporting the Loonie. The market’s mood this week is influenced by shifts in risk appetite and supply concerns in the energy market, key drivers of USDCAD volatility. For investors, this means a diminishing appeal of the U.S. dollar against the Canadian dollar in the near term, with oil prices and U.S economic data remaining critical to watch in shaping the trading outlook.

WTI Crude Oil: Sharp Pullback After Geopolitical Optimism Signals Key Support Levels Ahead

WTI Crude Oil has experienced significant volatility over the past three trading days. After surging to nearly $120 on March 8th, prices plunged to close at $85.08 on March 9th. This dramatic reversal was driven by former President Trump’s remarks suggesting the Iran war is “very complete,” easing geopolitical risk fears. For the average investor, this signals a market shift from panic-driven buying to cautious reevaluation. Our analysis delves into the current trading outlook, key technical patterns, and resistance/support levels to help traders navigate this volatile environment and identify potential rebound opportunities.

XAUUSD Gold: Key Support Testing Amid Technical Rebound and Trading Outlook

Over the past three trading days, XAUUSD displayed significant volatility, closing near 5137.91 yesterday with a clear pullback pattern. Gold’s price action has been influenced by multiple factors including oil prices hitting multi-year highs and a stronger US dollar applying downward pressure. The geopolitical tension in the Strait of Hormuz has pushed oil higher, reducing gold’s bullish momentum. For the average investor, this means gold’s role as a safe haven is currently weighing global energy risks against the strengthening USD and rising interest rate concerns, likely resulting in short-term consolidation. Moving forward, gold’s price direction will hinge on the USD trend and global energy market developments, warranting cautious observation of technical patterns alongside relevant news flow.

GBPUSD: Key Support Tested Amidst Weakening Momentum – Trading Outlook and Technical Patterns

GBPUSD has displayed significant volatility over the past three trading days, declining from roughly 1.34 to a close yesterday at 1.32977, a loss of nearly 0.8%. The market mood is largely influenced by a strengthening US dollar due to heightened Middle East tensions driving safe-haven demand. Weak UK economic data, coupled with rising expectations for interest rate cuts and ongoing political uncertainty, have further pressured the pound. These factors combined have negated initial GBPUSD rallies, highlighting critical support and resistance levels that traders should monitor. The current environment demands tactical caution as the pair navigates key technical zones, affecting short-term trading outlook and decision making.

USDJPY Breaks Key Resistance at 158 amid Geopolitical and Interest Rate Drivers

Over the past three trading sessions, USDJPY extended its winning streak, climbing close to 158.60 and reaching a closing price of 158.699 yesterday, marking a rise of over 0.6%. Market sentiment this week was largely influenced by escalating Middle East geopolitical tensions which boosted safe-haven demand for the US dollar, alongside widening US-Japan interest rate differentials. Japan’s appeal for US tariff exemptions added pressure on the yen. These factors collectively reinforce a bullish outlook on USDJPY. For average investors, this means the dollar could continue strengthening as risk aversion rises, while the yen gets sold off. Monitoring global geopolitical updates and monetary policy shifts will be key to capitalize on upcoming trading opportunities.

EURUSD Technical & Fundamental Analysis: Critical 1.1578 Support Faces Key Test

Over the past three trading days, EURUSD has fallen sharply from the psychological 1.1600 level to yesterday’s close at 1.15172, driven by a stronger US dollar amid geopolitical tensions in the Middle East and rising energy prices in Europe. These factors triggered risk-off sentiment, boosting the dollar while weighing heavily on the euro. Furthermore, divergences between Federal Reserve and ECB monetary policies have amplified volatility. This confluence of events has positioned the key 1.1578 support level as a pivotal battleground for EURUSD. For the average investor, this week’s market mood reflects euro facing multifaceted pressures, while the US dollar displays resilient defense. Whether the pair holds this technical level will shape the near-term directional bias.

AUDUSD: Bullish Momentum Gathers Near Key 20-Day Moving Average Support

AUDUSD exhibited notable volatility over the past three trading days, closing yesterday at 0.69855, down approximately 0.29%. Despite solid Australian domestic economic data, escalating Middle East geopolitical tensions have injected uncertainty into the market, causing price fluctuations. Although options markets indicate increased downside risk, the spot AUD/USD pair remains firmly above the 0.70 level, suggesting limited selling pressure. For the average investor, this means that while risks exist, the Aussie dollar’s fundamentals remain intact, and patience is warranted until a clearer directional trend emerges. Technical analysis points to the 20-day moving average forming a short-term support base, potentially paving the way for further upside.

1uptick Analytics @

Maximize your profit at ease

Risk Warning​

*Investment involves risk. You may use the information, strategies and trading signals on this website for academic and reference purposes at your own discretion. 1uptick cannot and does not guarantee that any current or future buy or sell comments and messages posted on this website/app will be profitable. Past performance is not necessarily indicative of future performance. It is impossible for 1uptick to make such guarantees and users should not make such assumptions. Readers should seek independent professional advice before executing a transaction. 1uptick will not solicit any subscribers or visitors to execute any transactions, and you are responsible for all executed transactions.

© 2022-25 – 1uptick Analytics all rights reserved.


Risk Warning​

*Investment involves risk. You may use the information, strategies and trading signals on this website for academic and reference purposes at your own discretion. 1uptick cannot and does not guarantee that any current or future buy or sell comments and messages posted on this website/app will be profitable. Past performance is not necessarily indicative of future performance. It is impossible for 1uptick to make such guarantees and users should not make such assumptions. Readers should seek independent professional advice before executing a transaction. 1uptick will not solicit any subscribers or visitors to execute any transactions, and you are responsible for all executed transactions.

© 1uptick Analytics all rights reserved.

Home
Analysis
Calendar
Tools
Signals