
Trump Says He Plans Reciprocal Tariffs, Will Affect ‘Everyone’
Testing testing
Testing testing
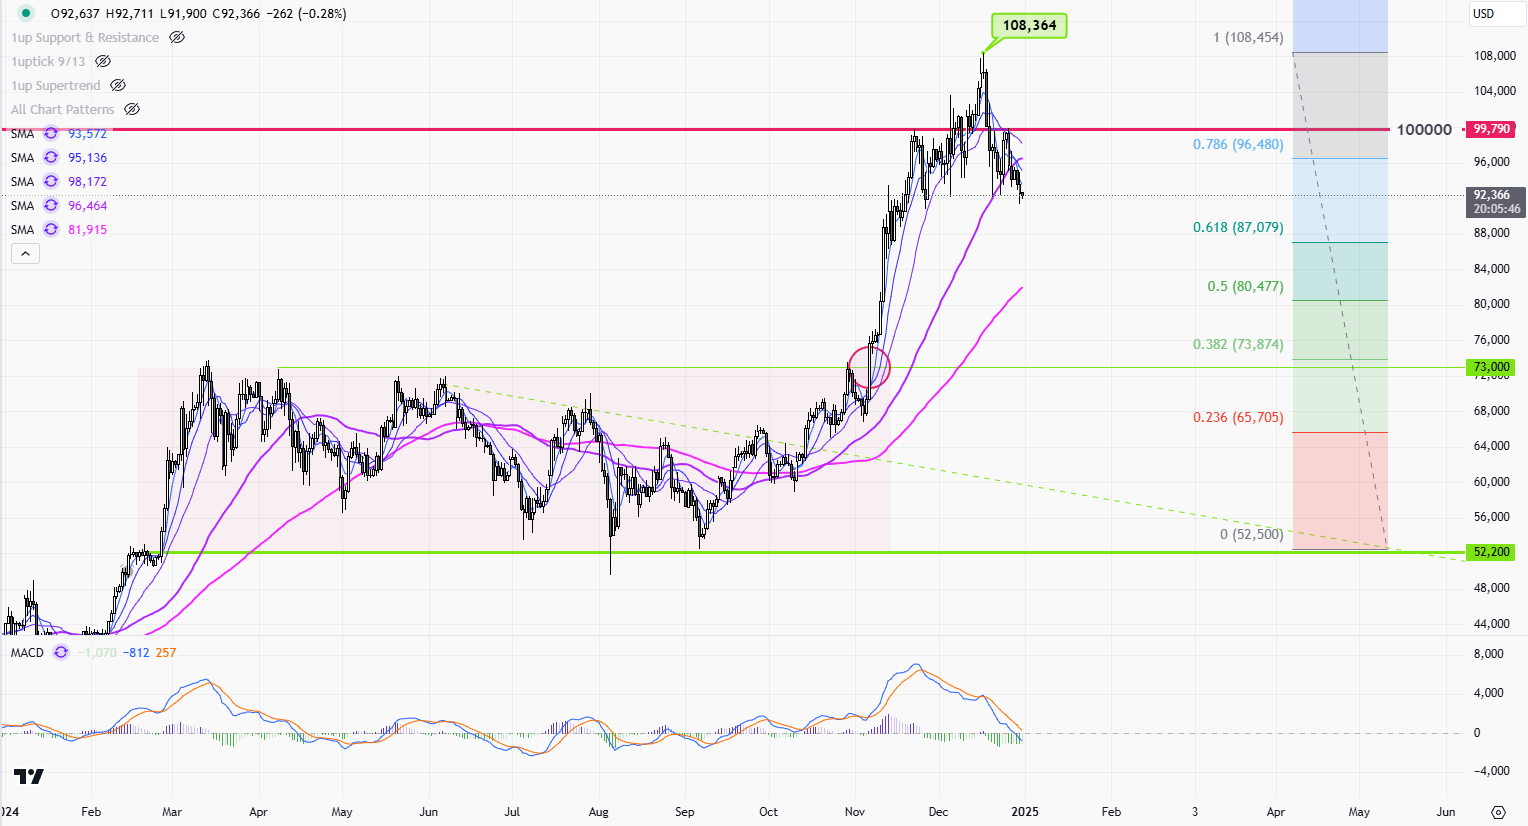
Price Movement The daily candlestick chart for the Bitcoin shows a significant upward movement that peaked at around 108,364, followed by a correction phase. Initially, the price rallied from a consolidation phase into a substantial uptrend, reflecting strong bullish momentum. The uptrend, characterized by higher highs and higher lows, eventually reversed after hitting resistance around […]

Price Movement The USD/JPY daily chart displays a strong upward trend, with the price moving consistently higher since early October. After hitting a low around 140 in late August, the pair embarked on a bullish trajectory, breaking multiple resistance levels. Recently, the pair has consolidated just below a significant resistance at 160, indicating a pause […]
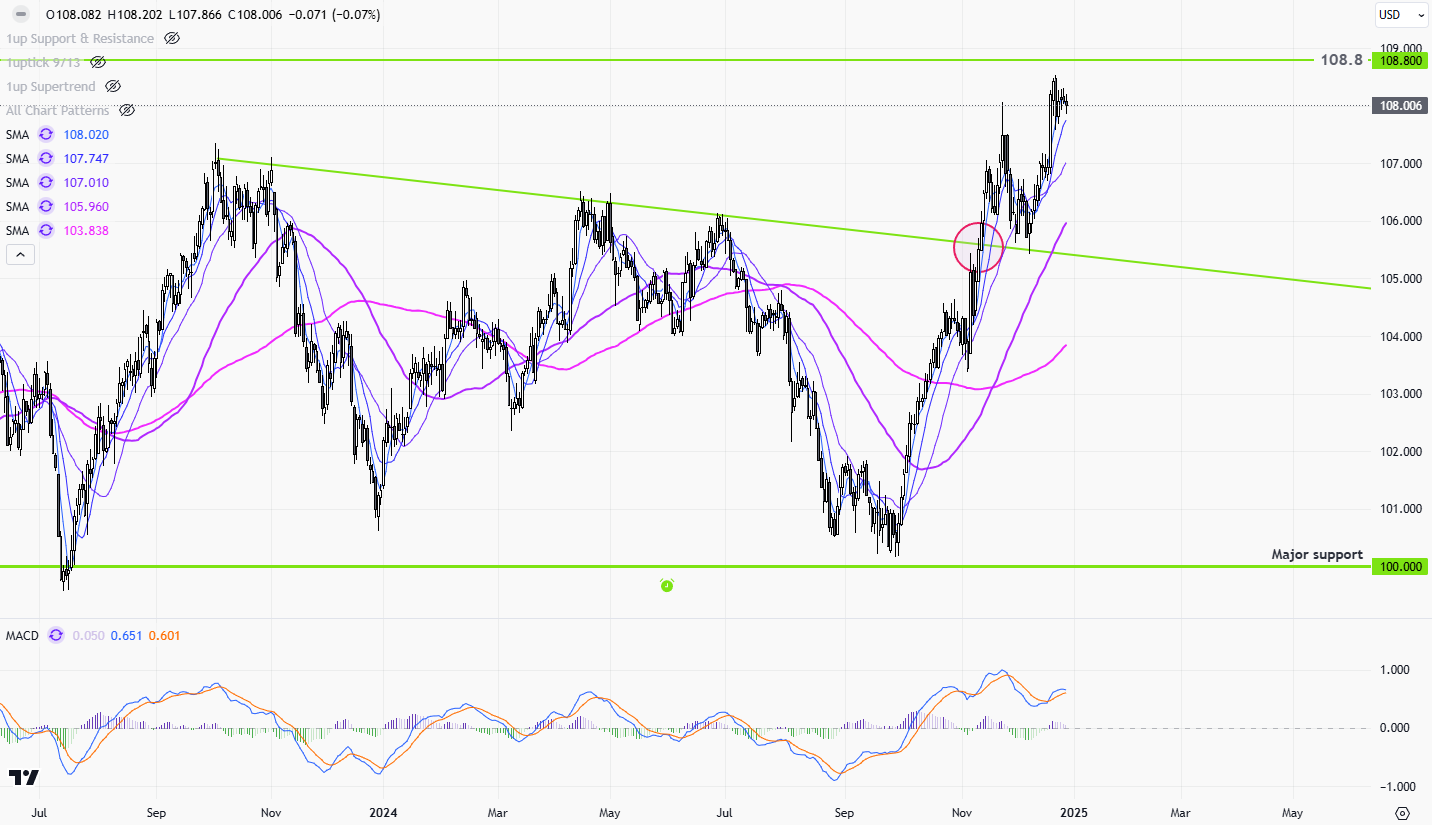
Price Movement The USD daily chart showcases a significant upward trend in recent months, with the price breaking through a long-standing resistance level. Early fluctuations were contained within a range between 100 and 108, but recent bullish momentum has pushed the price above the 108 mark, indicating strong buying interest. The moving averages have aligned […]

Price Movement The daily chart of copper reveals a significant long-term downtrend following a peak at $5.2010. The price has been making lower highs and lower lows, indicating persistent bearish momentum. Recent sessions show copper trading within a descending triangle pattern, with resistance around the $4.3355 level and support near $3.9230. This consolidation reflects indecision […]
Price Movement The EUR/USD daily chart showcases a significant downtrend over recent months, with the pair forming lower highs and lows. After a sharp decline in late October, the price began to stabilize, finding support around the 1.0333 level. This support held multiple retests, indicating a temporary halt in the bearish momentum. Meanwhile, the pair […]
Price Movement The EUR/USD currency pair has experienced significant volatility recently. The pair was initially in a downward trend but appears to establish a base support around the 1.03330 level. The price action shows several tests of this support, indicating its strength. Despite previous bearish momentum, a minor bullish correction seems to be occurring as […]
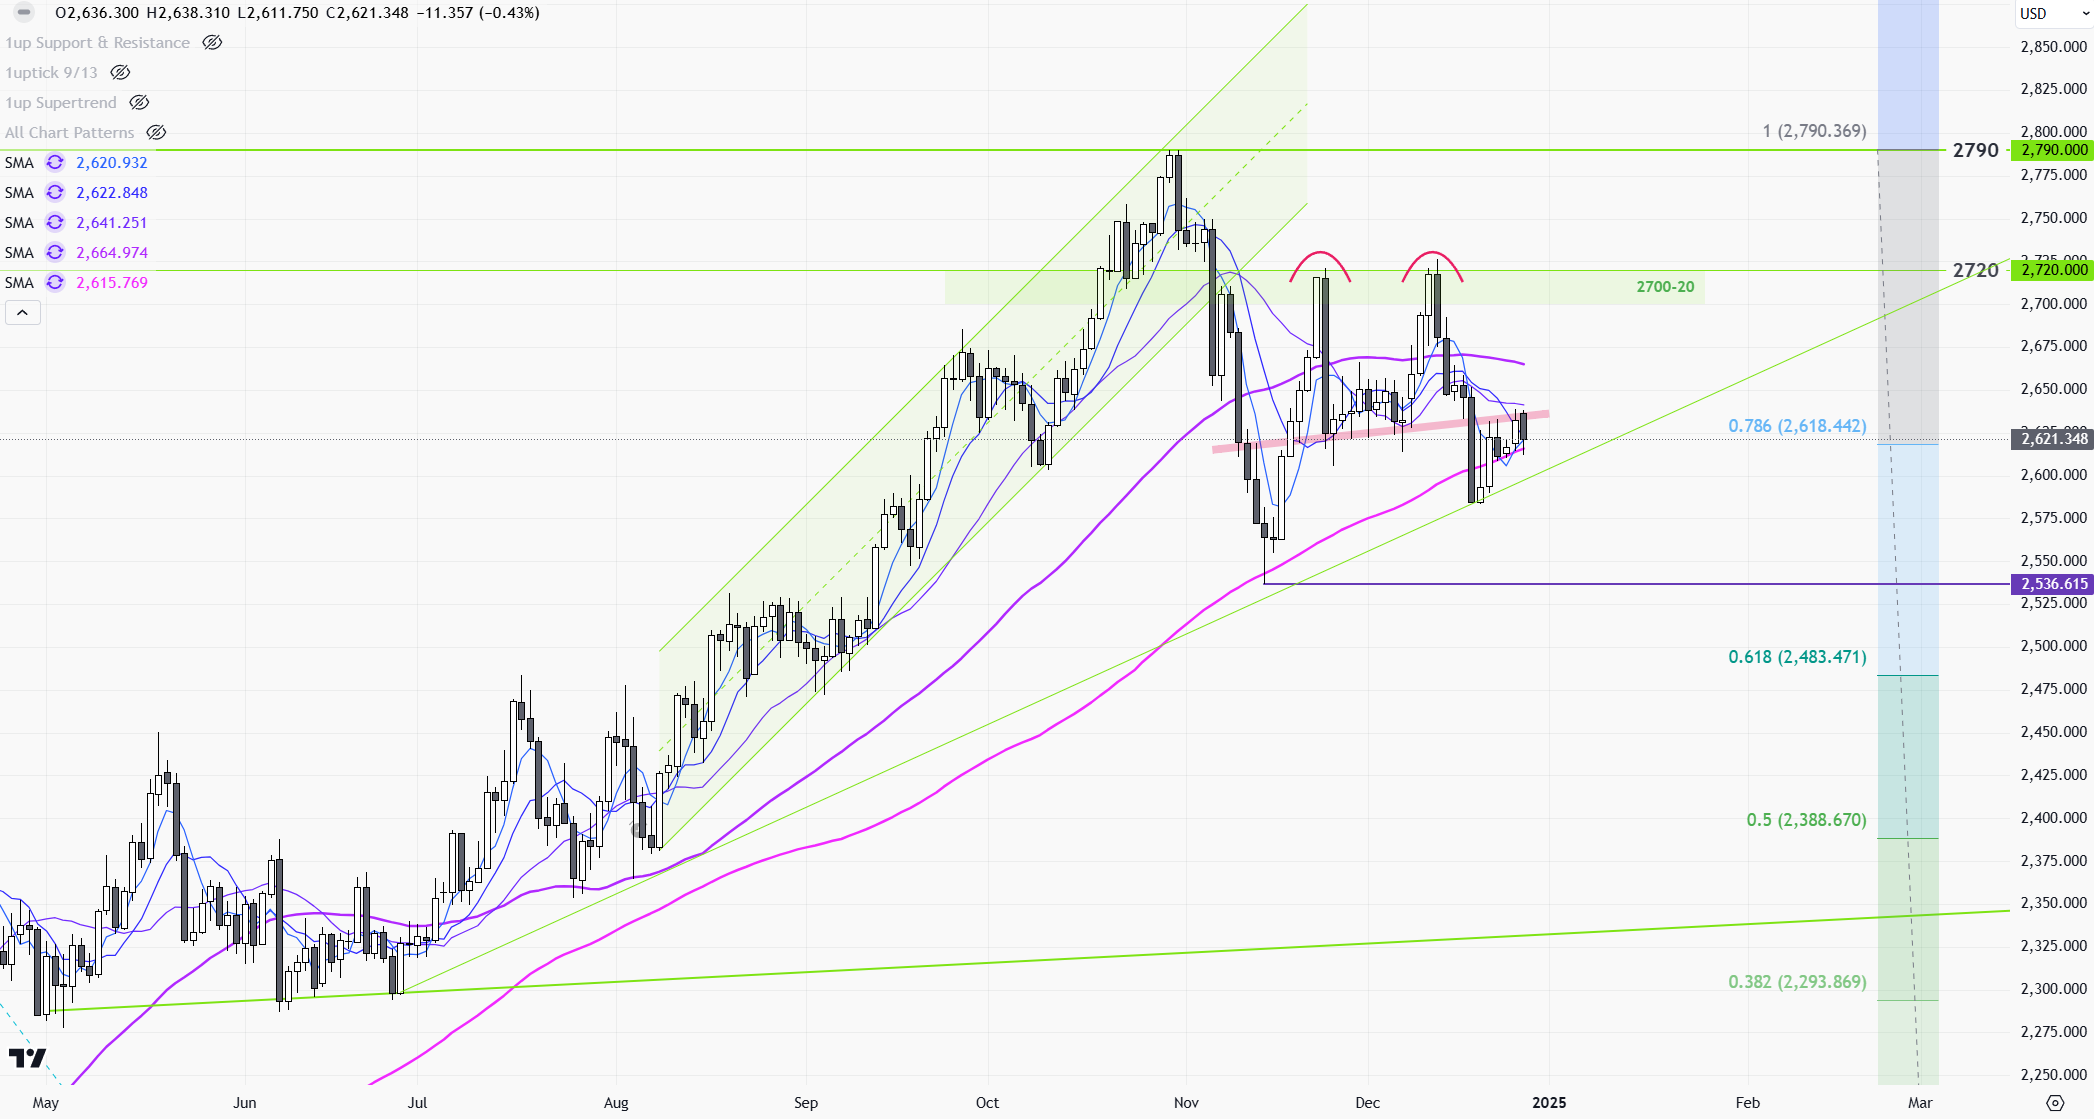
Price Movement The gold daily chart reveals a significant bullish trend that persisted from May to early November, characterized by a steady rise with minor corrections. The price reached a peak around the 2,790 level, but this was followed by a sharp decline, indicating increased selling pressure. Subsequently, the price has been consolidating, finding support […]

Price Movement The WTI crude oil daily chart indicates a series of volatile price movements within a descending channel. The price has oscillated between the $65 support level and the $88 resistance level, reflecting a bearish trend over the past year. Recent price action shows consolidation within the $68 to $72 range, suggesting potential accumulation […]
The downtrend in gold prices continued last week after turning back from the previous week’s high of 2726.The decline accelerated after the Fed’s interest rate meeting on Wednesday, failing to support at 2630(1) and falling back to a near three-month low near 2585.Then on Friday, US inflation data came down slightly, causing gold to bounce back above 2600 to close the week at 2622 (down $25 from the previous week).
As mentioned 2 weeks ago, there will be significant profit taking above 2700 while the year came close to the end. After the Fed’s meeting, the market fundamentals began to change again. Fed Chairman Powell indicated that the number of interest rate cuts will be reduced in 2025, from the previously expected 4 times to 2 times; next year’s relatively high inflation and high-interest rate environment will bring support to the US dollar while keeping gold prices under pressure. The new U.S. President’s tariff policy will be the dominate factor to lead the gold price next year.
>
1-Hour Chart (Above) > Gold price rebounded after hitting 2583 late last week, forming a S-T bottom. Expect the rebound top near 2650. The market should be relatively quiet this week, take 2580-2650 as the trading range for now until the market develop further this week.
>
Daily Chart (Above) > Gold was rejected by 2700 twice on the daily chart, forming a double top pattern (3). Short selling should control the market as it cleared the support by the double top neckline (3.1) last week. After the current S-T rebound, the downtrend should resume and expected the price to return to around 2540-50 in the next 2 weeks. M-T operating range would be 2535-2730(4).
P. To
 |
| Gold V.1.3.1 signal Telegram Channel (English) |