GBPUSD Technical Analysis

Home  Technical Analysis  GBPUSD Technical Analysis
GBPUSD
GBPUSD: Structural Breakout Sparks Bullish Momentum Amid US-Iran Talks and Key Resistance Tests
22Apr

GBPUSD: Structural Breakout Sparks Bullish Momentum Amid US-Iran Talks and Key Resistance Tests

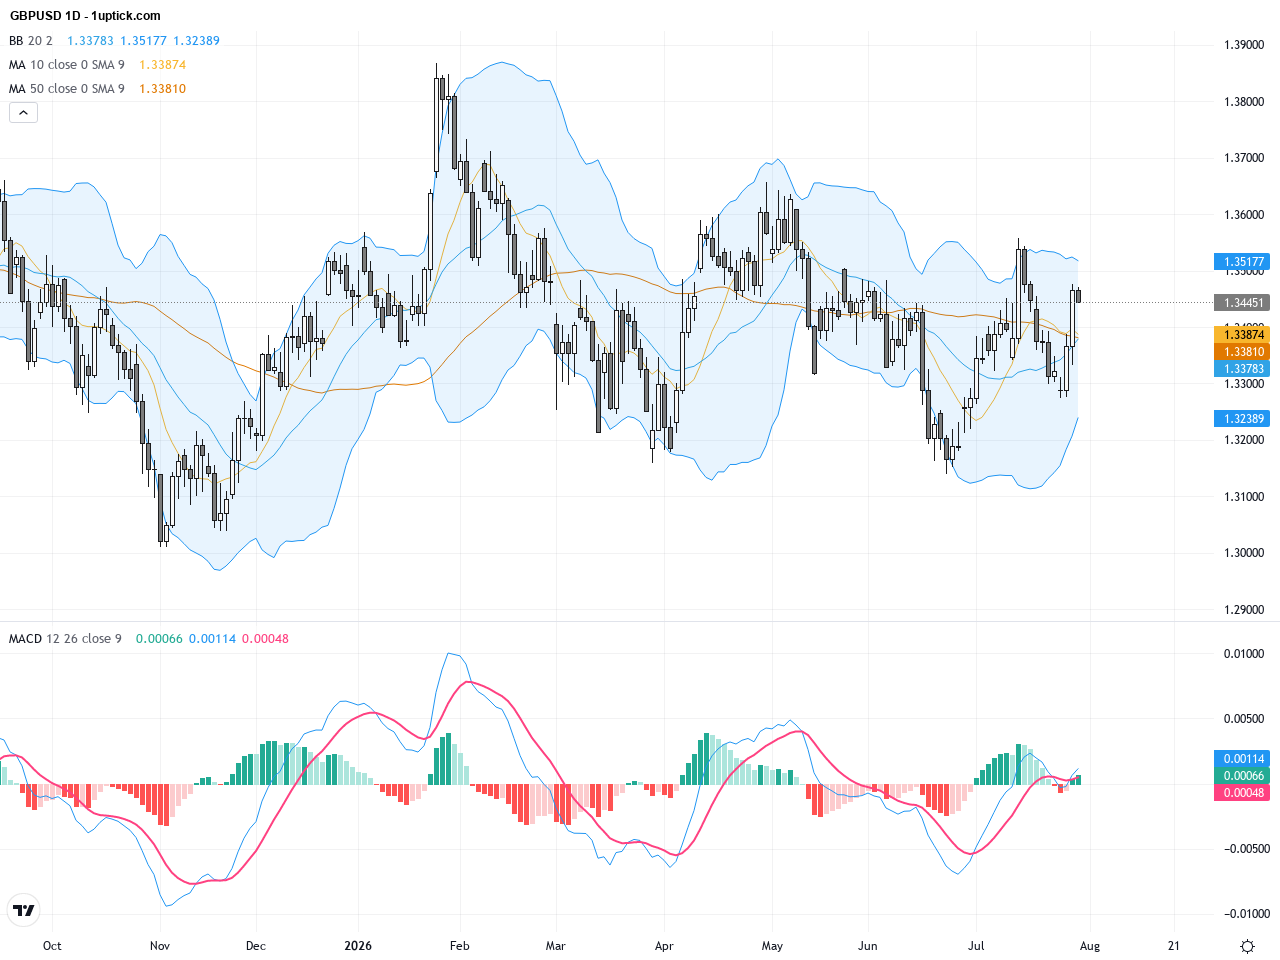
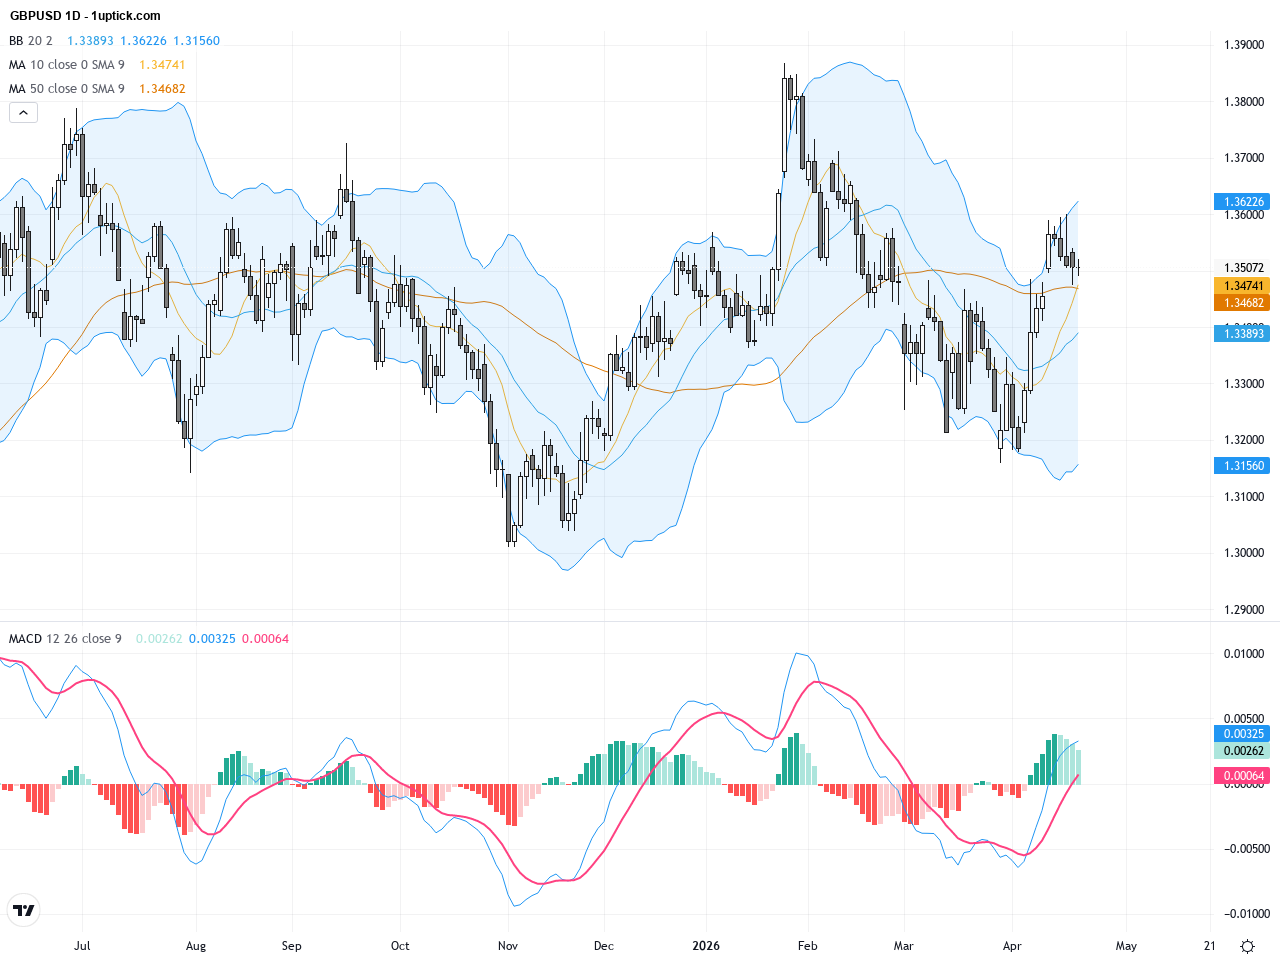
Over the past three trading days, GBPUSD has fluctuated within the 1.34 to 1.35 range, closing yesterday at 1.35072, showing resilience against the USD. The market mood shifted notably on renewed US-Iran peace negotiations that weakened the US Dollar Index (DXY) near 98.10, boosting risk appetite and lifting both the Pound and Euro. Despite some headwinds from UK economic growth concerns, stable volume and a confirmed structural breakout on the daily chart suggest a medium-term bullish bias. Today’s UK Consumer Price Index (CPI) and core CPI releases will be key in confirming the continuation of this momentum. Investors should watch closely as GBPUSD trading outlook turns cautiously bullish with critical support and resistance levels to monitor.
GBPUSD: Key Moving Average Breakout Signals Cautious Bearish Consolidation
20Apr

GBPUSD: Key Moving Average Breakout Signals Cautious Bearish Consolidation

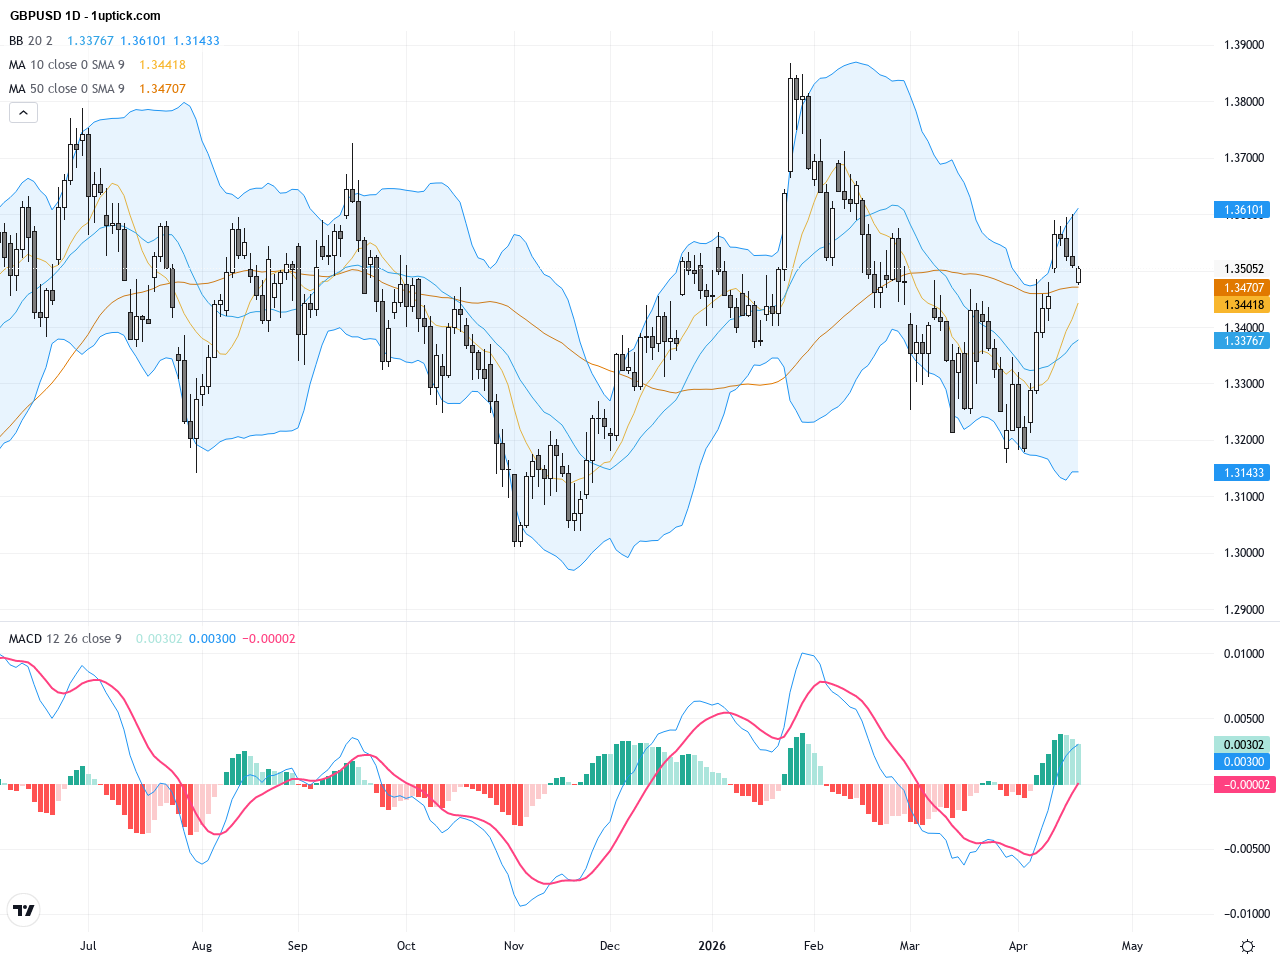
Over the past three trading days, GBPUSD exhibited notable volatility with yesterday’s close at 1.35048 USD. The US dollar weakened on easing US-Iran tensions, boosting the GBPUSD rate, but sterling remains cautious amid ongoing UK political pressure this week. Market sentiment swings as US natural gas futures stabilize, prompting investors to remain on the sidelines. For average investors, this implies that the pair may continue consolidating short-term with key support and resistance zones holding importance. Technical analysis reveals important levels to watch, signaling an upcoming breakout opportunity for traders.

GBPUSD: GBP/USD Faces Resistance at 1.3600 as Rally Pauses near Key Fibonacci Level
17Apr

GBPUSD: GBP/USD Faces Resistance at 1.3600 as Rally Pauses near Key Fibonacci Level

GBPUSD has experienced notable volatility over the past three trading days, closing yesterday at 1.3522. The pair stalled near the 1.3600 mark, a critical 61.8% Fibonacci retracement level, indicating a pause in the rally. Fundamental news highlights include supportive Bank of England rate decisions and easing geopolitical tensions via US-Iran talks, which have buoyed risk appetite for sterling. However, concerns over UK’s economic outlook amid ongoing geopolitical risks temper bullish sentiment. For everyday investors, this means GBPUSD is likely to trade in a consolidation range near current levels, making key technical support and resistance levels crucial for anticipating the next breakout direction. Technically, daily charts confirm a major structural breakout, while hourly charts show a short-term tug-of-war reflected in MACD signals. Overall, GBPUSD currently faces a pivotal phase shaped by a confluence of fundamental and technical factors, prompting cautious trading strategies.

GBPUSD: Key Support Holds Amid Dollar Slide and Geopolitical Easing Signals Potential Rebound
15Apr

GBPUSD: Key Support Holds Amid Dollar Slide and Geopolitical Easing Signals Potential Rebound

Over the past three trading days, GBPUSD closed near 1.35673, reflecting a sharp response to a weaker US dollar. Optimism over US-Iran peace talks pushed the dollar to a six-week low, lifting the pound to a 21-month high. Despite UK inflation risks driven by rising energy prices, the dollar’s broad weakness has been the primary driver of GBPUSD’s recent price action. This fundamental backdrop sets the stage for a cautiously bullish trading outlook, highlighting both risk factors and rebound potential for medium- and short-term investors. Monitoring market sentiment and dollar fluctuations remains key for trading opportunities this week.

GBPUSD: US Dollar Safe-Haven Spike Pressures Pound amid Key Support Levels
13Apr

GBPUSD: US Dollar Safe-Haven Spike Pressures Pound amid Key Support Levels

Over the past three trading days, GBPUSD experienced significant volatility, closing yesterday at 1.34054 after a 0.37% decline. The pair halted its five-day winning streak by gapping down to around 1.3390 during Asian trading hours, as the US dollar surged on heightened global risk aversion. Market concerns over escalating Middle East tensions, especially the US blockade of Iranian ports, drove uncertainty and pressured GBPUSD. For average investors, this translates to increased safe-haven demand for the USD and potential short-term pullbacks for GBP. Staying alert to geopolitical developments and USD momentum is critical for risk management.

1 7 8 9 10 11 20
GBPUSD: Critical Bull Flag Pattern Near 1.33 Amid BoE Rate Uncertainty
03Apr

GBPUSD: Critical Bull Flag Pattern Near 1.33 Amid BoE Rate Uncertainty

Over the past three trading days, GBPUSD has traded within a tight range between 1.32 and 1.33, closing yesterday at 1.32263. The British Pound is wrestling with uncertainty from the Bank of England’s rate policy and persistent inflation risks while the easing Middle East tensions have softened the US Dollar, presenting a short-term rebound opportunity. The market mood remains cautious following the BoE’s rate hold and inflation warnings. For everyday investors, this means GBPUSD’s immediate movements will be influenced by UK economic updates and global risk sentiment, resulting in heightened volatility and the need for careful trading approaches.

GBPUSD: Bull Flag Formation Signals Potential Rebound in Pound-Dollar Trading Outlook
01Apr

GBPUSD: Bull Flag Formation Signals Potential Rebound in Pound-Dollar Trading Outlook

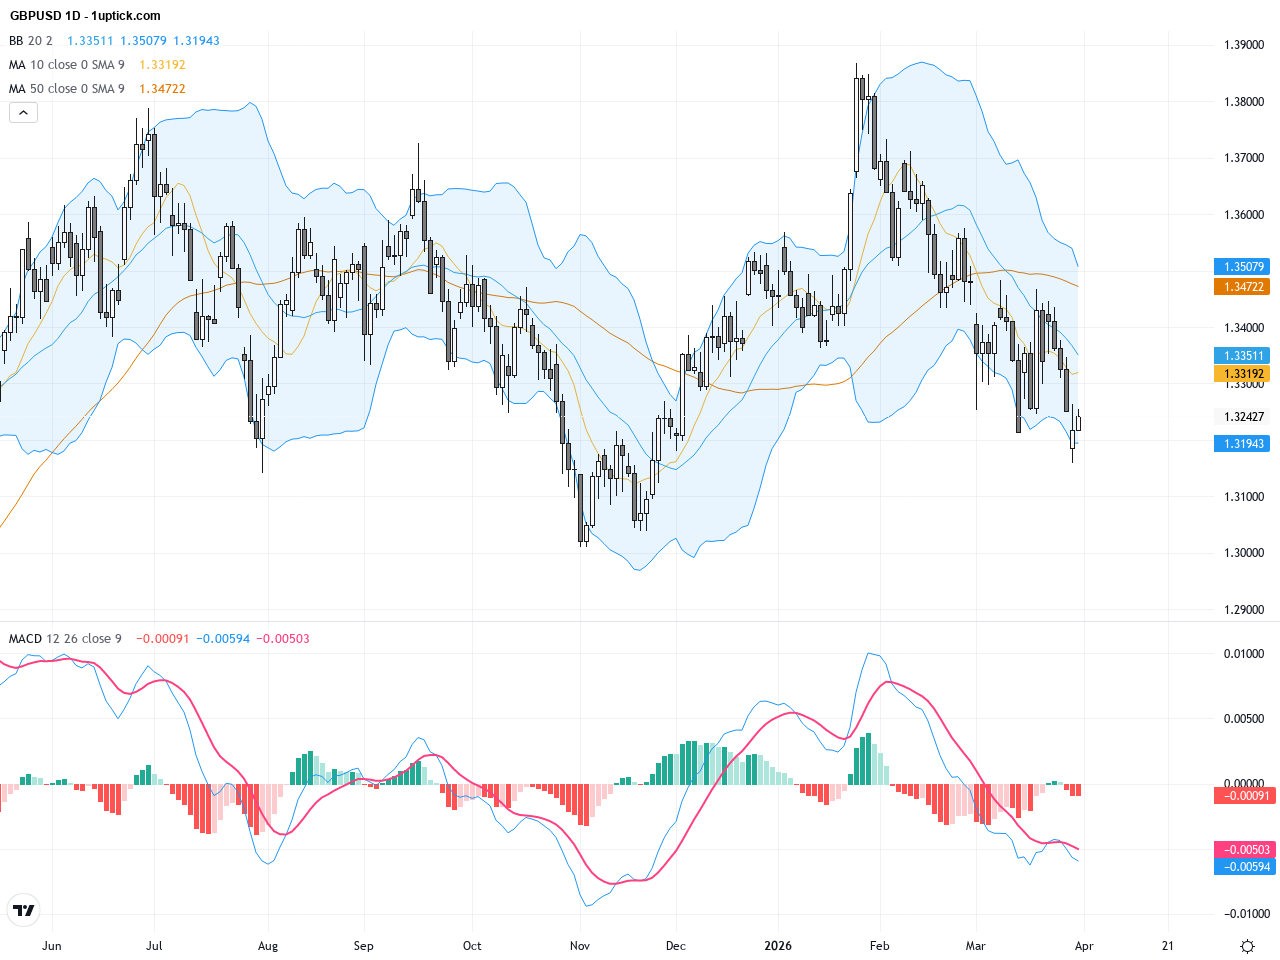
Over the past three trading days, GBPUSD exhibited notable volatility, closing near 1.32434 yesterday with slight gains. The market sentiment was influenced by easing tensions in the Middle East, which supported a modest rebound in the pound against the dollar. Despite UK Q4 GDP growth hovering near stagnation, stable inflation provided some support to GBP. Meanwhile, strong US employment data and a robust dollar exerted pressure on the pair. Technically, the emergence of a bullish flag pattern points to a possible short-term recovery. For average investors, the evolving peace talks and US economic data remain key factors that could steer GBPUSD’s next move, possibly stabilizing near support levels and preparing for a bounce.

GBPUSD: Bull Flag Pattern Emerges Ahead of Retail Sales Sets Up Potential Breakout
27Mar

GBPUSD: Bull Flag Pattern Emerges Ahead of Retail Sales Sets Up Potential Breakout

Over the past three trading sessions, GBPUSD has traded cautiously around the 1.33 level, reflecting subdued investor sentiment amid strengthening USD supported by easing Middle East tensions. Closing yesterday at approximately 1.3342, the pound lacked strong domestic catalysts, keeping the pair in a consolidation zone. The pair currently forms a classic bull flag on the charts, signaling potential for an upside breakout if upcoming UK retail sales data surprises positively. For everyday investors, this means geopolitical and economic updates are directly influencing currency movements, underscoring the need to watch key data releases closely. A disappointing retail numbers release may pressure GBPUSD down towards 1.32, while an upbeat report could push it above 1.35 resistance.

GBPUSD Approaches Key Resistance at 1.3437 Ahead of UK February CPI Data
25Mar

GBPUSD Approaches Key Resistance at 1.3437 Ahead of UK February CPI Data

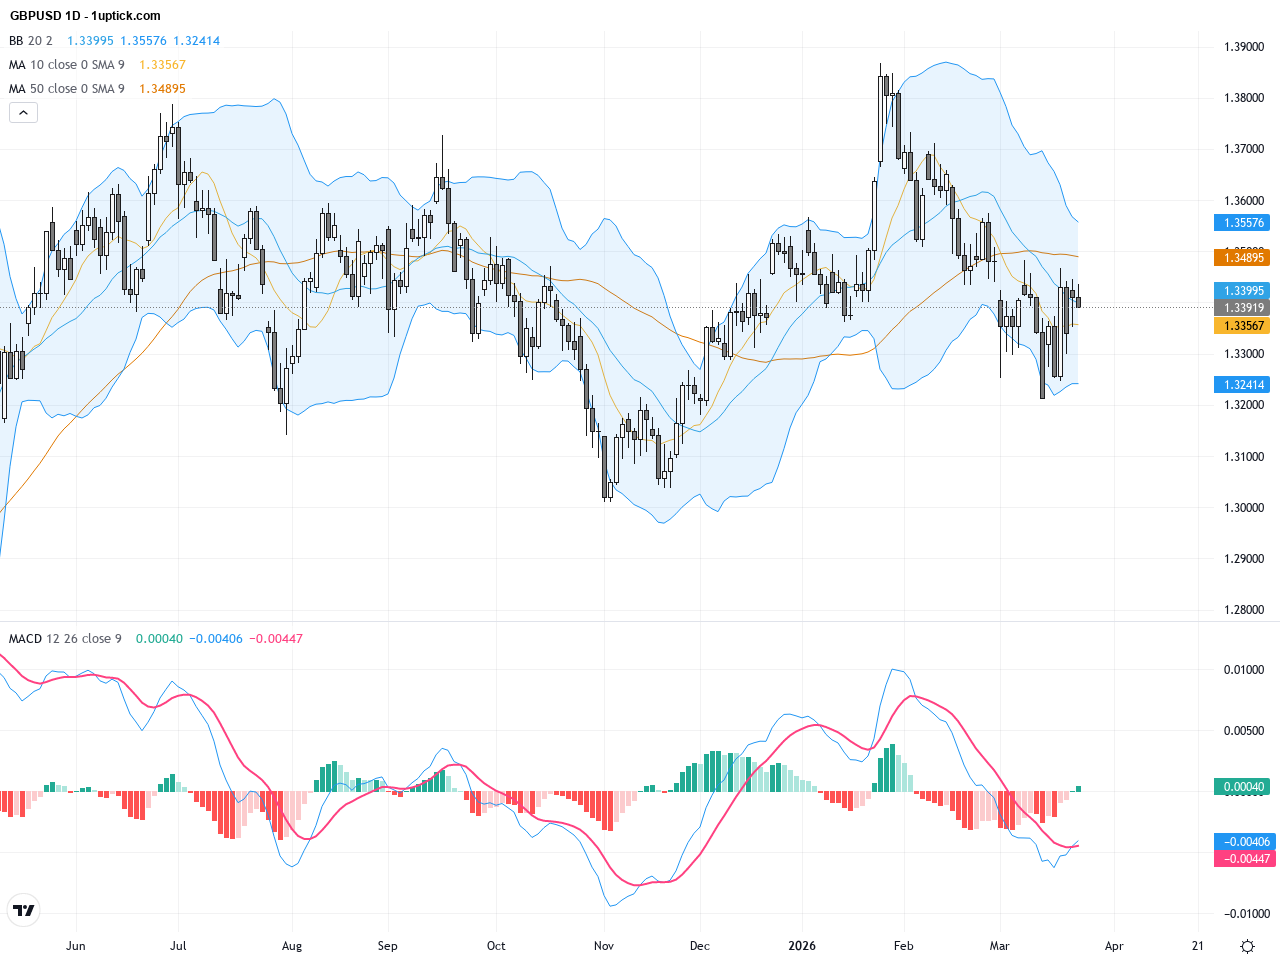
Over the past three trading days, GBPUSD has shown notable price volatility, closing slightly lower at 1.3392. Market sentiment is influenced by expectations around the upcoming UK February Consumer Price Index (CPI) release, the Bank of England’s hawkish outlook, and the prevailing strength of the US dollar amid geopolitical tensions. The pair holds steady near the 1.34 level as traders brace for inflation data that may reshape short-term trading prospects. For the average investor, this means the British pound is caught between supportive hawkish signals and pressure from rising global energy prices and a strong dollar, maintaining the pair in a sensitive trading range.

GBPUSD Technical Breakout: Key Support and Resistance Levels to Watch
23Mar

GBPUSD Technical Breakout: Key Support and Resistance Levels to Watch

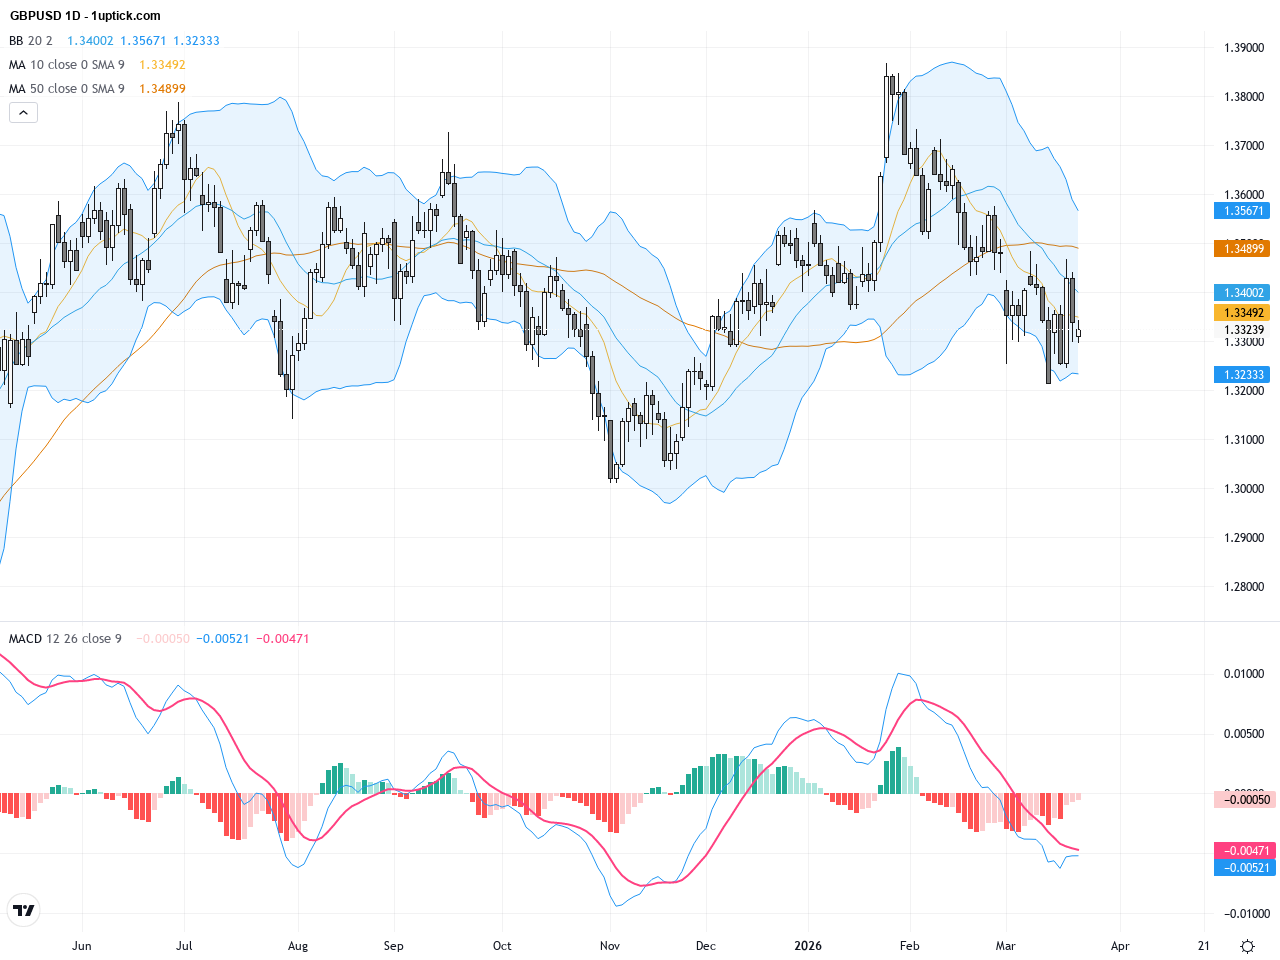
GBPUSD has faced downward pressure amid signs of structural weakness in the US Dollar Index (DXY). Over the past three trading days, the pair hovered near yesterday’s 1.3323 closing level before slipping lower, influenced by cautious investor sentiment ahead of pivotal central bank meetings. Political uncertainties and rising energy prices add to market volatility. Technically, GBPUSD broke below its critical ascending trendline, signaling potential for further downside. For the average investor, this means a moment to tighten risk controls and monitor if key support zones hold. The market mood remains reserved as traders await fresh catalysts from this week’s economic data releases.

GBPUSD Surges as Bank of England’s Hawkish Pivot Sparks Strong Rally
20Mar

GBPUSD Surges as Bank of England’s Hawkish Pivot Sparks Strong Rally

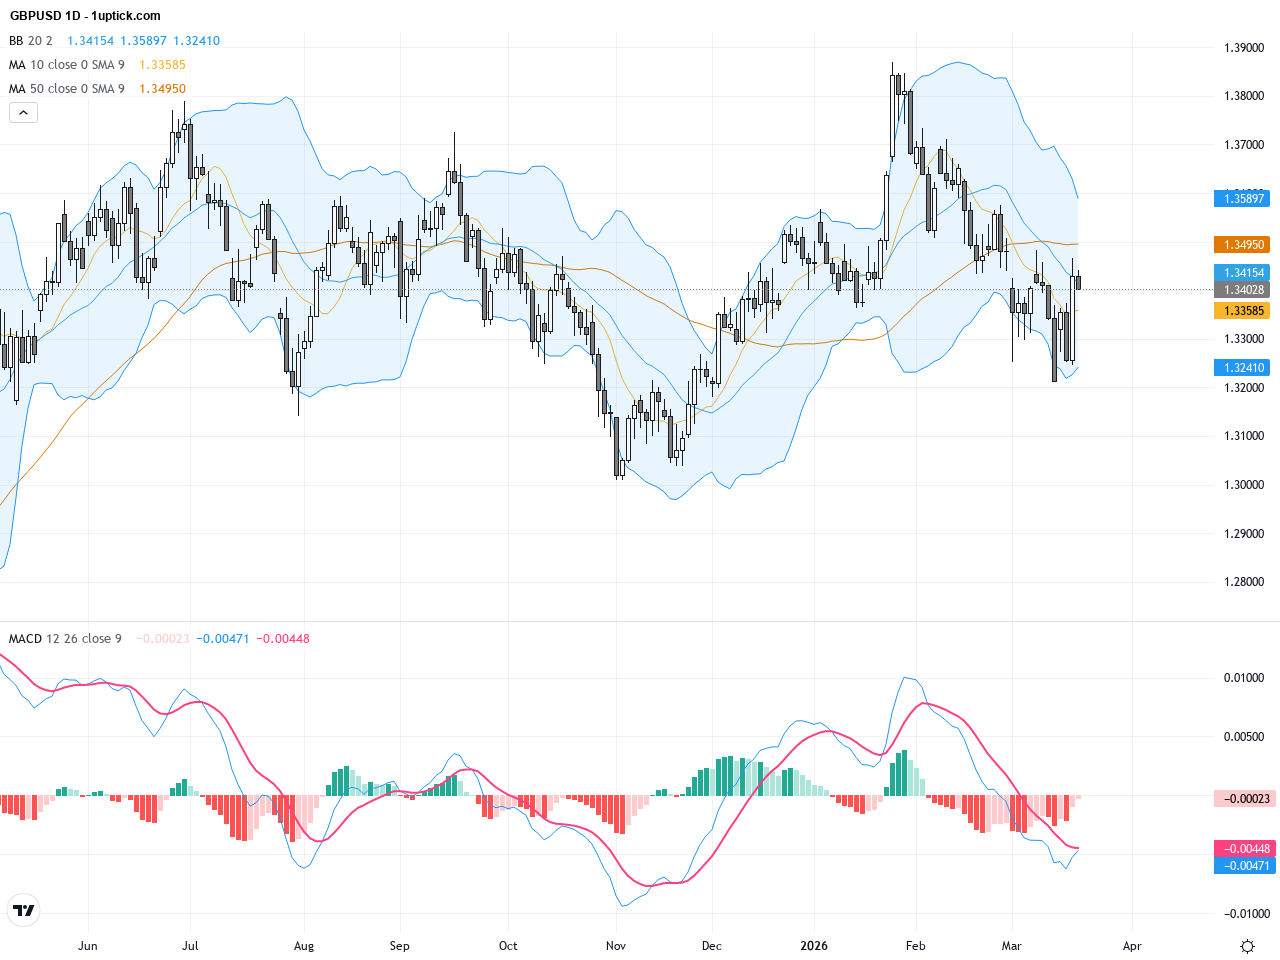
Over the past three trading days, GBPUSD has exhibited significant volatility, notably surging after the Bank of England (BoE) surprised markets by maintaining rates but signaling a more hawkish stance. On Thursday, the pair rallied nearly 1.3%, closing around 1.3430, above yesterday’s close of 1.34028. The pound’s strength is driven by BoE’s warnings on persistent inflation risks, particularly those linked to Middle East geopolitical tensions pushing energy prices higher, compounded by a broad US dollar weakness. For everyday investors, this means market sentiment is shifting cautiously optimistic on UK monetary policy, suggesting the pound-dollar pair may continue an oscillating upward trajectory in the near term.

1 7 8 9 10 11 17

1uptick Analytics @

Risk Warning​

*Investment involves risk. You may use the information, strategies and trading signals on this website for academic and reference purposes at your own discretion. 1uptick cannot and does not guarantee that any current or future buy or sell comments and messages posted on this website/app will be profitable. Past performance is not necessarily indicative of future performance. It is impossible for 1uptick to make such guarantees and users should not make such assumptions. Readers should seek independent professional advice before executing a transaction. 1uptick will not solicit any subscribers or visitors to execute any transactions, and you are responsible for all executed transactions.

© 2022-26 1uptick Analytics all rights reserved.


Risk Warning​

*Investment involves risk. You may use the information, strategies and trading signals on this website for academic and reference purposes at your own discretion. 1uptick cannot and does not guarantee that any current or future buy or sell comments and messages posted on this website/app will be profitable. Past performance is not necessarily indicative of future performance. It is impossible for 1uptick to make such guarantees and users should not make such assumptions. Readers should seek independent professional advice before executing a transaction. 1uptick will not solicit any subscribers or visitors to execute any transactions, and you are responsible for all executed transactions.

© 1uptick Analytics all rights reserved.

Home
.AI
Analysis
Calendar
Tools