USDCAD: Breaking 14-Month High Amid Mixed Dollar-Canadian Dollar Market Signals, June 25, 2026
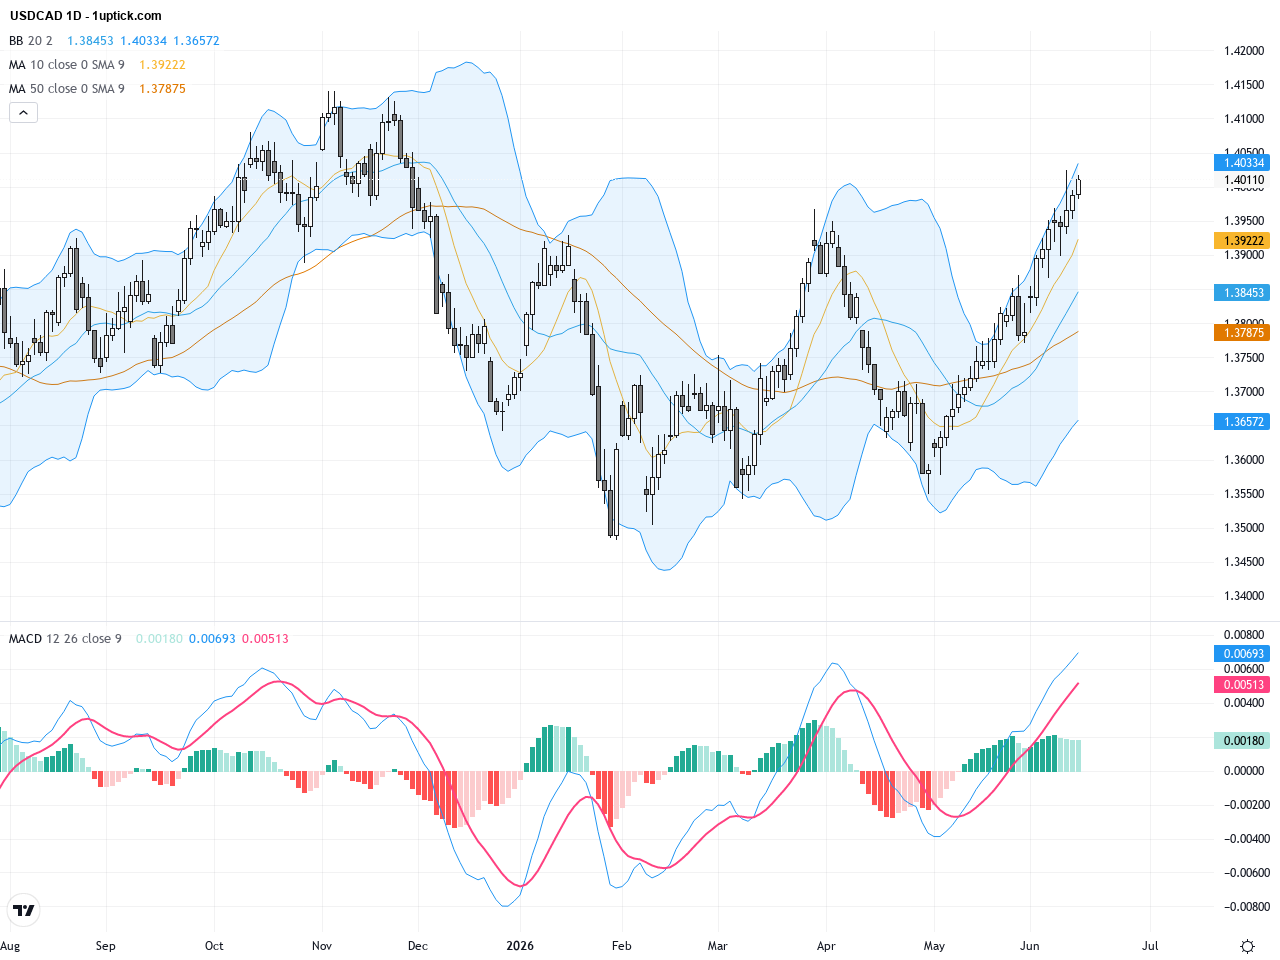
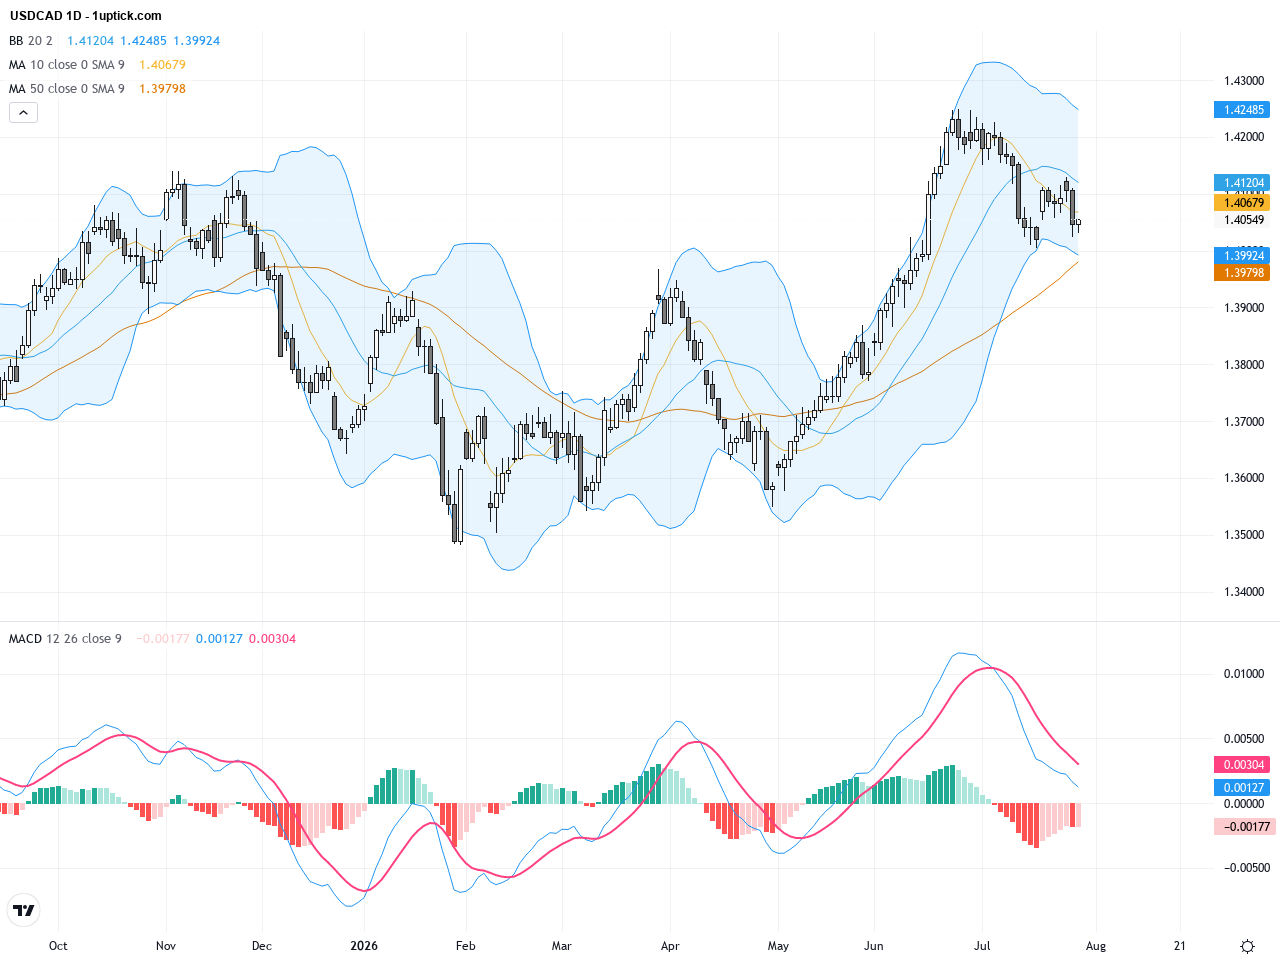
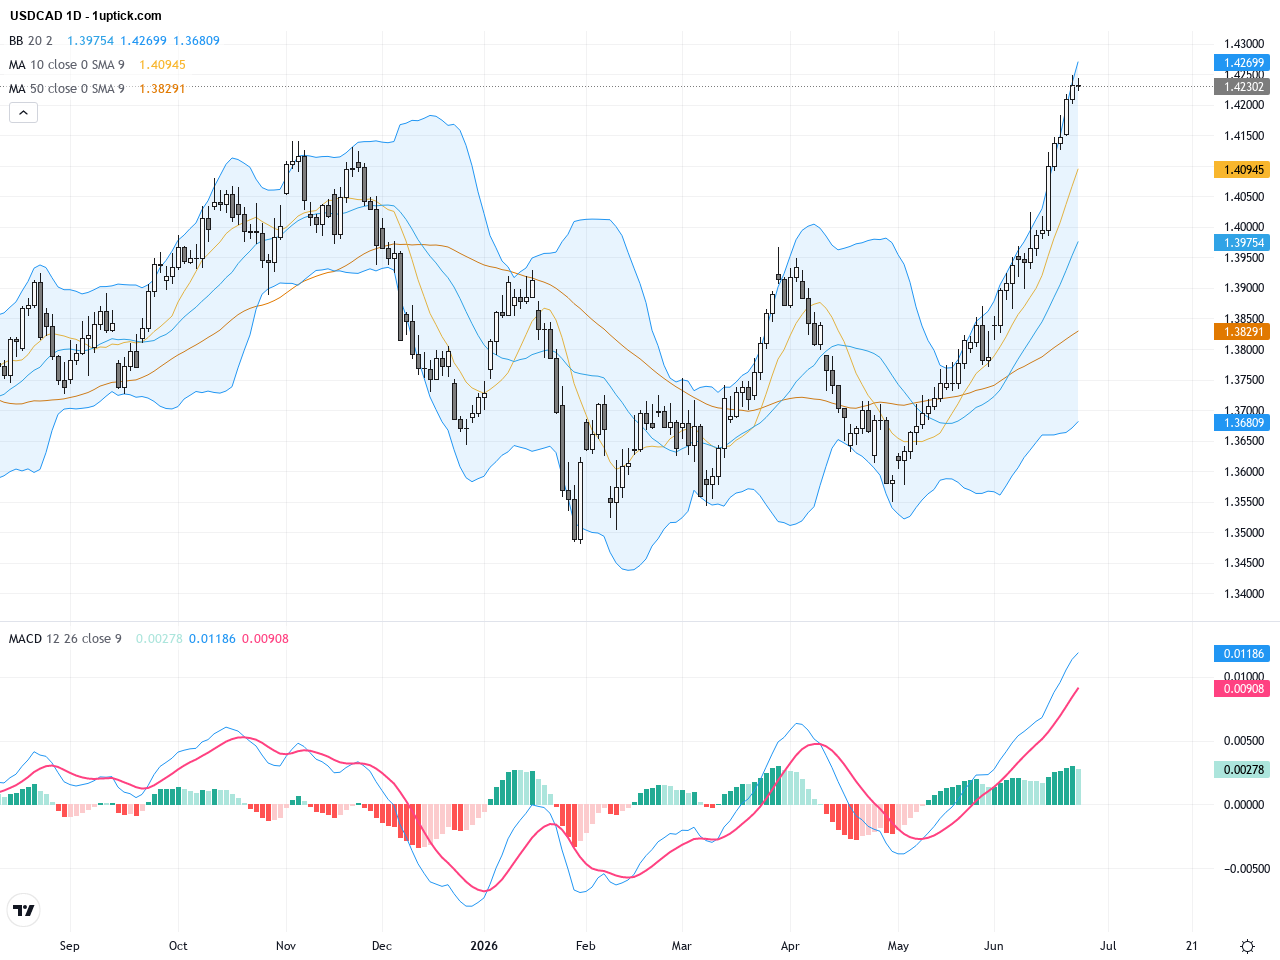
USDCAD has shown notable volatility over the last three trading days, reaching a 14-month high of 1.42478 on Wednesday and closing at 1.42302 yesterday. Despite the Federal Reserve maintaining a hawkish stance, the US dollar has weakened recently, allowing the Canadian dollar to gain slight traction. The interest rate differential between the US and Canada remains a key driver, sustaining the pair’s elevated price levels. For average investors, the scenario reflects a tug-of-war between continued US yield advantages and the potential for a near-term reversal. Traders should watch for key technical support and resistance, as well as upcoming economic data, to gauge future direction.