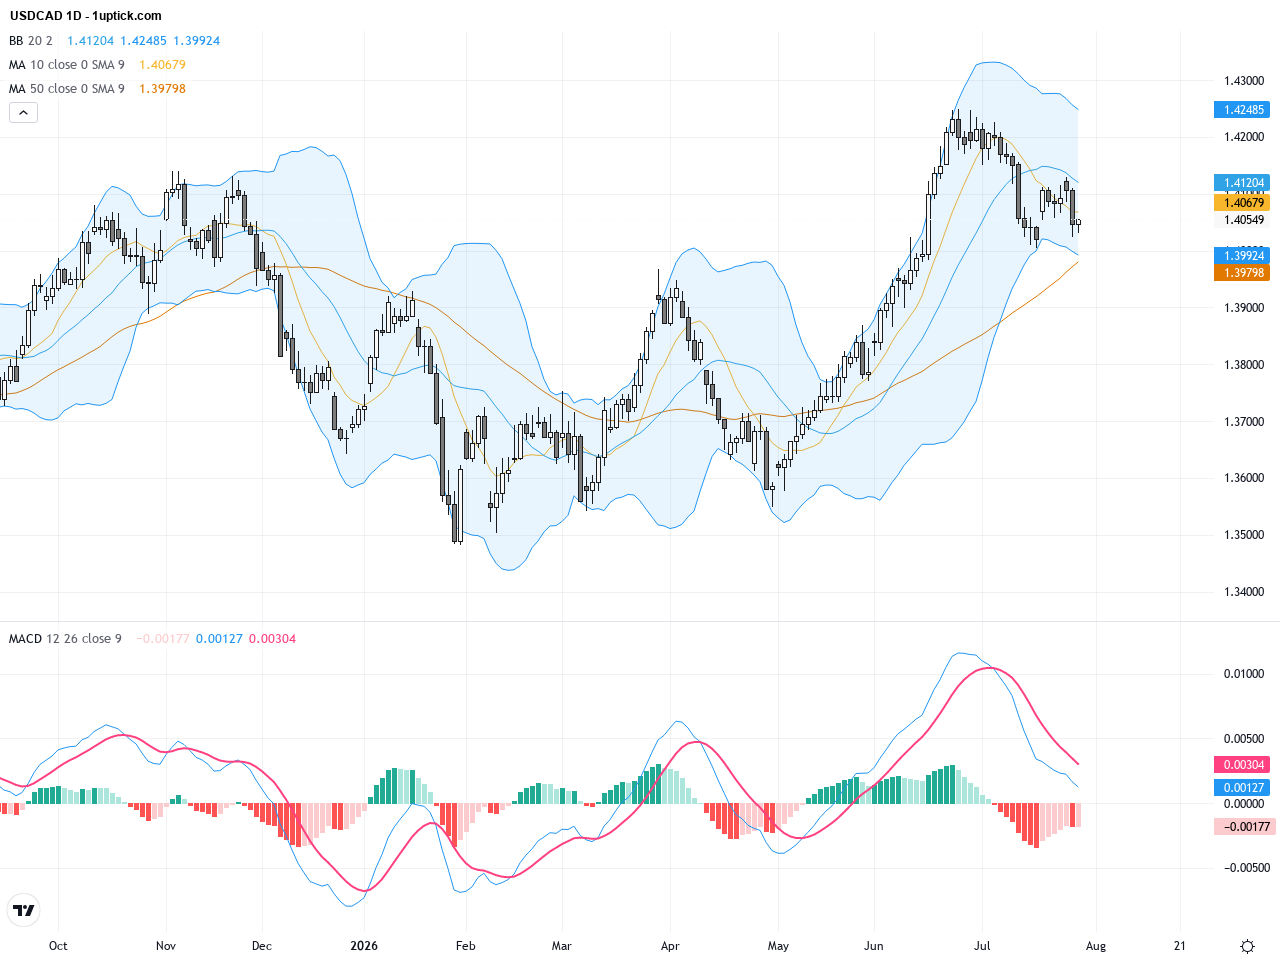
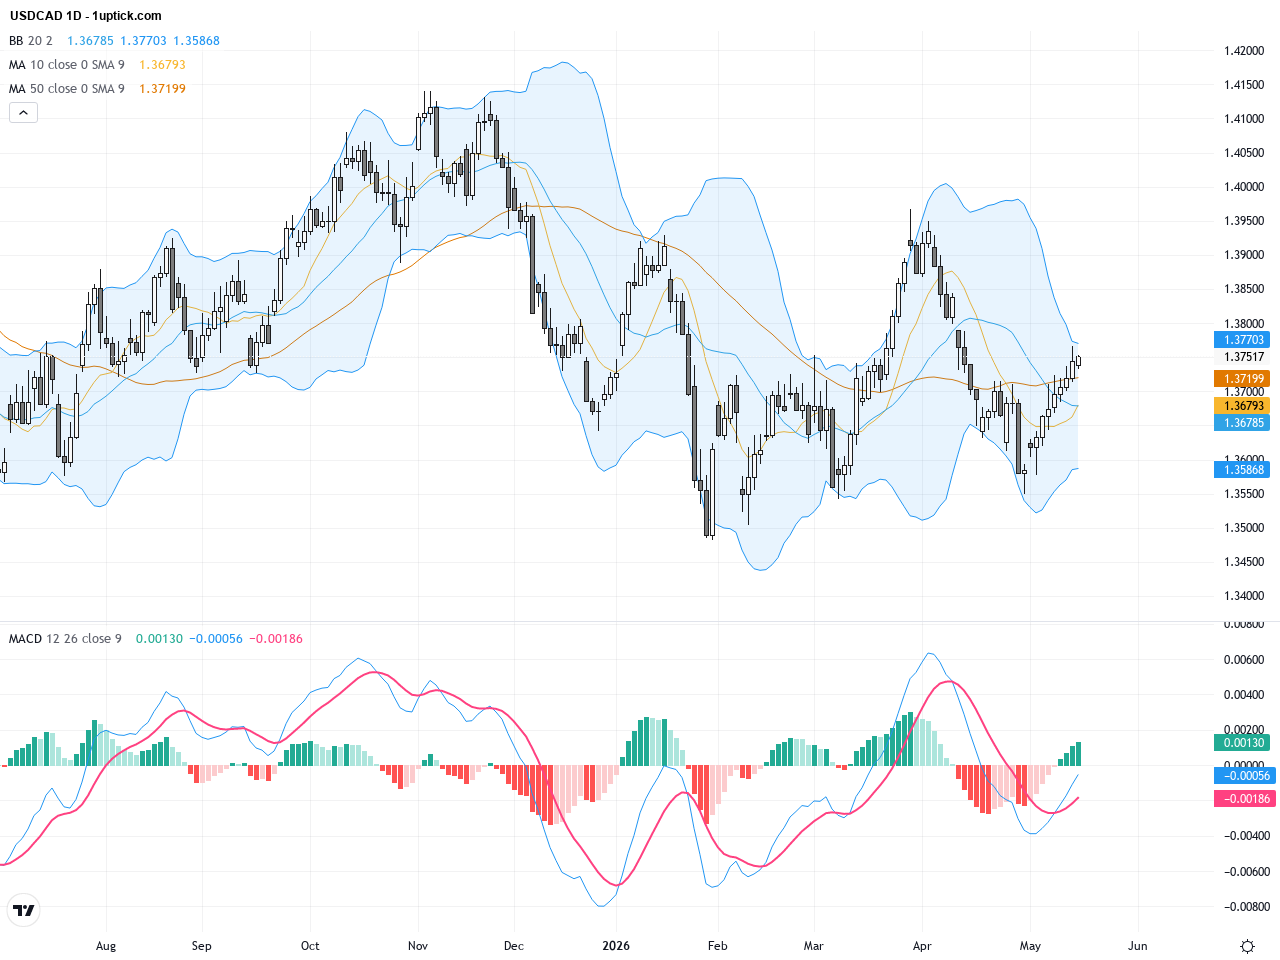
USDCAD Technical Analysis

Home  Technical Analysis  USDCAD Technical Analysis
USDCAD
USDCAD: Strong US Data Supports Steady 1.3900 as Technicals Signal Short-Term Volatility
15Jan

USDCAD: Strong US Data Supports Steady 1.3900 as Technicals Signal Short-Term Volatility

Over the past three trading sessions, USDCAD has maintained a steady stance near the 1.3900 level, with yesterday’s closing price at 1.39025. Robust US retail sales and producer price index data have bolstered market expectations of a Fed pause, thereby supporting the US dollar and keeping USDCAD in positive territory. Meanwhile, the Canadian dollar finds support amid recovering oil prices, causing price fluctuations around key levels. For investors, recent market news and price action suggest a range-bound environment with potential volatility ahead. Monitoring economic data releases and key technical support and resistance levels is crucial for risk management.

USDCAD: Key Resistance at 1.3900 Holds as Market Awaits US CPI Data
14Jan

USDCAD: Key Resistance at 1.3900 Holds as Market Awaits US CPI Data

Over the past three trading days, USDCAD has traded in a tight range between 1.3850 and 1.3890, showing market indecision with yesterday’s closing at 1.38816. Market attention is fixed on the upcoming US December Consumer Price Index (CPI) data, which shows inflation steady at 2.7% year-on-year, creating a cautious mood among traders. Meanwhile, strengthening Canadian oil prices have buffered the Canadian dollar to some extent, contributing to the range-bound price action. For everyday investors, the recent price movement underscores how US economic data and commodity price swings influence USDCAD, signaling the importance of monitoring key technical levels and macro news for timely trading decisions.

USDCAD: Critical Support Test Amid Mixed Signals in Trading Outlook
06Jan

USDCAD: Critical Support Test Amid Mixed Signals in Trading Outlook

Over the past three trading days, USDCAD has been trading within a range between 1.3640 and 1.3800, continuing its rebound from late 2025. Closing at 1.37644 yesterday, the pair experienced mild fluctuations influenced by weak oil prices and a slipping US dollar. Recent economic data showing weakness in Canada’s manufacturing sector has weighed on the Canadian dollar, while the US Dollar Index’s volatility continues to sway the pair. For average investors, despite the short-term dollar weakness, the price testing key support levels implies possible trading reversal opportunities. Monitoring technical patterns and upcoming economic news remains essential to navigate the current market environment.

USDCAD: Key Resistance at 1.3800 Challenges Recent Rally in Trading Outlook
05Jan

USDCAD: Key Resistance at 1.3800 Challenges Recent Rally in Trading Outlook

Over the past three trading days, USDCAD has extended its recovery from the five-month low near 1.3640 observed at the end of December, closing yesterday at 1.37759. Market sentiment has been influenced by a stronger US dollar paired with weak Canadian manufacturing data, pushing the pair near 1.3750. Recent news suggests USDCAD may struggle to break above the crucial 1.3800 resistance, signaling potential short-term consolidation. For the average investor, it’s akin to a rally pausing for breath before deciding the next direction. Both fundamental and technical factors indicate traders should prepare for volatility ahead and carefully watch Canadian economic updates to seize upcoming opportunities.

USDCAD Technical Analysis: Key Support and Resistance Levels with Trading Outlook
01Jan

USDCAD Technical Analysis: Key Support and Resistance Levels with Trading Outlook

Over the past three trading days, USDCAD has shown notable volatility, closing yesterday at 1.3721, indicating some bullish momentum remains. The US dollar strengthened following robust labor market data, pushing the pair higher. However, rising oil prices have provided support for the Canadian dollar, leading analysts to take a cautious stance amid fundamental factors. Recent market news highlights potential pitfalls and key support challenges for USDCAD, with sentiment slightly bullish but vulnerable to pullbacks. For the average investor, this means closely monitoring US economic releases and oil price movements to capitalize on trading opportunities and manage risks effectively.

1 3 4 5 6 7
USDCAD Technical Analysis: Key Support and Resistance Levels with Trading Outlook
01Jan

USDCAD Technical Analysis: Key Support and Resistance Levels with Trading Outlook

Over the past three trading days, USDCAD has shown notable volatility, closing yesterday at 1.3721, indicating some bullish momentum remains. The US dollar strengthened following robust labor market data, pushing the pair higher. However, rising oil prices have provided support for the Canadian dollar, leading analysts to take a cautious stance amid fundamental factors. Recent market news highlights potential pitfalls and key support challenges for USDCAD, with sentiment slightly bullish but vulnerable to pullbacks. For the average investor, this means closely monitoring US economic releases and oil price movements to capitalize on trading opportunities and manage risks effectively.

USDCAD Technical & Fundamental Update: Bearish Momentum With Key Support Levels to Watch
30Dec

USDCAD Technical & Fundamental Update: Bearish Momentum With Key Support Levels to Watch

Over the past three trading days, USDCAD has maintained a clear bearish momentum, closing near 1.36886 yesterday. Market sentiment is shaped by a slightly recovering US dollar and rising Canadian oil prices amid Middle East tensions. However, fundamental signals from cooling US inflation data add downward pressure on the USD, resulting in a cautious outlook. For average investors, this means careful entry around the current price level is advised, with close monitoring of technical support and upcoming economic releases that will likely influence short-term movement.

USDCAD Technical & Fundamental Analysis: Clear Bearish Pressure and Key Support Levels to Watch
25Dec

USDCAD Technical & Fundamental Analysis: Clear Bearish Pressure and Key Support Levels to Watch

USDCAD has been trending lower over the past three trading days, closing at 1.36705 yesterday, marking a five-month low. The divergence between the Bank of Canada and Federal Reserve monetary policies is driving recent volatility, with the market increasingly pricing in Fed rate cuts that weigh on the USD. Meanwhile, the Canadian dollar is supported by rising oil prices, contributing to the pair’s downturn. For the average investor, this suggests a weaker greenback environment requiring careful risk management on USD holdings. Market sentiment favors the Loonie strongly this week, and technical patterns indicate bearish momentum, making it critical to monitor key support and resistance levels moving forward.

USDCAD Technical & Fundamental Analysis: Oil Rally Strengthens Loonie Ahead
23Dec

USDCAD Technical & Fundamental Analysis: Oil Rally Strengthens Loonie Ahead

Over the past three trading days, USDCAD has experienced notable volatility driven by a weakening USD and rising oil prices. The pair closed yesterday at 1.37495, reflecting market sensitivity to Canadian economic data and oil market dynamics. Recent market news highlights the ongoing oil price rally boosting the Canadian dollar, placing pressure on the US dollar and influencing USDCAD’s price direction this week. For everyday investors, this means closely monitoring oil trends and key US economic releases is critical for shaping trading strategies. Overall, this week’s market mood is shaped by commodity currency performance and macroeconomic data, with upcoming Canadian GDP and major US datasets expected to provide further guidance for price action.

USDCAD: Key Descending Triangle Tests Resistance at 1.38 with a Cautious Trading Outlook
18Dec

USDCAD: Key Descending Triangle Tests Resistance at 1.38 with a Cautious Trading Outlook

USDCAD has experienced notable volatility over the past three trading days, closing near 1.37833 yesterday. The pair rebounded from a three-month low amid mixed US employment data and a stronger Canadian dollar supported by rising oil prices. Technical price action shows the pair testing the upper boundary of a descending triangle pattern at around 1.38 on the daily chart, indicating clear resistance. Market sentiment reflects uncertainty driven by contrasting US dollar weakness and steady Bank of Canada policy signals. For investors, USDCAD is currently at a critical technical and fundamental juncture, making the next moves near 1.38 and support levels crucial to watch.

USDCAD: Key Support Holds as Critical Technical Patterns Emerge in Trading Outlook
16Dec

USDCAD: Key Support Holds as Critical Technical Patterns Emerge in Trading Outlook

Over the past three trading days, USDCAD experienced initial declines followed by a modest recovery, closing yesterday near 1.37695. Canada’s inflation data remained steady at 2.2%, providing support for the Canadian dollar and stabilizing the pair in the mid 1.37 to 1.38 range. Investors are digesting the steady inflation figures alongside oil price support, resulting in cautious price action. For average investors, the market’s mood is shaped by steady Canadian fundamentals and anticipation of upcoming central bank policy decisions, leading to a watchful waiting approach in trading USDCAD around current levels.

1 3 4 5 6

1uptick Analytics @

Maximize your profit at ease

Risk Warning​

*Investment involves risk. You may use the information, strategies and trading signals on this website for academic and reference purposes at your own discretion. 1uptick cannot and does not guarantee that any current or future buy or sell comments and messages posted on this website/app will be profitable. Past performance is not necessarily indicative of future performance. It is impossible for 1uptick to make such guarantees and users should not make such assumptions. Readers should seek independent professional advice before executing a transaction. 1uptick will not solicit any subscribers or visitors to execute any transactions, and you are responsible for all executed transactions.

© 2022-25 – 1uptick Analytics all rights reserved.


Risk Warning​

*Investment involves risk. You may use the information, strategies and trading signals on this website for academic and reference purposes at your own discretion. 1uptick cannot and does not guarantee that any current or future buy or sell comments and messages posted on this website/app will be profitable. Past performance is not necessarily indicative of future performance. It is impossible for 1uptick to make such guarantees and users should not make such assumptions. Readers should seek independent professional advice before executing a transaction. 1uptick will not solicit any subscribers or visitors to execute any transactions, and you are responsible for all executed transactions.

© 1uptick Analytics all rights reserved.

Home
Analysis
Calendar
Tools
Signals