USDCAD Technical Analysis

Home  Technical Analysis  USDCAD Technical Analysis
USDCAD
USDCAD: Triangular Consolidation Pattern Signals Impending Breakout – Key Support and Resistance Levels, June 9, 2026
09Jun

USDCAD: Triangular Consolidation Pattern Signals Impending Breakout – Key Support and Resistance Levels, June 9, 2026

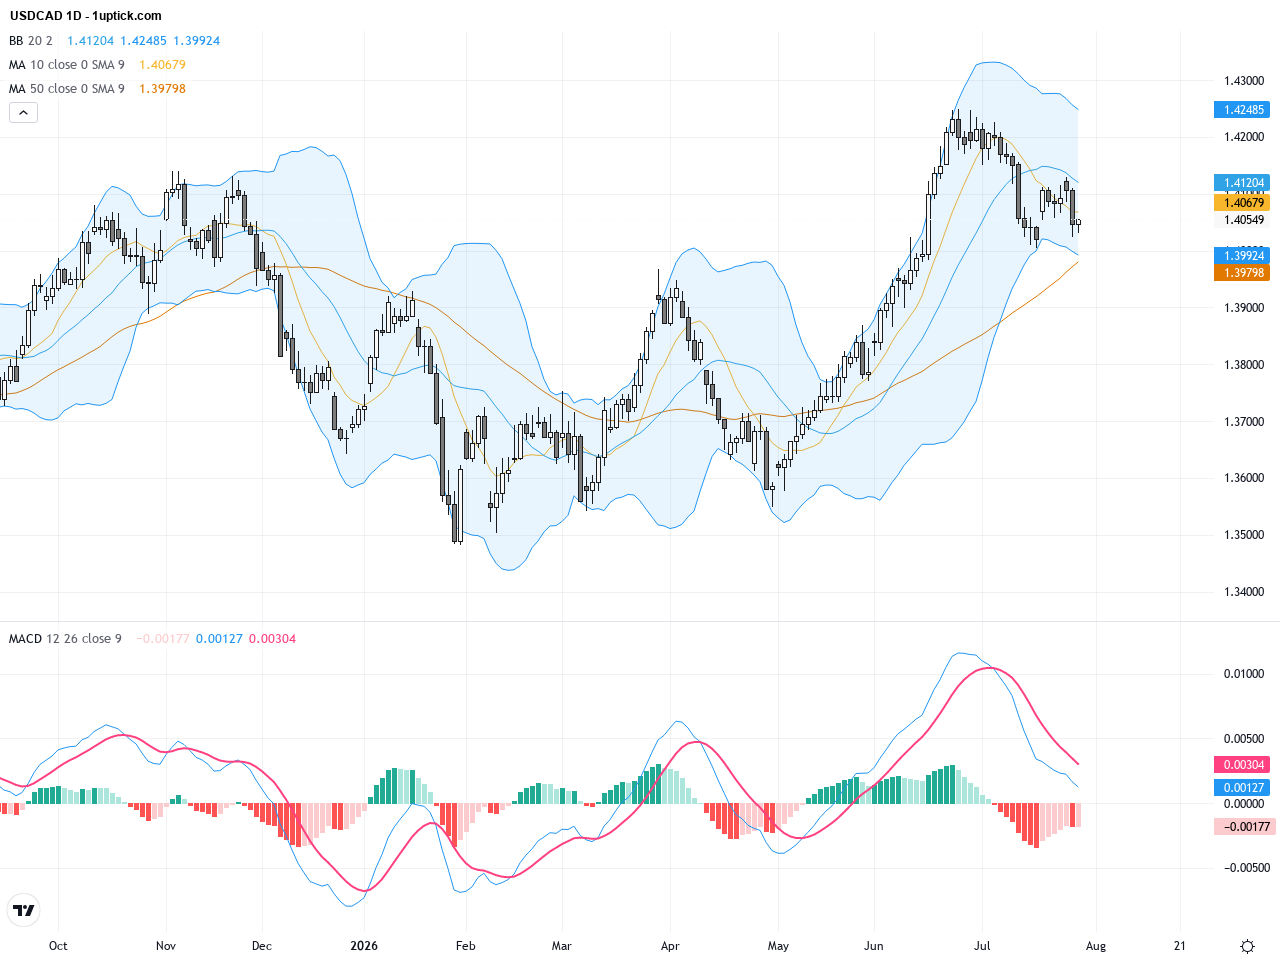
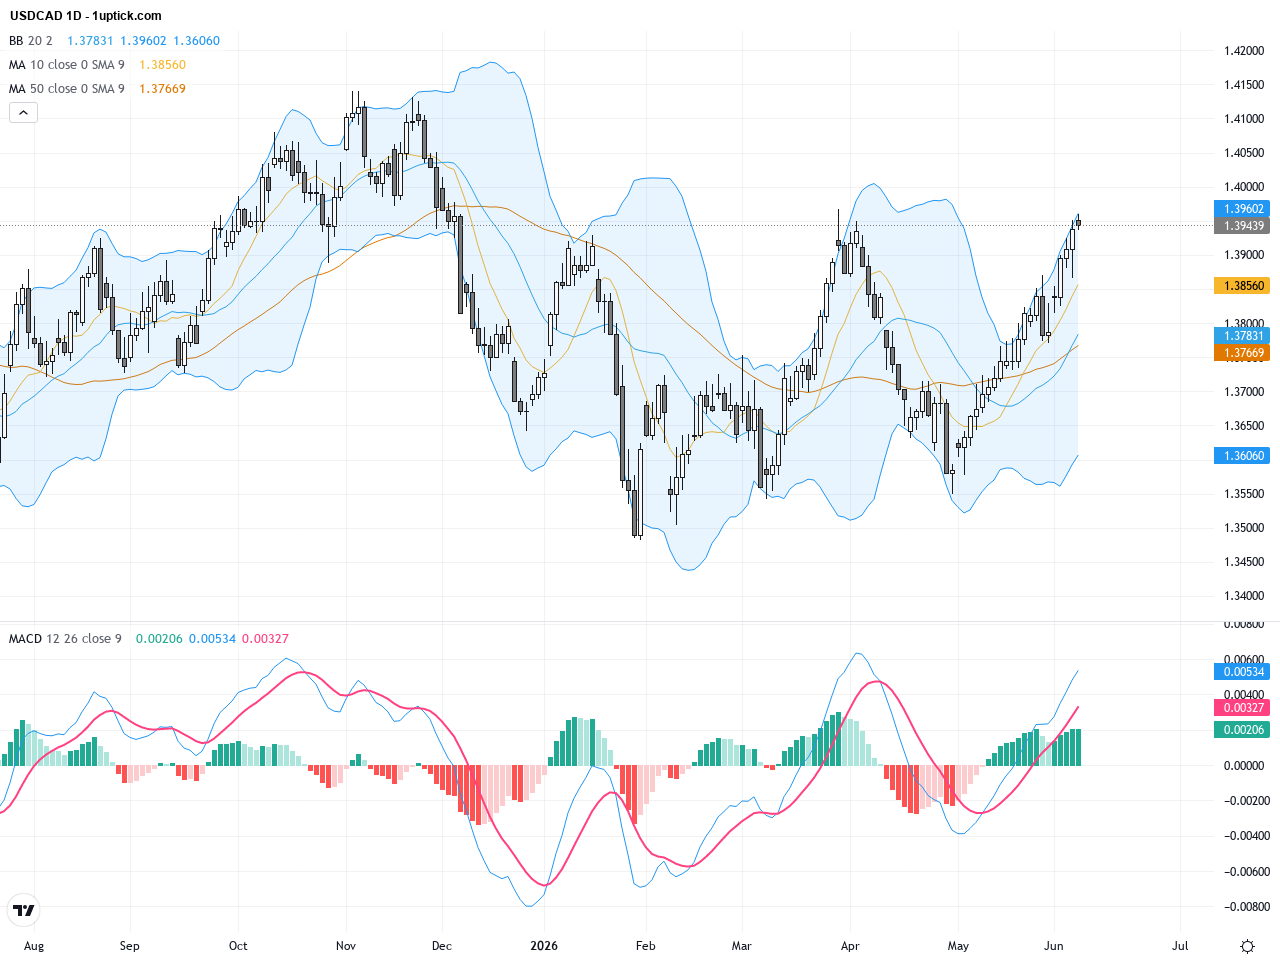
Over the past three trading days, USDCAD has been consolidating below the recent high around 1.3950, closing yesterday near 1.39442 with a slight pullback. The pair edged lower during the Asian session as the Canadian dollar remained pressured by weak oil prices, while the US dollar maintained strength. Market sentiment this week has been influenced by strong US employment data and softer Canadian economic indicators, creating a tug-of-war scenario between the two currencies. For the average investor, USDCAD is like a race where contenders are pausing at a crucial turning point, waiting to see which way momentum breaks. The currency pair’s near-term direction will hinge on future oil price movements and upcoming economic releases from both countries. Investors should remain attentive to these dynamics to seize optimal trading opportunities.
USDCAD Technical Patterns Highlight Turning Point at 1.3900 amid Oil Price Volatility, June 4, 2026
04Jun

USDCAD Technical Patterns Highlight Turning Point at 1.3900 amid Oil Price Volatility, June 4, 2026

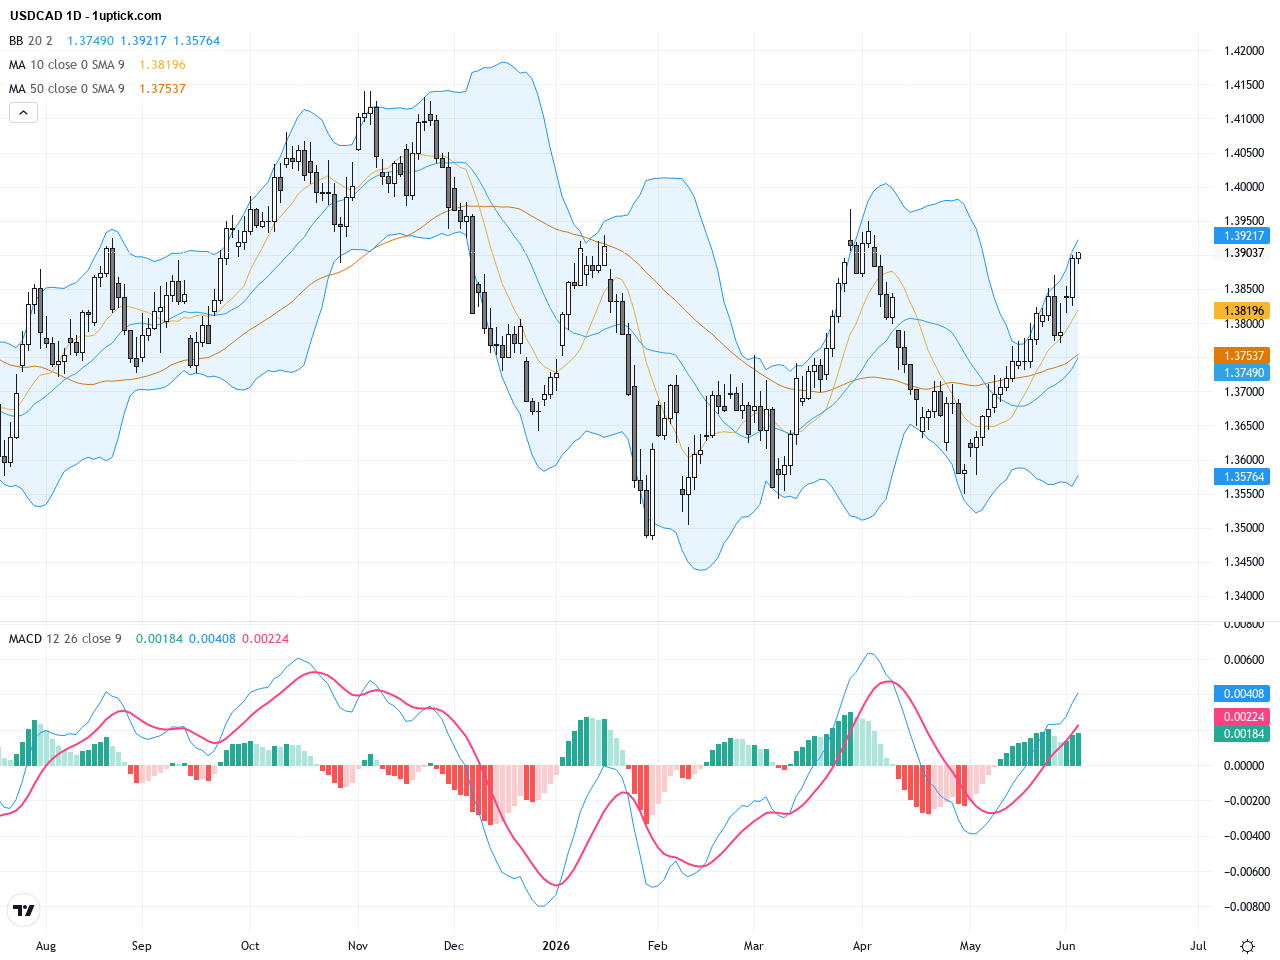
Over the past three trading days, USDCAD has traded within a tight range of 1.3887 to 1.3904, closing yesterday at 1.39037. Despite crude oil prices reaching near two-week highs due to renewed Middle East tensions, the Canadian dollar faces pressure from Canada entering a technical recession after a negative Q1 GDP reading. The US dollar’s safe-haven appeal amid risk-off sentiment has kept USDCAD elevated. For investors, this divergence between oil prices and economic fundamentals signals caution. Key support and resistance levels around 1.3850 and 1.3900, alongside market news and technical patterns, should guide trading decisions in the near term.

USDCAD: Bullish Breakout Above 50-SMA Amid Oil Price Volatility and Safe-Haven Demand, June 2, 2026
02Jun

USDCAD: Bullish Breakout Above 50-SMA Amid Oil Price Volatility and Safe-Haven Demand, June 2, 2026

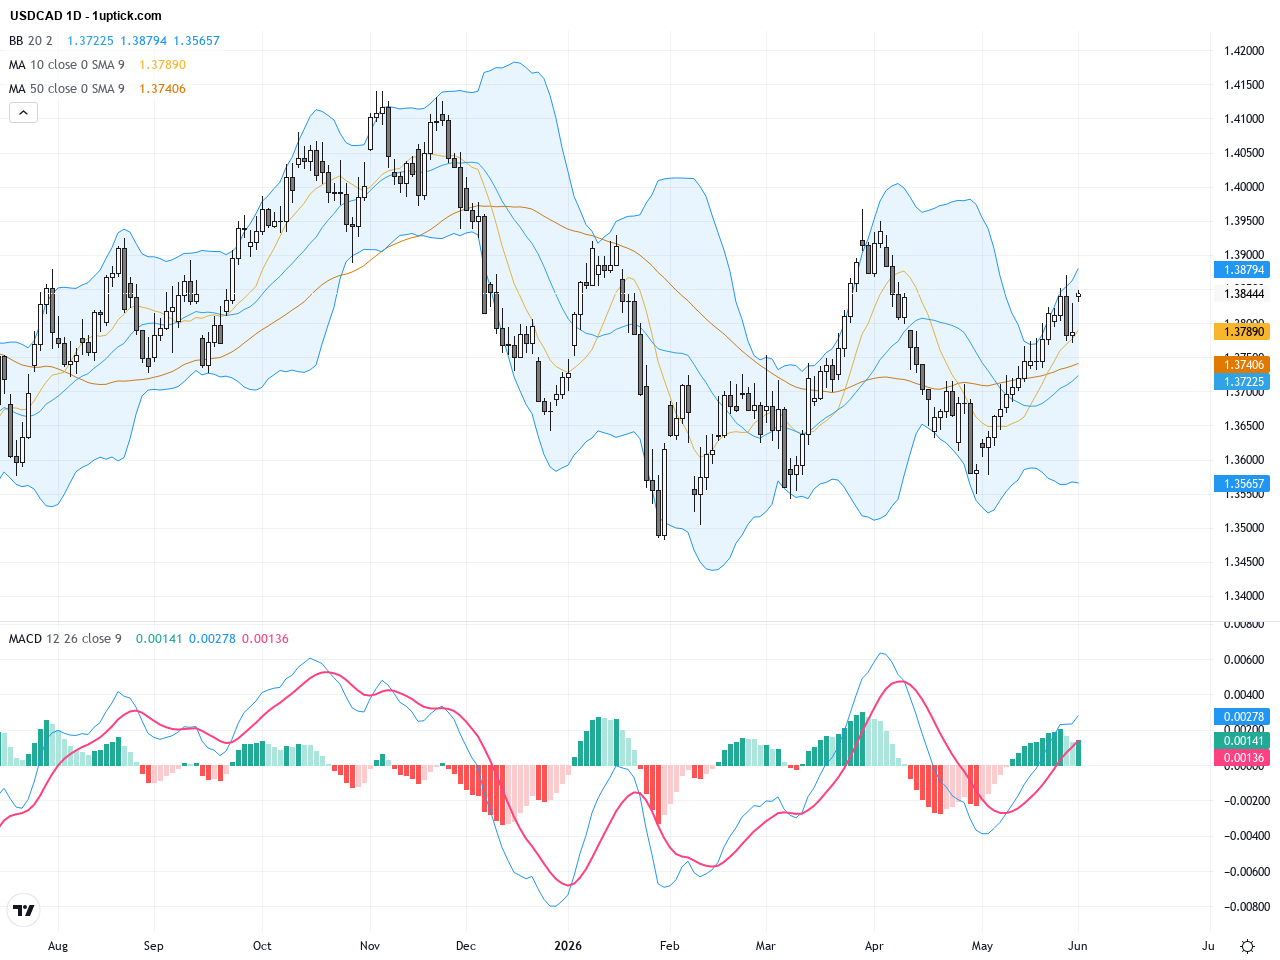
Over the past three trading days, USDCAD has shown notable volatility, closing yesterday at 1.38442. US-Iran ceasefire talks have supported safe-haven demand for the US dollar while oil prices surged due to geopolitical tensions, putting pressure on the Canadian dollar. Market news highlights a continuing cautious rally in the Canadian dollar amid fluctuating oil prices. For average investors, this suggests a trading environment where oil price risks and the US dollar’s safe-haven role play a significant part in USDCAD’s near-term moves.

USDCAD Trading Outlook: Bullish USD Push with Key Resistance Levels in Focus, May 28, 2026
28May

USDCAD Trading Outlook: Bullish USD Push with Key Resistance Levels in Focus, May 28, 2026

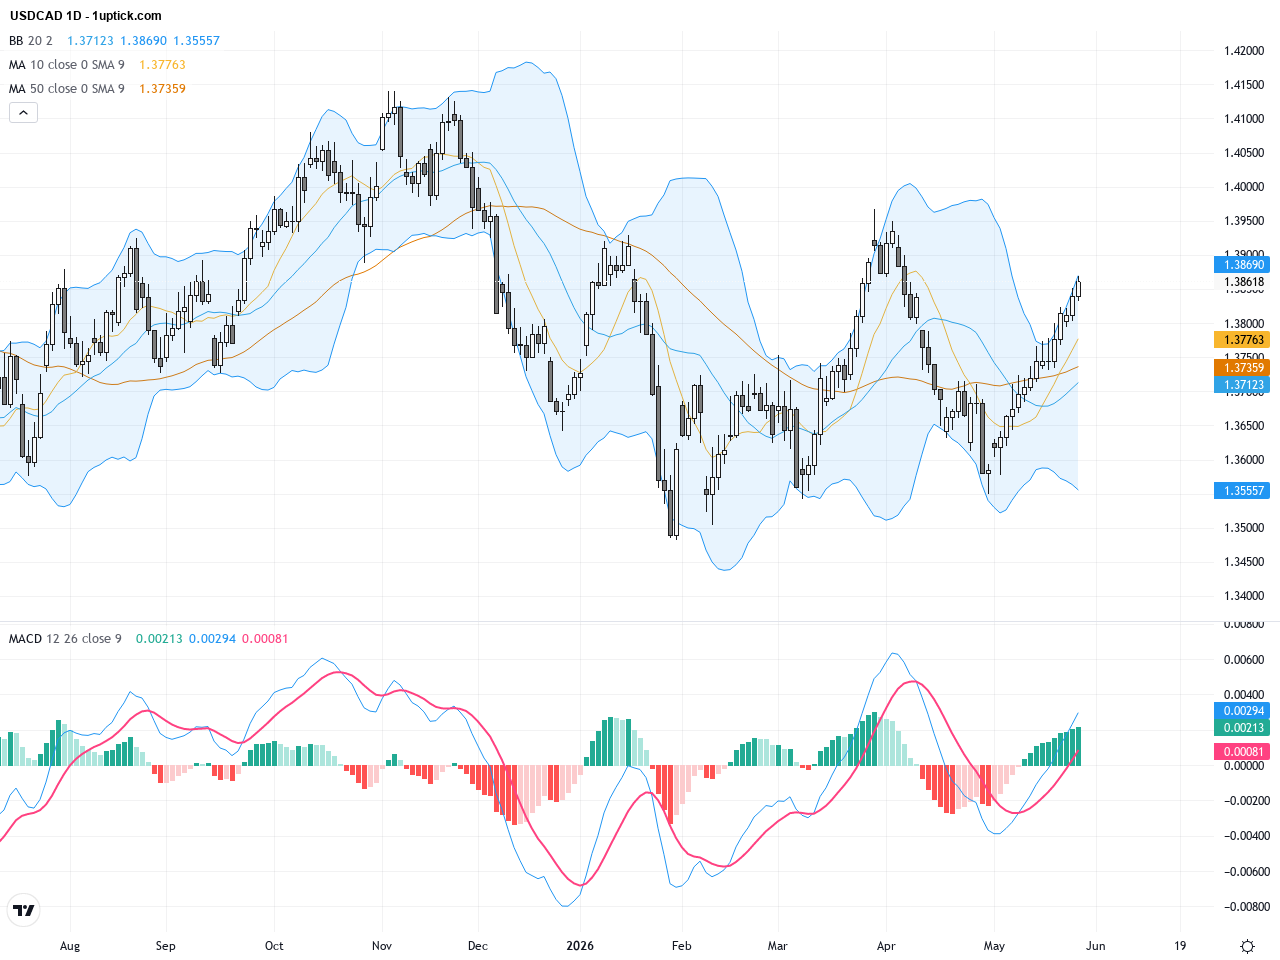
Over the past three trading days, USDCAD hovered around the 1.38 zone before edging up to close yesterday at 1.3861. The market mood was driven by rising U.S. geopolitical tensions, boosting the dollar’s strength. Reports highlight that USD/CAD maintained bids near 1.38 despite oil price fluctuations pressuring the Canadian dollar. For the average investor, this means the USD currently holds an advantage over the CAD, suggesting potential volatility and opportunities in the near term, especially given ongoing geopolitical and commodity price developments.

USDCAD: Key Resistance Tests Set the Tone for Bullish Trading Outlook, May 26, 2026
26May

USDCAD: Key Resistance Tests Set the Tone for Bullish Trading Outlook, May 26, 2026

Over the past three trading days, USDCAD has exhibited moderate volatility, closing yesterday at 1.38112 near this month’s highs. Market sentiment has been influenced by optimism over a potential Iran deal and fluctuating oil prices, boosting the Canadian dollar’s strength against the US dollar. This dynamic drove cautious but optimistic trading behavior. For average investors, this highlights how geopolitical and energy market developments can directly impact currency pairs. Combining recent news and technical analysis, there remains potential for USDCAD to test resistance levels in the near term, urging traders to watch for key momentum signals and market news for precise entry and exit points.

1 2 3 4 5 6 14
USDCAD Trading Outlook: Bullish USD Push with Key Resistance Levels in Focus, May 28, 2026
28May

USDCAD Trading Outlook: Bullish USD Push with Key Resistance Levels in Focus, May 28, 2026

Over the past three trading days, USDCAD hovered around the 1.38 zone before edging up to close yesterday at 1.3861. The market mood was driven by rising U.S. geopolitical tensions, boosting the dollar’s strength. Reports highlight that USD/CAD maintained bids near 1.38 despite oil price fluctuations pressuring the Canadian dollar. For the average investor, this means the USD currently holds an advantage over the CAD, suggesting potential volatility and opportunities in the near term, especially given ongoing geopolitical and commodity price developments.

USDCAD: Key Resistance Tests Set the Tone for Bullish Trading Outlook, May 26, 2026
26May

USDCAD: Key Resistance Tests Set the Tone for Bullish Trading Outlook, May 26, 2026

Over the past three trading days, USDCAD has exhibited moderate volatility, closing yesterday at 1.38112 near this month’s highs. Market sentiment has been influenced by optimism over a potential Iran deal and fluctuating oil prices, boosting the Canadian dollar’s strength against the US dollar. This dynamic drove cautious but optimistic trading behavior. For average investors, this highlights how geopolitical and energy market developments can directly impact currency pairs. Combining recent news and technical analysis, there remains potential for USDCAD to test resistance levels in the near term, urging traders to watch for key momentum signals and market news for precise entry and exit points.

USDCAD: Key 50% Fibonacci Resistance at 1.3755 Emerges as Crucial Trading Barrier, May 19, 2026
19May

USDCAD: Key 50% Fibonacci Resistance at 1.3755 Emerges as Crucial Trading Barrier, May 19, 2026

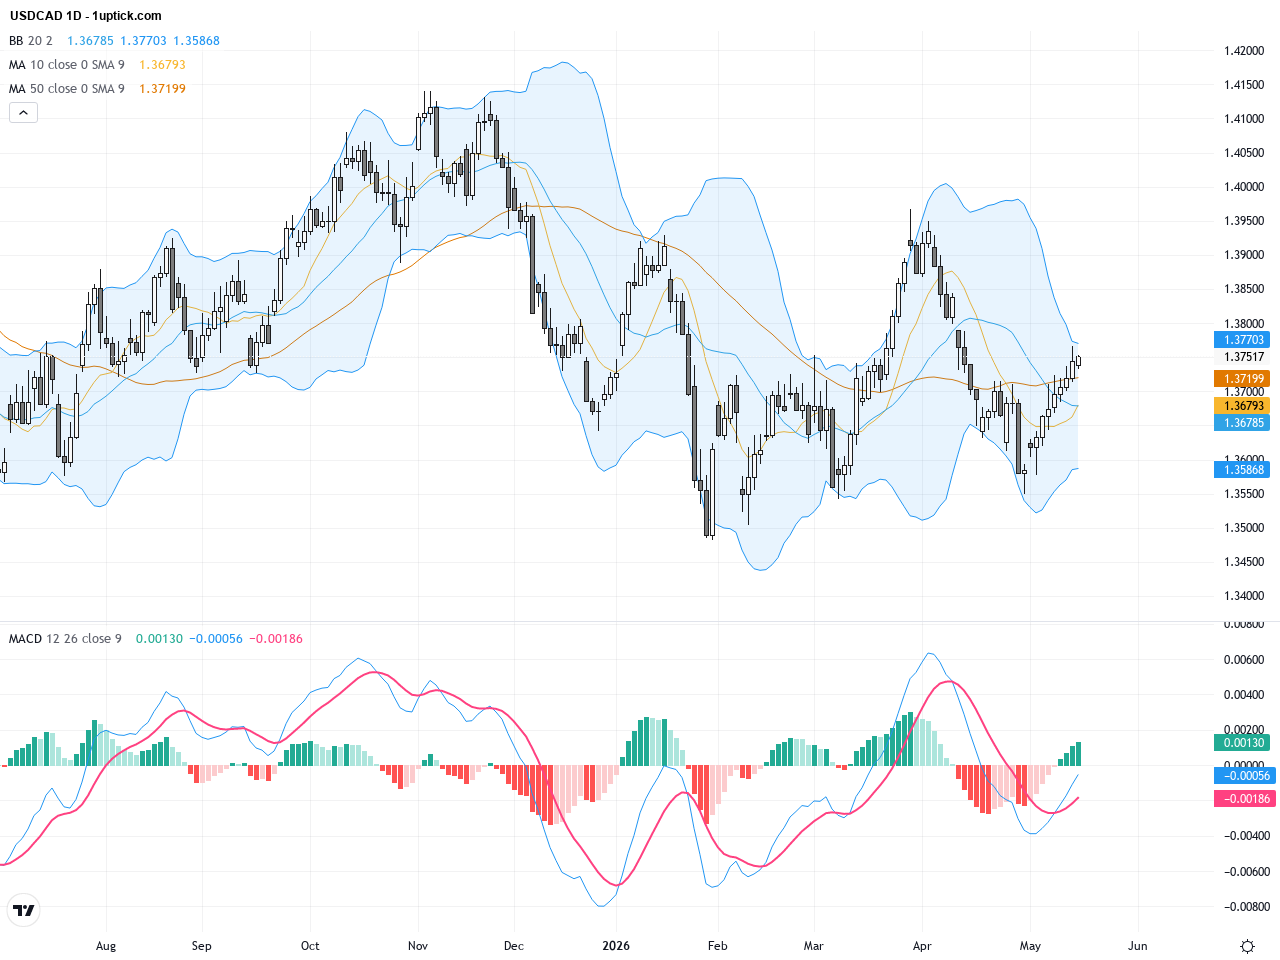
Over the past three trading days, USDCAD has fluctuated between 1.3730 and 1.3752, closing yesterday at 1.37519 with a slight upward bias. The market mood has been shaped by expectations around the Federal Reserve and Bank of Canada policies, with the US dollar remaining robust amidst geopolitical and inflation concerns. Meanwhile, the Canadian dollar has weakened amid rising risk aversion, adding to volatility in the pair. Recent news highlights that USDCAD is near a two-month low, with analysts divided on next moves and the 50% Fibonacci retracement near 1.3755 acting as a critical resistance zone influencing trader psychology. For the average investor, the current price action feels like a tug-of-war at a key inflection point, with amplified short-term swings urging caution. Upcoming economic data and central bank statements will be the key variables to watch for determining USDCAD’s next direction.

USDCAD: Testing Key Resistance as USD/CAD Trading Outlook Remains Cautious, May 14, 2026
14May

USDCAD: Testing Key Resistance as USD/CAD Trading Outlook Remains Cautious, May 14, 2026

Over the past three trading days, USDCAD has hovered around the 1.3700 level, with yesterday’s close at 1.37049. The pair has experienced subdued volatility amid broad USD strength and cautious market sentiment ahead of the US-China summit. Investors seem to be in a wait-and-see mode, akin to watching a traffic light before proceeding. Technically, USDCAD is testing crucial resistance zones; a breakout may signal fresh upside momentum, while a rejection could open the door for downside risks. This balanced scenario reflects ongoing uncertainty, creating both opportunities and challenges for traders.

USDCAD Trading Outlook: Four-Day Rally Pushes Price Near Key 1.37 Resistance Amid Oil and Safe-Haven Demand, May 12, 2026
12May

USDCAD Trading Outlook: Four-Day Rally Pushes Price Near Key 1.37 Resistance Amid Oil and Safe-Haven Demand, May 12, 2026

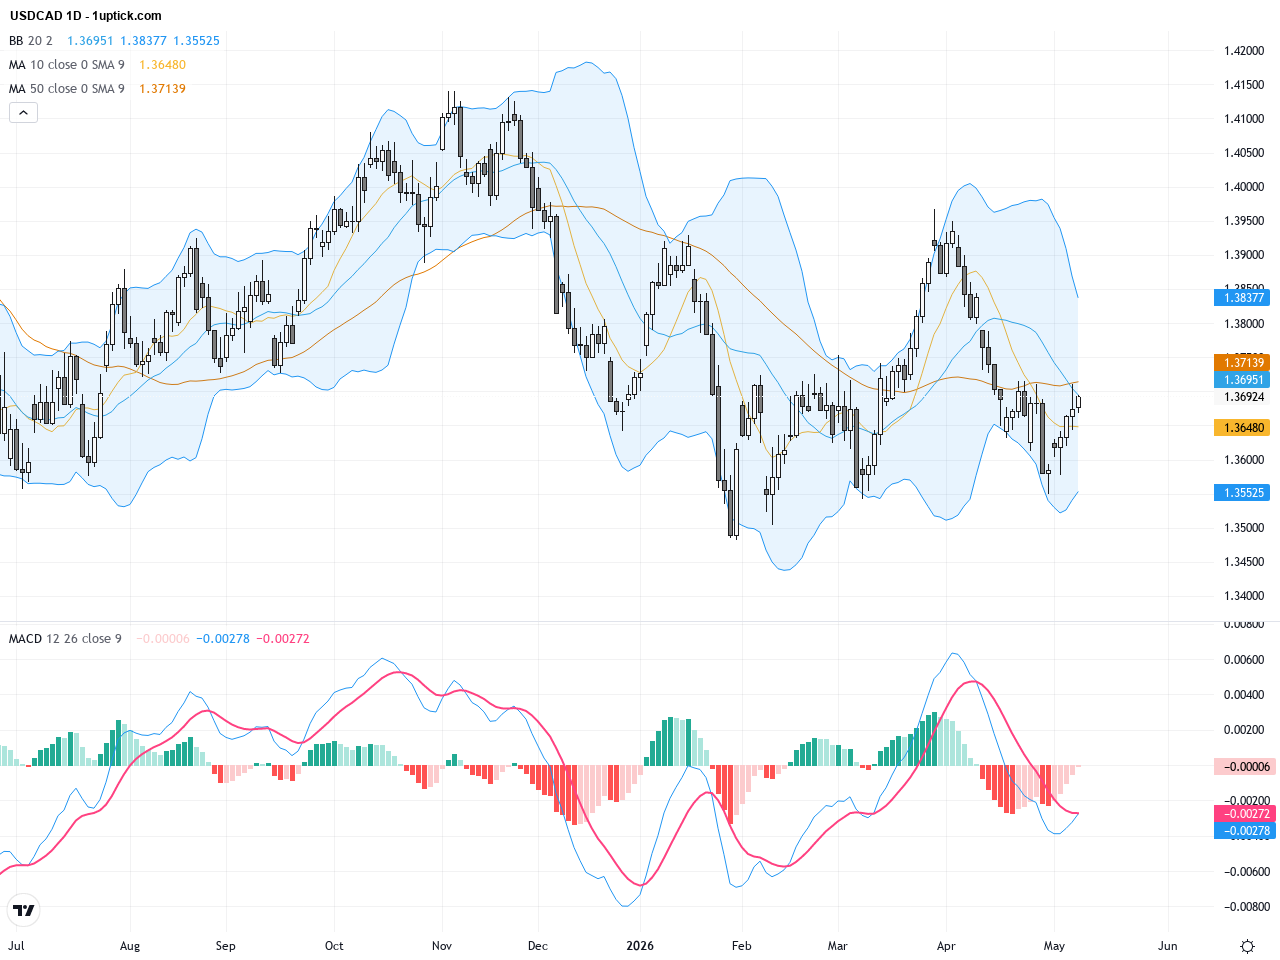
Over the past three trading days, USDCAD has displayed a strong upward momentum, closing yesterday at 1.36922, just shy of the critical 1.37 resistance level. The Canadian dollar remains pressured by safe-haven demand for the US dollar amid geopolitical tensions, while fluctuating oil prices are also influencing the pair’s movement. Recent Canadian employment data showed unexpected weakness, further weighing on the loonie. For investors, the dominant themes driving market sentiment include global risk-off sentiment and commodity price swings. With important US consumer inflation data ahead, traders should closely monitor these factors for upcoming trading opportunities in USDCAD.

USDCAD: Key Technical Breakout Amid Weak Canadian Jobs Data – Trading Outlook, May 9, 2026
09May

USDCAD: Key Technical Breakout Amid Weak Canadian Jobs Data – Trading Outlook, May 9, 2026

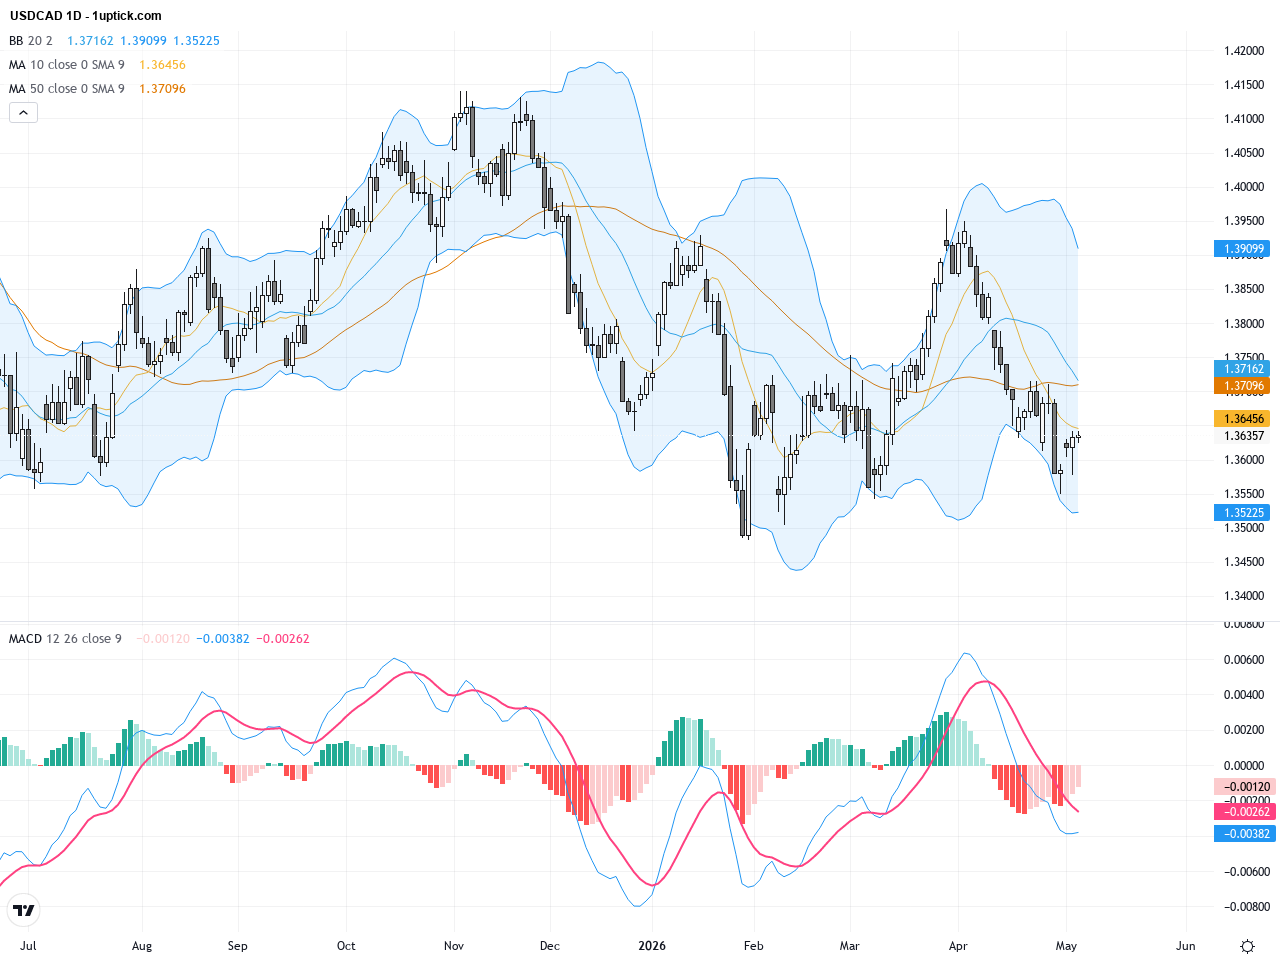
Over the past three trading days, USDCAD has shown an upward momentum, closing yesterday at 1.36357, slightly above previous close. Weak Canadian employment data recently pressured the loonie, giving the USD some strength against CAD. Additionally, a sharp dip in oil prices intensified concerns about the Canadian dollar’s weakening. These fundamental factors reinforced bullish sentiment for USD/CAD and shaped recent price moves. For the average investor, this signals increased risk for Canadian dollar assets and calls for close monitoring of Canadian economic data and oil price movements.

1 2 3 4 5 6 12

1uptick Analytics @

Risk Warning​

*Investment involves risk. You may use the information, strategies and trading signals on this website for academic and reference purposes at your own discretion. 1uptick cannot and does not guarantee that any current or future buy or sell comments and messages posted on this website/app will be profitable. Past performance is not necessarily indicative of future performance. It is impossible for 1uptick to make such guarantees and users should not make such assumptions. Readers should seek independent professional advice before executing a transaction. 1uptick will not solicit any subscribers or visitors to execute any transactions, and you are responsible for all executed transactions.

© 2022-26 1uptick Analytics all rights reserved.


Risk Warning​

*Investment involves risk. You may use the information, strategies and trading signals on this website for academic and reference purposes at your own discretion. 1uptick cannot and does not guarantee that any current or future buy or sell comments and messages posted on this website/app will be profitable. Past performance is not necessarily indicative of future performance. It is impossible for 1uptick to make such guarantees and users should not make such assumptions. Readers should seek independent professional advice before executing a transaction. 1uptick will not solicit any subscribers or visitors to execute any transactions, and you are responsible for all executed transactions.

© 1uptick Analytics all rights reserved.

Home
.AI
Analysis
Calendar
Tools