XAUUSD Technical Analysis

Home  Technical Analysis  XAUUSD Technical Analysis
XAUUSD
XAUUSD Technical Breakdown and Trading Outlook Amid CPI Pressure, June 12, 2026
12Jun

XAUUSD Technical Breakdown and Trading Outlook Amid CPI Pressure, June 12, 2026

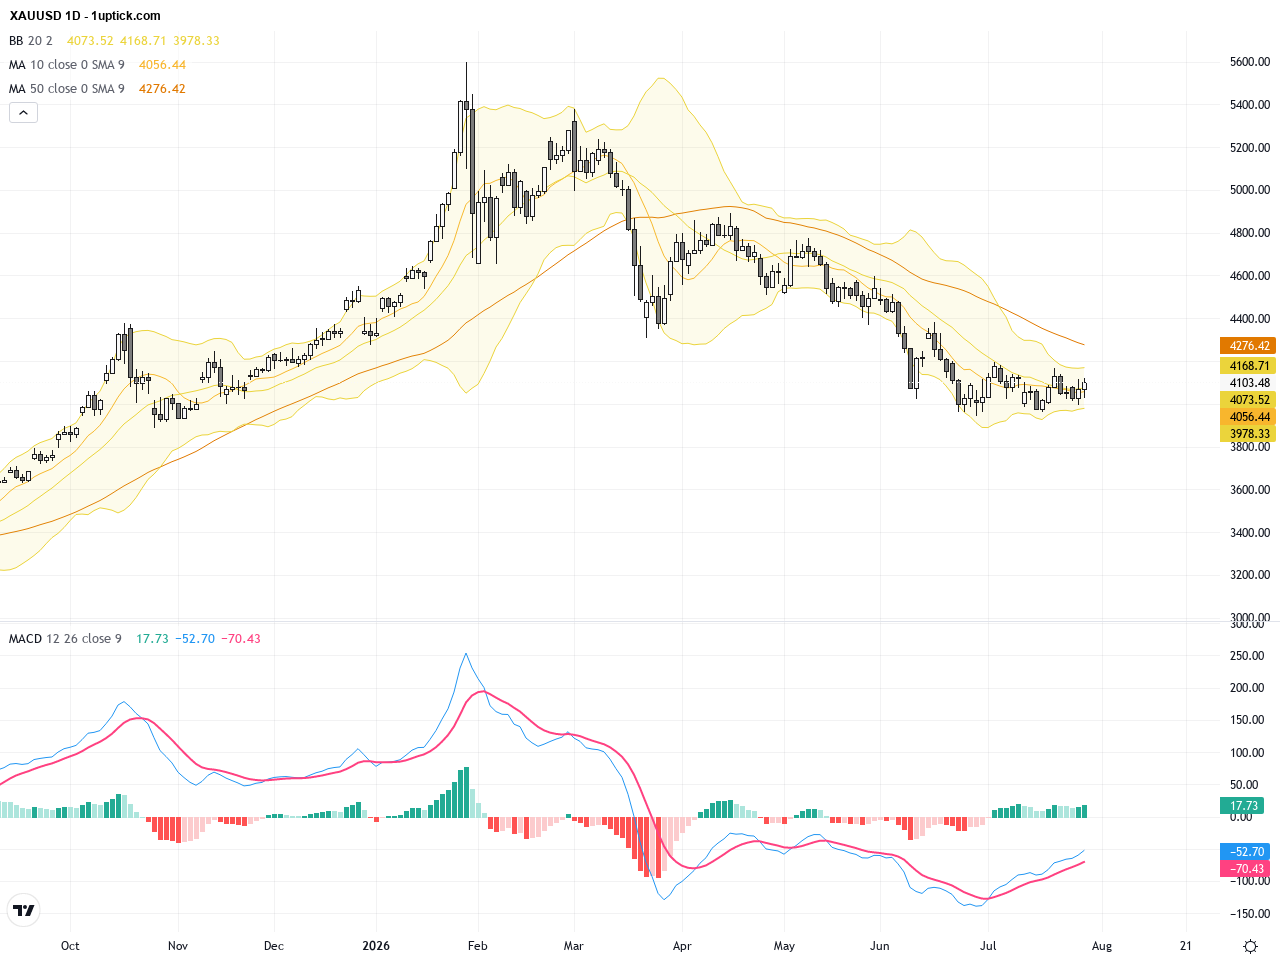
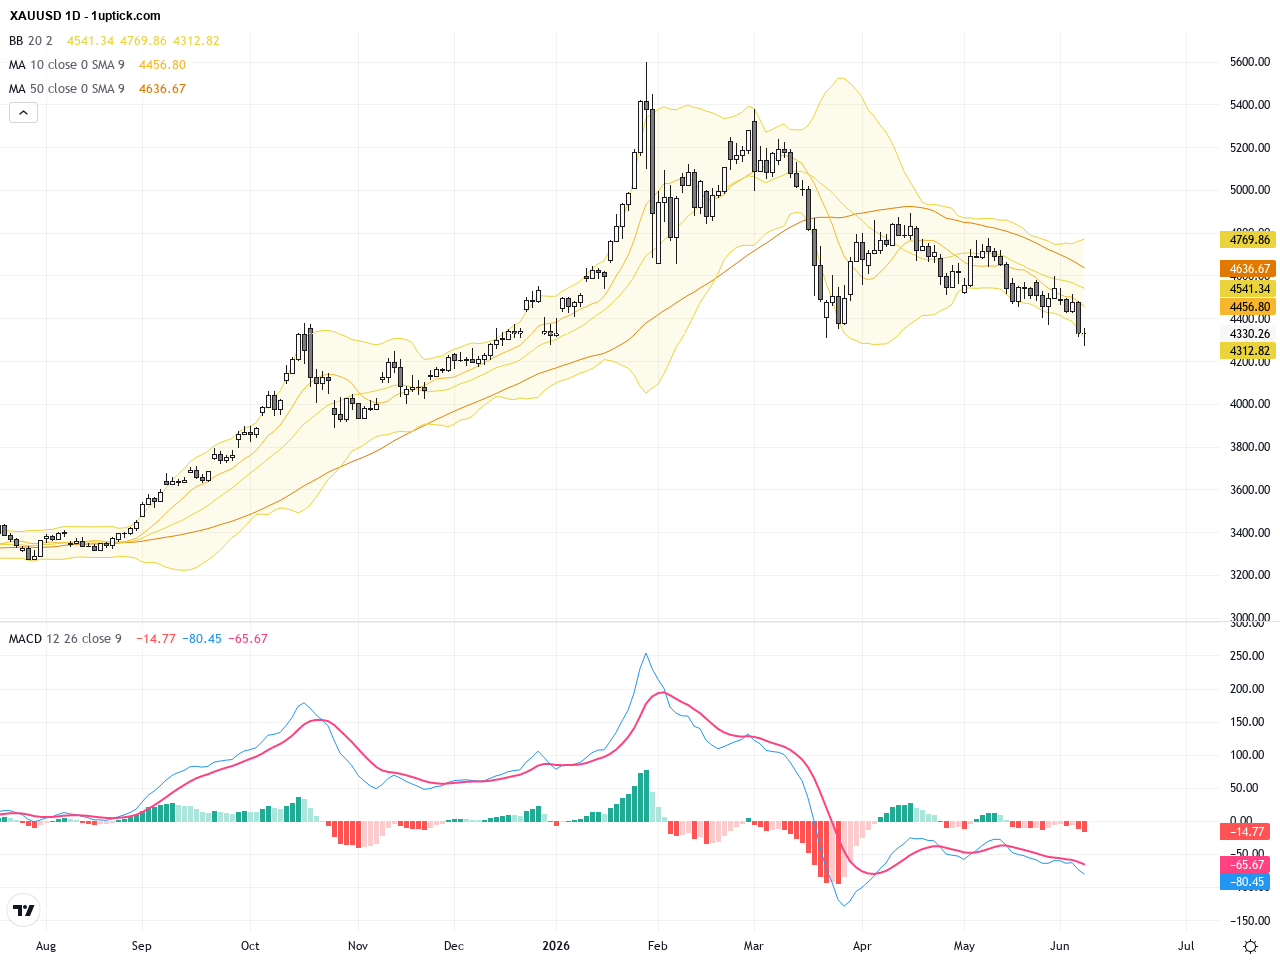
Over the past three trading days, XAUUSD has experienced notable volatility, dropping from around 4260 on June 9th to closing near 4212 on June 11th. This movement reflects strong market responses to recent inflation data and Federal Reserve rate hike expectations. Although a temporary ceasefire in the Middle East bolstered gold’s safe-haven appeal, stronger US dollar momentum driven by mixed-but-hot CPI data limited gold’s upside potential. For average investors, the gold market currently faces a consolidation phase with heightened uncertainty. Traders should monitor critical support and resistance levels closely, alongside upcoming US economic data releases that could sway prices in the near term.

XAUUSD: Gold Price Breaks Key Support Awaiting US CPI for Direction, June 11, 2026
11Jun

XAUUSD: Gold Price Breaks Key Support Awaiting US CPI for Direction, June 11, 2026

Over the past three trading days, XAUUSD has seen sharp volatility, dropping from around 4330 USD on June 8 to close at 4067 USD yesterday (June 10), a decline exceeding 6%. This plunge was driven primarily by robust US Nonfarm Payroll data that crushed expectations for Fed rate cuts, bolstering the US dollar and pressuring gold. The market’s focus shifts to this week’s upcoming US Consumer Price Index (CPI) report, which is expected to heavily influence rate hike expectations and thus gold’s next move. For investors, the current gold market highlights the sensitivity to economic data releases — any surprises in inflation figures could provoke significant price swings, emphasizing the need for caution in positioning.

XAUUSD: Gold Attempts Rebound After Sell-Off, Key Support and Resistance Levels Identified, June 9, 2026
09Jun

XAUUSD: Gold Attempts Rebound After Sell-Off, Key Support and Resistance Levels Identified, June 9, 2026

Over the past three trading days, XAUUSD (gold) experienced notable volatility influenced by strong US employment data lifting Fed rate hike probabilities and escalating geopolitical tensions in the Middle East. Closing at 4327.525 on June 8, 2026, gold hit a two-month low, breaking below its 200-day moving average, signaling short-term bearish pressure. However, signs of a rebound attempt have emerged, reflecting investors’ response to heightened uncertainty. For the average investor, the market grapples with rising interest rates and inflation fears while geopolitical risks continue to create a volatile backdrop. Upcoming US CPI and PPI reports will be crucial in shaping gold’s next directional move.

XAUUSD: Gold Price Under Pressure Amid Hawkish Fed Bets with Key Technical Patterns Emerging, June 6, 2026
06Jun

XAUUSD: Gold Price Under Pressure Amid Hawkish Fed Bets with Key Technical Patterns Emerging, June 6, 2026

Over the past three trading days, XAUUSD (Gold) experienced sharp volatility, plunging from highs near 4487 to close around 4327 yesterday. The market reacted strongly to upbeat U.S. Non-Farm Payroll data, which fueled expectations of further Fed rate hikes, pressuring gold prices downward. Additionally, a stronger U.S. dollar and rising oil prices exacerbated the outflow from safe-haven assets. For everyday investors, this means heightened short-term risks when trading gold; however, long-term prospects remain cautiously optimistic given ongoing inflation and geopolitical uncertainties fueling volatility opportunities.

XAUUSD Gold Trading Outlook: Rebound Amid Oil Price Retreat with Key Technical Patterns, June 5, 2026
05Jun

XAUUSD Gold Trading Outlook: Rebound Amid Oil Price Retreat with Key Technical Patterns, June 5, 2026

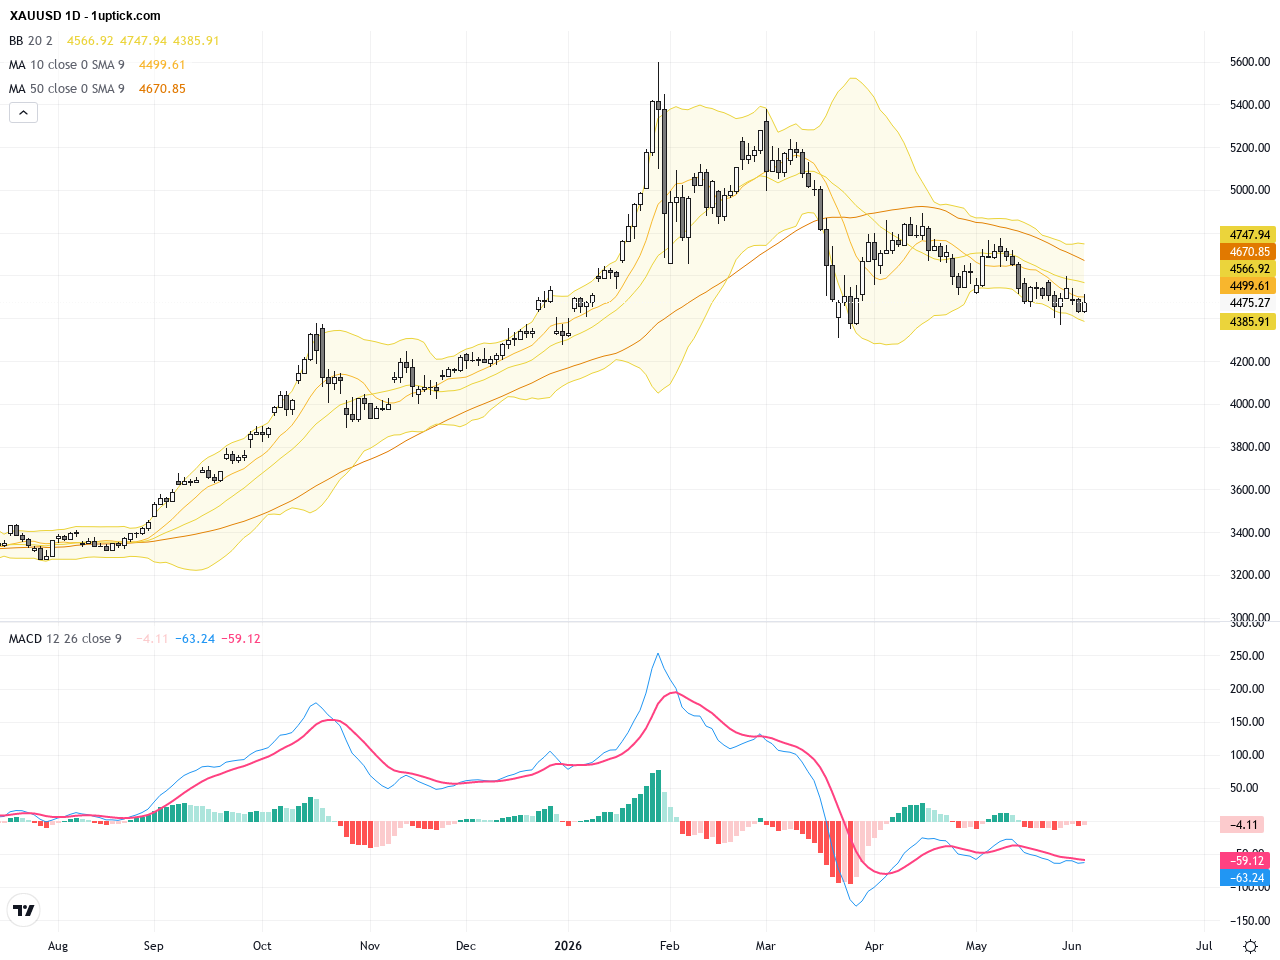
Over the past three trading days, XAUUSD has shown a rebound trend, closing around 4475 on June 4, 2026. Market sentiment was influenced by a 3.3% retreat in crude oil prices, easing inflation concerns but geopolitical tensions remain a complex factor. A European Central Bank report highlights gold’s overtaking of US Treasurys as the world’s top central bank reserve asset, supporting a bullish long-term narrative. Investors are balancing inflation and interest rate expectations, leading to heightened attention on XAUUSD price actions. This scenario mirrors an investor seeking safe haven in an uncertain economic and geopolitical environment, recommending close monitoring of key technical and news developments.

1 3 4 5 6 7 18
XAUUSD Gold Trading Outlook: Rebound Amid Oil Price Retreat with Key Technical Patterns, June 5, 2026
05Jun

XAUUSD Gold Trading Outlook: Rebound Amid Oil Price Retreat with Key Technical Patterns, June 5, 2026

Over the past three trading days, XAUUSD has shown a rebound trend, closing around 4475 on June 4, 2026. Market sentiment was influenced by a 3.3% retreat in crude oil prices, easing inflation concerns but geopolitical tensions remain a complex factor. A European Central Bank report highlights gold’s overtaking of US Treasurys as the world’s top central bank reserve asset, supporting a bullish long-term narrative. Investors are balancing inflation and interest rate expectations, leading to heightened attention on XAUUSD price actions. This scenario mirrors an investor seeking safe haven in an uncertain economic and geopolitical environment, recommending close monitoring of key technical and news developments.

XAUUSD Gold Technical Patterns Highlight Opportunity Amid Oil, Yields, and Dollar Retreat, June 4, 2026
04Jun

XAUUSD Gold Technical Patterns Highlight Opportunity Amid Oil, Yields, and Dollar Retreat, June 4, 2026

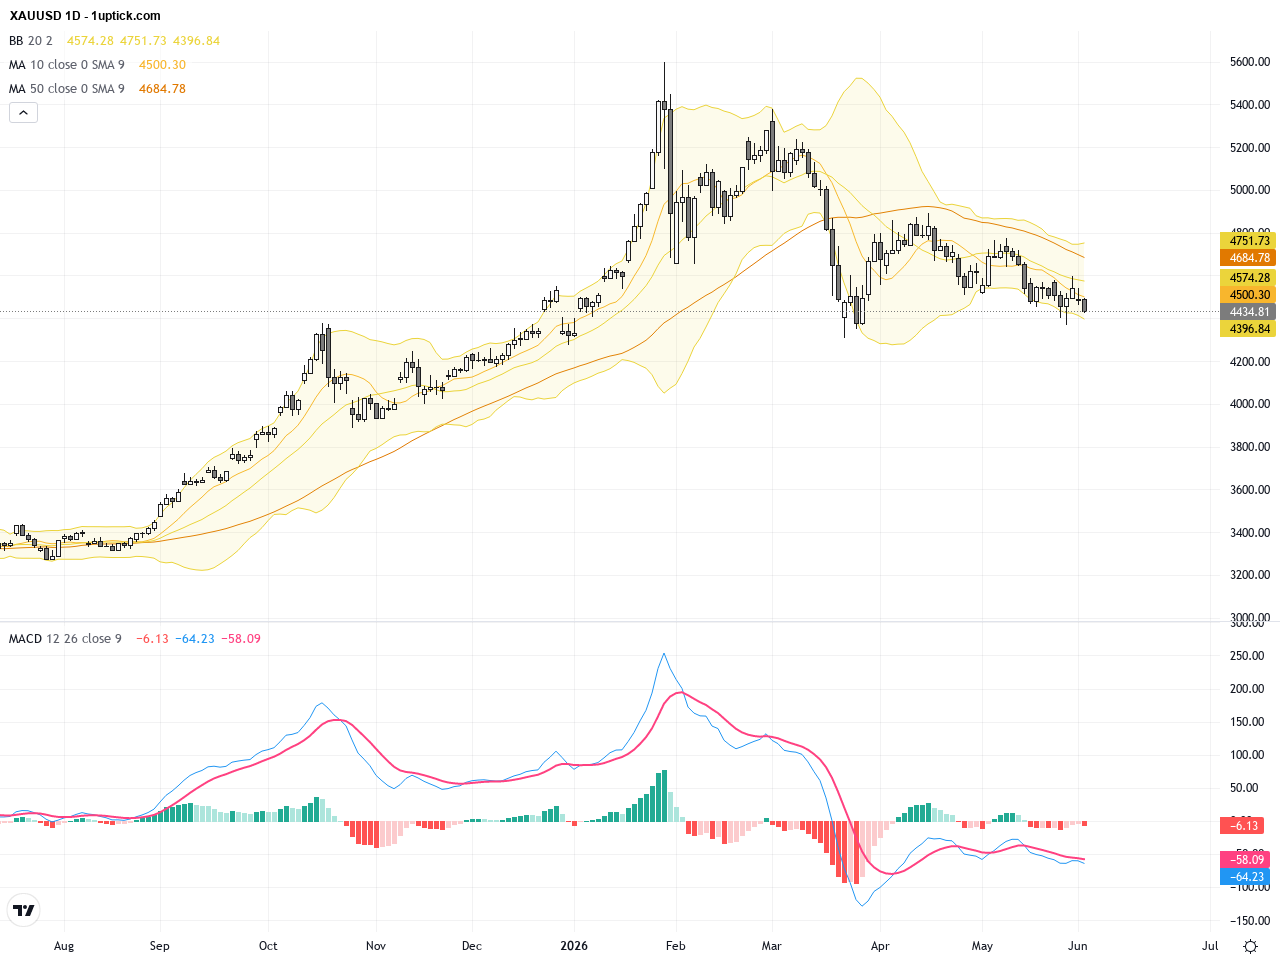
Over the past three trading days, XAUUSD experienced heightened volatility, retreating from above $4,520 to close at $4,431. Recent market action reflects an improved gold outlook driven by falling oil prices, declining bond yields, and a weakening US dollar. Optimism over a potential peace deal in Iran has further pressured the dollar, providing tailwinds for gold, which hovered around $4,470. For the average investor, this signals a strengthening hedge demand and renewed attractiveness of gold as a store of value. Attention is now focused on the upcoming US jobs report, expected to be a key catalyst influencing short-term price fluctuations. Traders should monitor developments closely to capture optimal entry and exit points.

XAUUSD: Key Technical Patterns and Market News Driving Gold Price This Week, June 2, 2026
02Jun

XAUUSD: Key Technical Patterns and Market News Driving Gold Price This Week, June 2, 2026

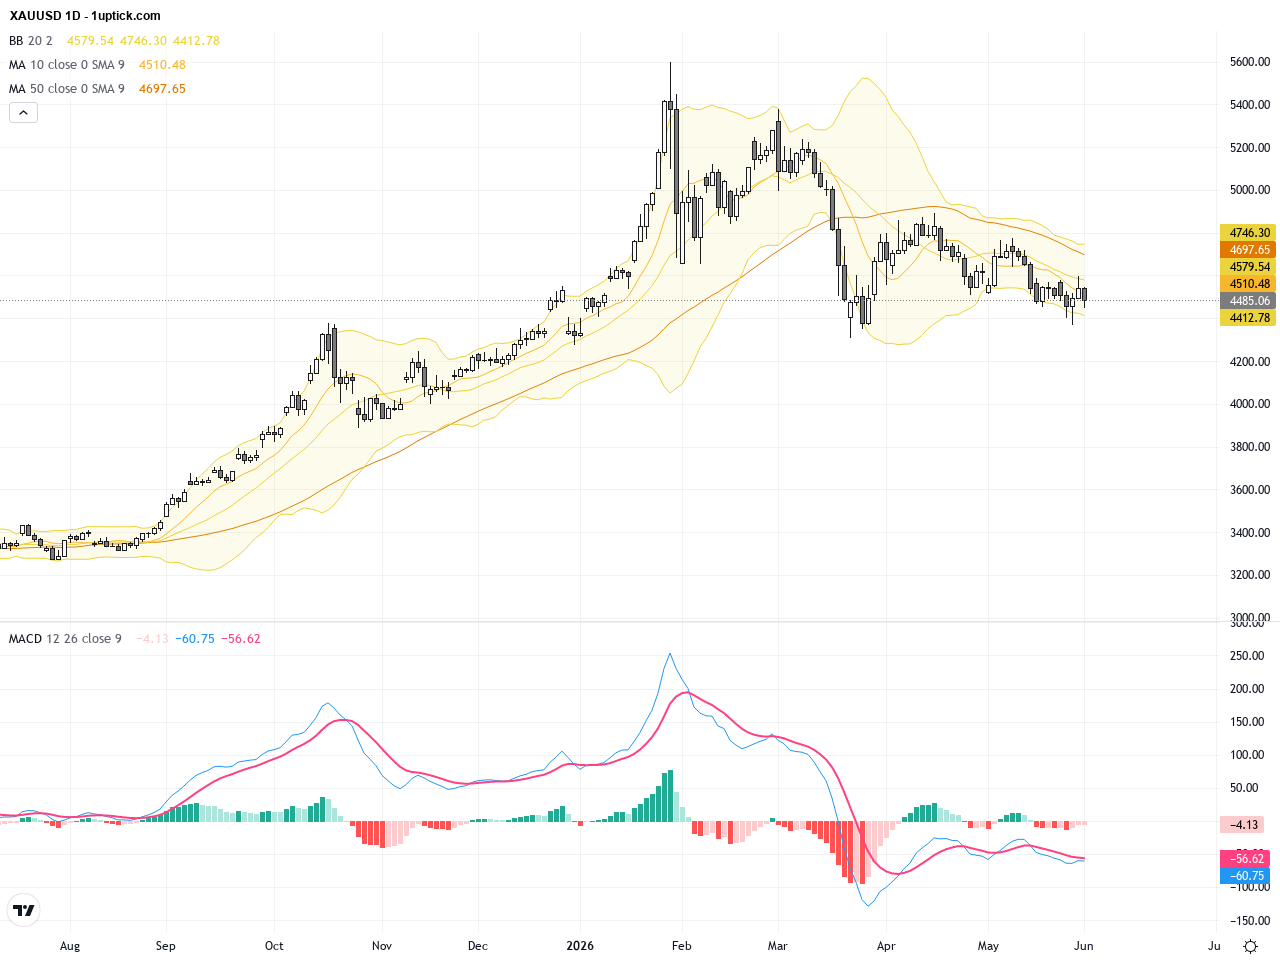
Over the past three trading days, XAUUSD has retreated from recent highs near 4558 down to a close around 4483, reflecting investor concerns over rising US Treasury yields. Recent market news highlights how climbing oil prices and Fed rate hike expectations have pressured gold, although optimism over the US-Iran ceasefire and weaker US inflation data provided some short-term relief. This volatile action underscores a pivotal juncture where fundamental and technical factors combine, giving investors an actionable perspective on gold’s near-term outlook amid geopolitical and economic uncertainty. Overall, gold remains attractive as a safe haven but faces short-term consolidation pressures.

XAUUSD Gold: Bullish Reversal at 200-Day MA Highlights Key Support and Trading Outlook, May 29, 2026
29May

XAUUSD Gold: Bullish Reversal at 200-Day MA Highlights Key Support and Trading Outlook, May 29, 2026

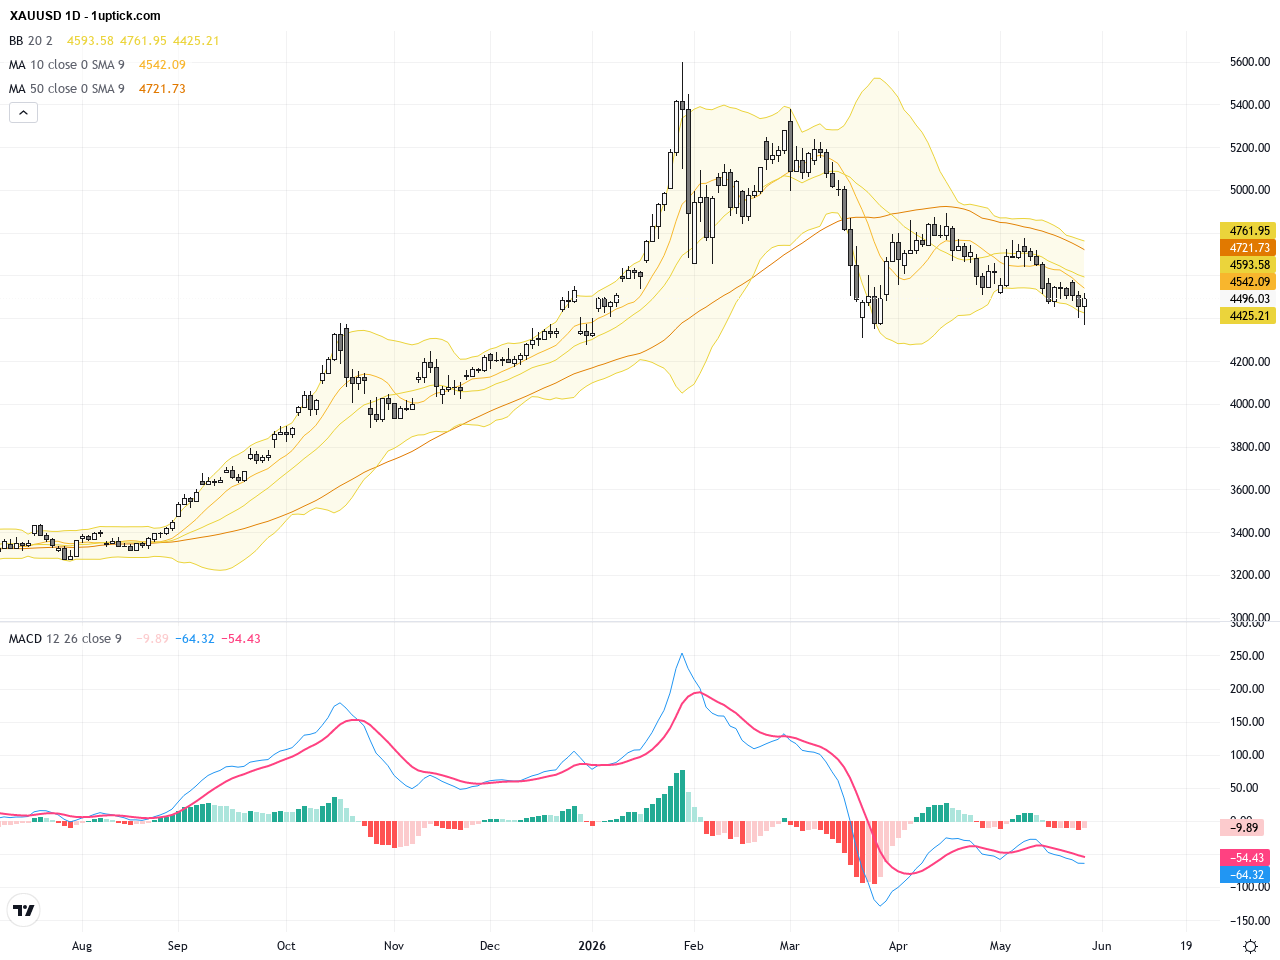
Over the past three trading days, XAUUSD (Gold) exhibited significant volatility, rebounding from a two-month low to close at 4495.765 USD. The recent price action was driven by weaker than expected US GDP data, which revitalized bullish sentiment as the 200-day moving average (MA) provided key support. While a stronger dollar and higher yields exerted pressure, hopeful geopolitical developments and easing inflation fears gave gold a short-term boost. For the average investor, this movement highlights how fundamental economic data and geopolitical events directly impact gold prices, reinforcing gold’s role as a safe haven in uncertain times.

XAUUSD Gold Price: Breaking Bear Market Line and Key Technical Patterns for Trading Outlook, May 28, 2026
28May

XAUUSD Gold Price: Breaking Bear Market Line and Key Technical Patterns for Trading Outlook, May 28, 2026

Over the past three trading days, XAUUSD has experienced significant volatility, closing yesterday at 4454.47 USD, a sharp drop from the previous day. The market sentiment has been pressured by a stronger dollar, rising bond yields, and Fed rate hike expectations, driving gold prices to a two-month low. Meanwhile, easing geopolitical tensions in the Middle East have reduced the risk premium on gold. For the average investor, this means the traditional safe-haven asset is under strain amid strong USD and higher interest rates, likely maintaining short-term volatility. Recent news, such as ‘XAUUSD Breaks Bear Market Line as Dollar and Yields Firm,’ highlights sustained downside pressure ahead. Coupled with upcoming US economic data and Fed speeches, gold trading remains uncertain.

XAUUSD: Gold Holds Firm on Geopolitical Hopes with Key Technical Support in Play, May 26, 2026
26May

XAUUSD: Gold Holds Firm on Geopolitical Hopes with Key Technical Support in Play, May 26, 2026

Over the past three trading days, XAUUSD (Gold) has displayed a steady upward trajectory, closing at 4570.32 yesterday, breaking out of the recent consolidation phase. Uplift came on the back of US-Iran peace hopes, which weakened the dollar and lifted gold by over 1.2%, sparking a positive market mood. Despite Fed’s possible rate hike delay, gold remains buoyed by geopolitical risks and a softer dollar, enticing investors seeking inflation hedges and safe-haven assets. For everyday investors, this signals that gold’s appeal as a safety net prevails amid easing Middle East tensions and ongoing market volatility.

1 3 4 5 6 7 15

1uptick Analytics @

Risk Warning​

*Investment involves risk. You may use the information, strategies and trading signals on this website for academic and reference purposes at your own discretion. 1uptick cannot and does not guarantee that any current or future buy or sell comments and messages posted on this website/app will be profitable. Past performance is not necessarily indicative of future performance. It is impossible for 1uptick to make such guarantees and users should not make such assumptions. Readers should seek independent professional advice before executing a transaction. 1uptick will not solicit any subscribers or visitors to execute any transactions, and you are responsible for all executed transactions.

© 2022-26 1uptick Analytics all rights reserved.


Risk Warning​

*Investment involves risk. You may use the information, strategies and trading signals on this website for academic and reference purposes at your own discretion. 1uptick cannot and does not guarantee that any current or future buy or sell comments and messages posted on this website/app will be profitable. Past performance is not necessarily indicative of future performance. It is impossible for 1uptick to make such guarantees and users should not make such assumptions. Readers should seek independent professional advice before executing a transaction. 1uptick will not solicit any subscribers or visitors to execute any transactions, and you are responsible for all executed transactions.

© 1uptick Analytics all rights reserved.

Home
.AI
Analysis
Calendar
Tools