
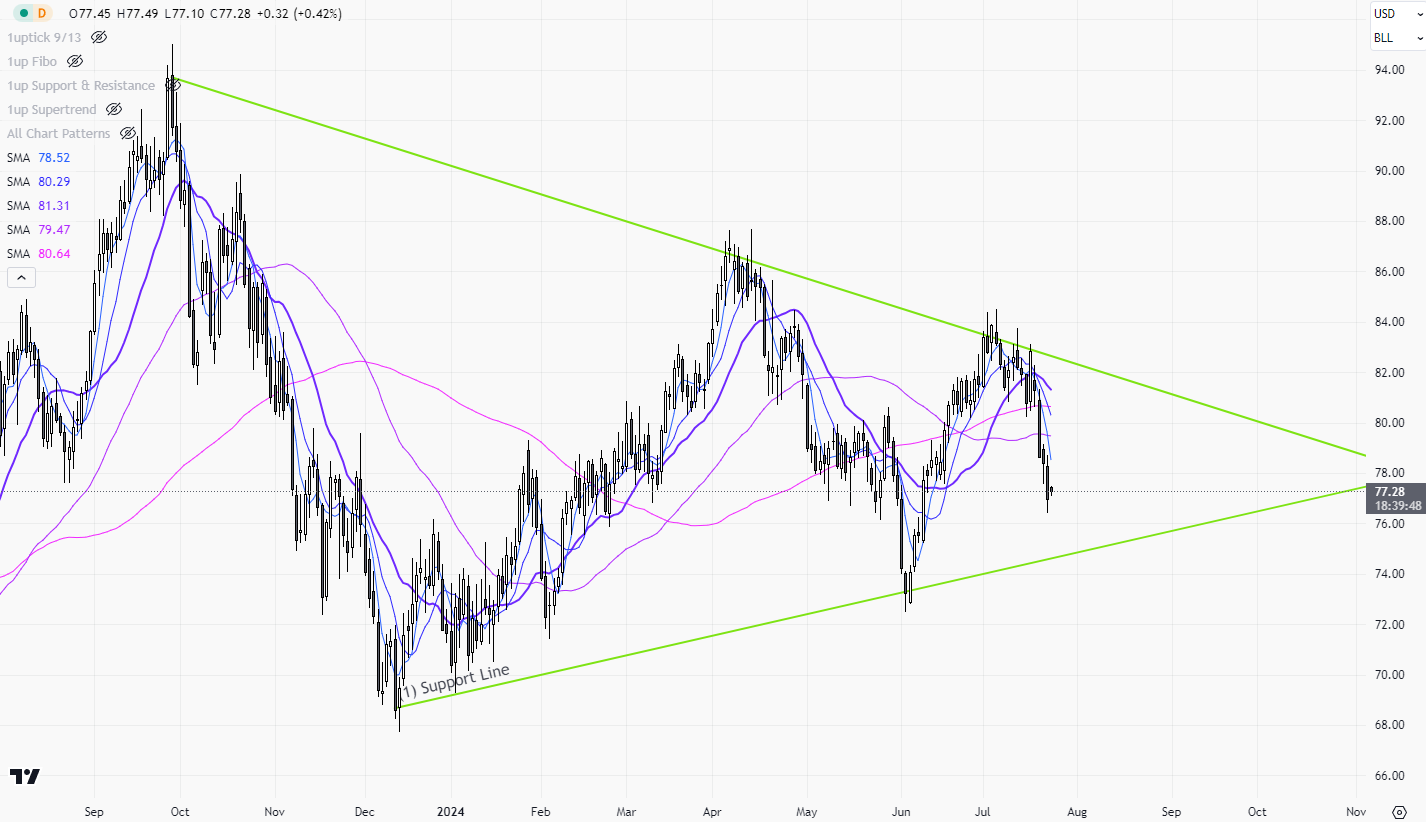
CLc1 Daily
???? Alerts Technical Indicator / Pattern 1. Bottom support *All alerts will sent to the Telegram Channel.
???? Alerts Technical Indicator / Pattern 1. Bottom support *All alerts will sent to the Telegram Channel.
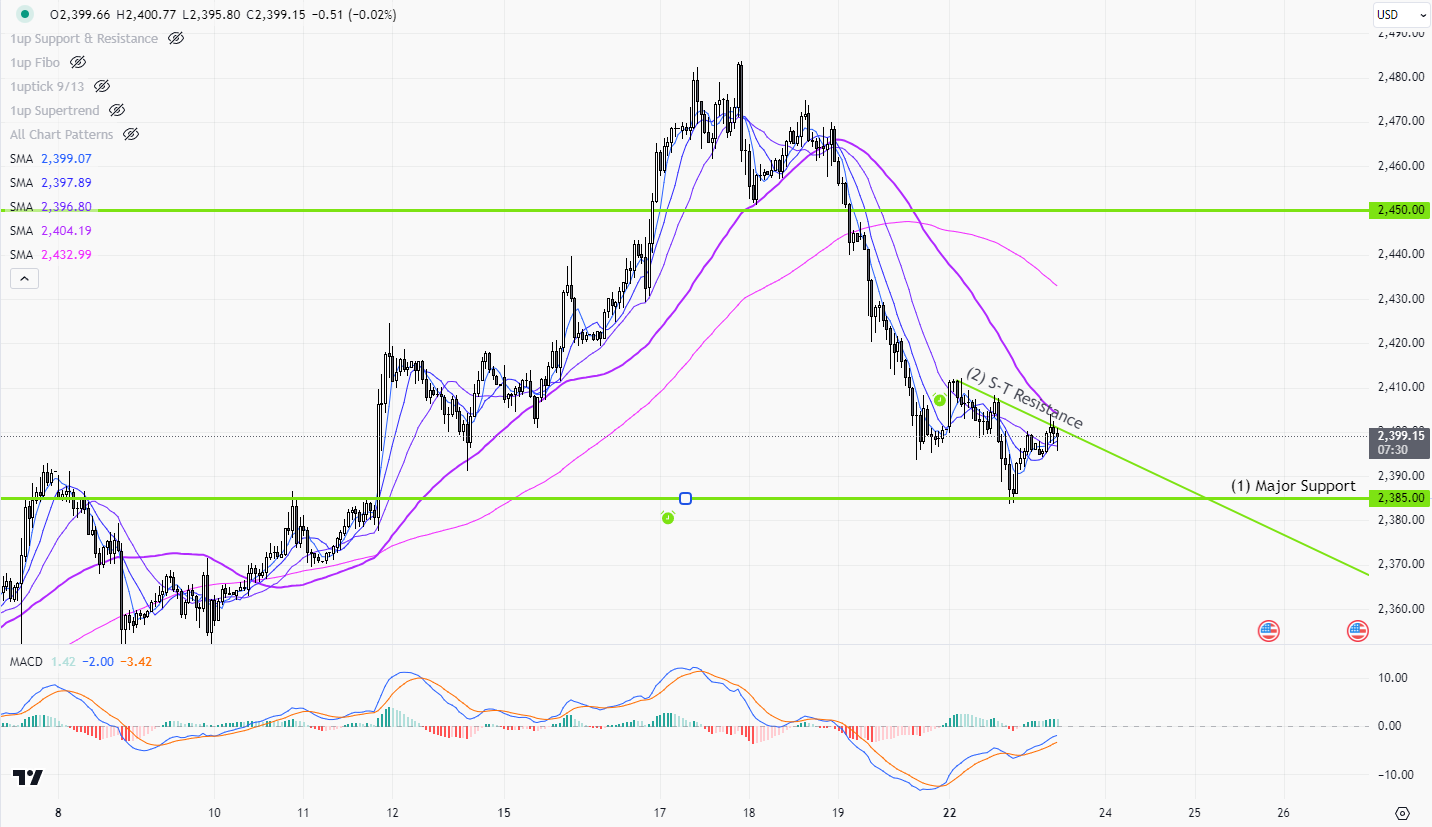
???? Alerts Technical Indicator / Pattern 1. Major Support2. S-T Resistance Line *All alerts will sent to the Telegram Channel.
Entering a consolidation cycle after gold failed to stay above 2450.
Gold price broke through the previous historical high of 2450(1) early last week on Tuesday, triggering a round of buying and rising to a weekly high of 2483 within 24 hours. However, the upward momentum failed to carry on at a high level. According to the market data from CME, gold futures showed significant new short positions entering the market on Wednesday. Short-selling accelerated after the U.S. released manufacturing data on Thursday, when the price fell below the key support of 2450(2), and the market closed near 2400 before the weekend. After the false break above 2450, it will be hard for gold to return back above 2450 in the near term without any consolidation. This week, focus on Thursday and Friday’s U.S. GDP and the core inflation data.
>
1-hr chart > Gold price supports the previous week’s low of 2390-2400. Before the next move, take advantage of the 2391-2440(3) range early this week. If the gold price breaks below 2385(4), the downside target will be 2350(5).
>
Daily chart > The decline in gold prices is accelerating, with a single-day drop of more than $40 on Friday. The short-term support is at 2400(7), and the lower target can grasp the 20-day moving average.
>
Weekly chart > Gold prices are on a L-T upward trend that originated from 2018. Last week’s peak has created a reversal signal on the chart (10). The target below can now be aimed at the bottom of the range 2300 (11).
P. To
The gold price was stimulated by the easing inflation data from the US last week, breaking through the post-non-farm resistance of 2391(2) and touching a four-week high of 2424. Referring to CME gold futures’ data, the total number of Open Interest last Friday reached the highest level of 540k contracts, which is above the 530k contracts at the time of the record high of 2450 in May, a bullish sign as more funds are now attracted by the gold market. Not many important economic figures are scheduled to be released this week. Let’s see if the price can stay above 2391 this week. The longer the price remains at around 2400, the more investors will be ready for a new high.
>
1-hr Chart > The price of gold is still running in the ascending channel (1), originating from the end of June. After breaking through the resistance (2) last Thur, the high and low in the past 48 hours have formed a side-way channel (3). Without any critical economic data this week, we can take advantage of the 2319-2425(3) range at the beginning of this week. It must be noted that a new round of selling will trigger if the price clears the support of 2391(2), and the downside target can be set around 2358-60(4).
>
Daily Chart > The range of 2277-2431(7) now dominates as the price trades above 2380. The Cup & Handle (6) pattern is yet to be confirmed. If the gold price can clear the resistance (6) in the next two weeks, a new round of M-T buying will begin.
P. To

 |
| Gold V.1.3.1 signal Telegram Channel (English) |