


DXY 1d
⚠️ 通知 日線圖 技術指標 / 形態 1 阻力 104.60 2 移動平均線 – 黃金交叉 5MA x 10MA *所有技術觸發將即時發送到 Telegram 頻道
⚠️ 通知 日線圖 技術指標 / 形態 1 阻力 104.60 2 移動平均線 – 黃金交叉 5MA x 10MA *所有技術觸發將即時發送到 Telegram 頻道

⚠️ 通知 1小時圖 技術指標 / 形態 1 下降阻力 2 短線支持 *所有技術觸發將即時發送到 Telegram 頻道
The gold price hit our S-T target of 2750 last week, reaching a new high of 2758. However, the upward momentum failed to last, and the price couldn’t hold above 2750, dropping back to the weekly low of 2708. Towards the end of the week, the gold market once again priced in the risk premium ahead of the weekend’s geopolitical uncertainties, pushing the price back to 2750, and closing the week at 2747.
Last week, several Federal Reserve officials made comments suggesting a ‘cautious approach to rate cuts,’ which strengthened the US dollar and put pressure on gold prices. On the other hand, the market had been grappling with potential retaliatory actions from Israel against Iran for the past two weeks, which finally materialized over the weekend. The attacks were relatively restrained, focusing solely on military sites in Iran and avoiding oil and nuclear facilities. Tehran, so far, has not issued an immediate response. With no significant casualties, the geopolitical tensions eased as markets opened on Monday. The NYMEX oil, most directly affected, gapped open 4% lower, and gold prices also opened $10 lower.
A few crucial US data releases are scheduled from Tuesday to Friday this week, including consumer confidence, third-quarter GDP, core PCE inflation, non-farm payrolls, and the unemployment rate. A lot of uncertainty fills the week, but… considering most of the US economic figures released in the past few weeks have been relatively strong, we can anticipate downward pressures on gold prices prior to the outcome of these figures. As the US election enters its final stages, regardless of the outcome, there is a strong likelihood that the gap between the two candidates will narrow before election day, potentially leading to safe-haven funds flowing into the gold market to support the price, offsetting the downward pressure from strong data.
>
1-hr chart (above) > The price failed to hold above 2750 last week, causing the S-T trend to break below the upward support line (1). The upward momentum has begun to slow down, the support has shifted from the mid-week support line(2) to a slower pace(2.1) before the weekend. The key resistance zone is now sitting at last week’s high of 2750-2758 (4). If any US data falls short this week, the gold price may break above this resistance, triggering a new round of buying. However, before all those economic figures from the US, we can take advantage of the sideway range of 2710-50 (3) for S-T trading.
>
日線圖 (上圖) > 整體格局未有太大改變,關鍵阻力在 2750(5),而上升通道(6)仍然有效。
P. To

⚠️ 通知 1小時圖 技術指標 / 形態 1 移動平均線 – 黃金交叉 5MA x 10MA *所有技術觸發將即時發送到 Telegram 頻道
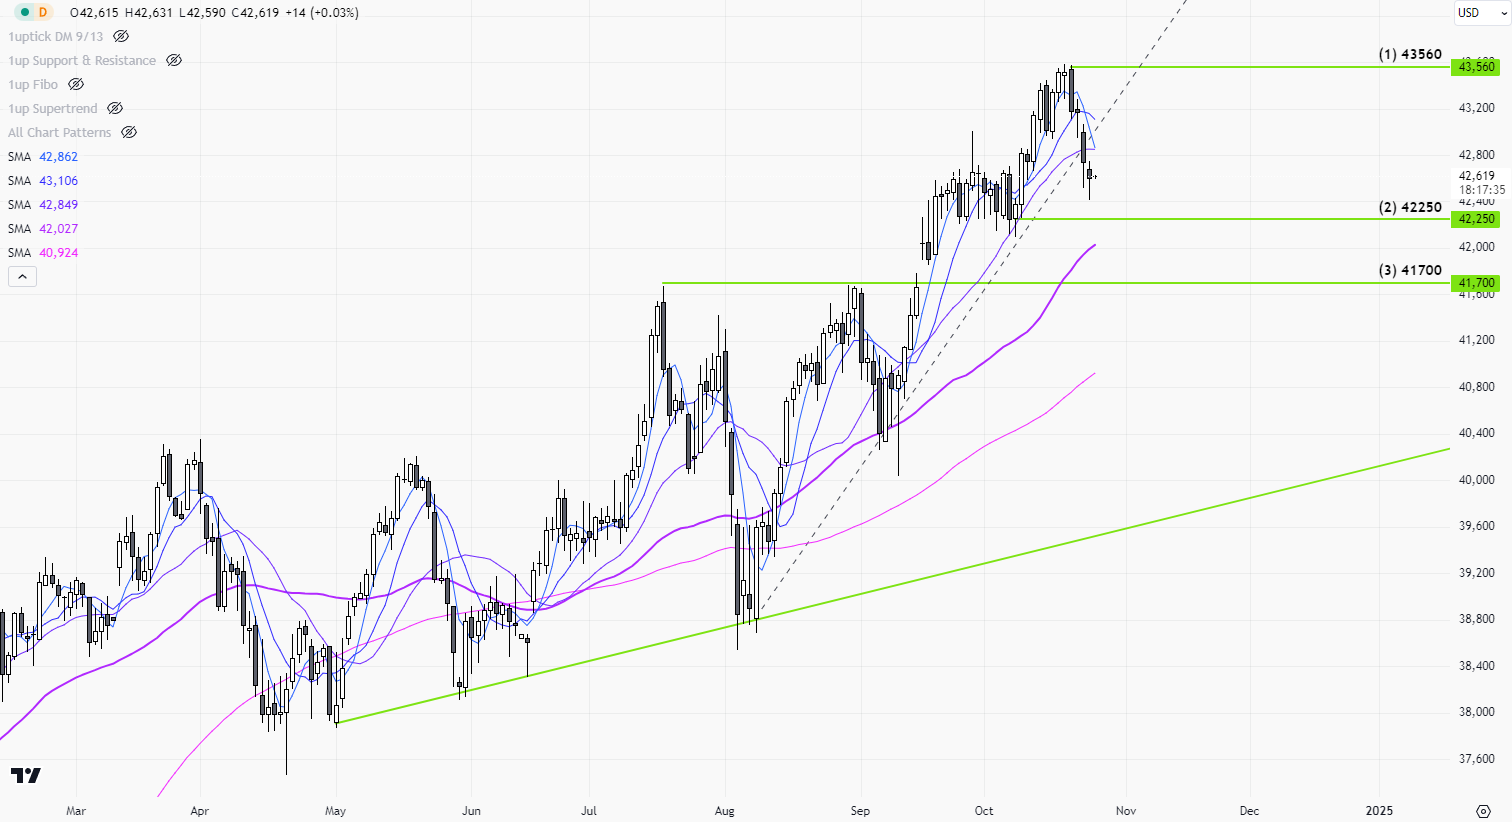
⚠️ 通知 1小時圖 技術指標 / 形態 1 阻力 43560 2 短線支持 42250 3 主要支持 41700 *所有技術觸發將即時發送到 Telegram 頻道
Gold prices exceeded our expectations last week. They broke above the previous high of 2685 without any influence from major economic data or news, closing the week at a new high of 2722 before the weekend.
Early last week, gold prices continued to carry the upward momentum from the US inflation data from the previous week, jumping to the resistance at 2670. Although it was not a major market focus, weak US manufacturing data on Tuesday led to a technical breakout of the descending resistance line(1), triggering a round of buying that quickly pushed prices to the previous historical high of 2685.
After the ECB chopped the 0.5% rate and the release of US retail data on Thursday, the gold price cleared the resistance from the previous high of 2685, where the buying momentum carried on until Friday’s market close. As the Asian session opened on Monday, funds continued to flow in, so far no clear signs of a reversal yet.
Last week, the gold market shook off the influence of the US rate cut and the recent geopolitical factors, and the overall investment market is gradually being driven by the upcoming US election and its associated uncertainties. With the current market condition, “Trump trade” or not, the gold market, US stocks market, or cryptocurrencies, will be relatively bullish before the election date.
>
1-hr chart (above) > The upward trend is still accelerating, shifting from last week’s trend line (3) to a faster pace at (3.1). With gold prices hitting new highs, there are no previous prices to use as references. In the S-T, watch out for the round number of 2750; and a 1:1 projection from the previous week’s high/low range (4), with a target around 2765 (4.1).
>
Daily Chart > Gold prices broke through the key resistance at 2685 last week (5), reigniting the upward trend. The daily chart has not shown any reversal signals yet, so in the S-T, watch for resistance around 2750 near the upper resistance of the uptrend channel(6).
P. To

 |
| Gold V.1.3.1 signal Telegram Channel (English) |