


 |
| Gold V.1.3.1 signal Telegram Channel (English) |
XAUUSD: Gold Rallies to Monthly High on Fed Rate Cut – Key Support and Resistance Levels
2025-12-12 @ 08:01
Over the past 24 to 48 hours, gold (XAUUSD) has seen a strong rally following the Federal Reserve’s rate cut announcement, reaching a one-month high with the closing price yesterday at $4,282.39. This rate decision significantly boosted gold prices as investors rushed to safe-haven assets, driving prices above the $4,300 mark.
Meanwhile, mixed signals from the Fed on future policy have led to some stabilization in the US dollar, causing gold prices to fluctuate but remain buoyant overall. Silver also performed well, breaking key levels, reflecting investor optimism in the precious metals market.
For the average investor, the Fed’s rate cut signals lower borrowing costs and potential economic slowdown, which typically encourages markets to favor safe-haven assets. Simply put, when uncertainties rise, investors turn to gold as a reliable store of value to protect wealth.

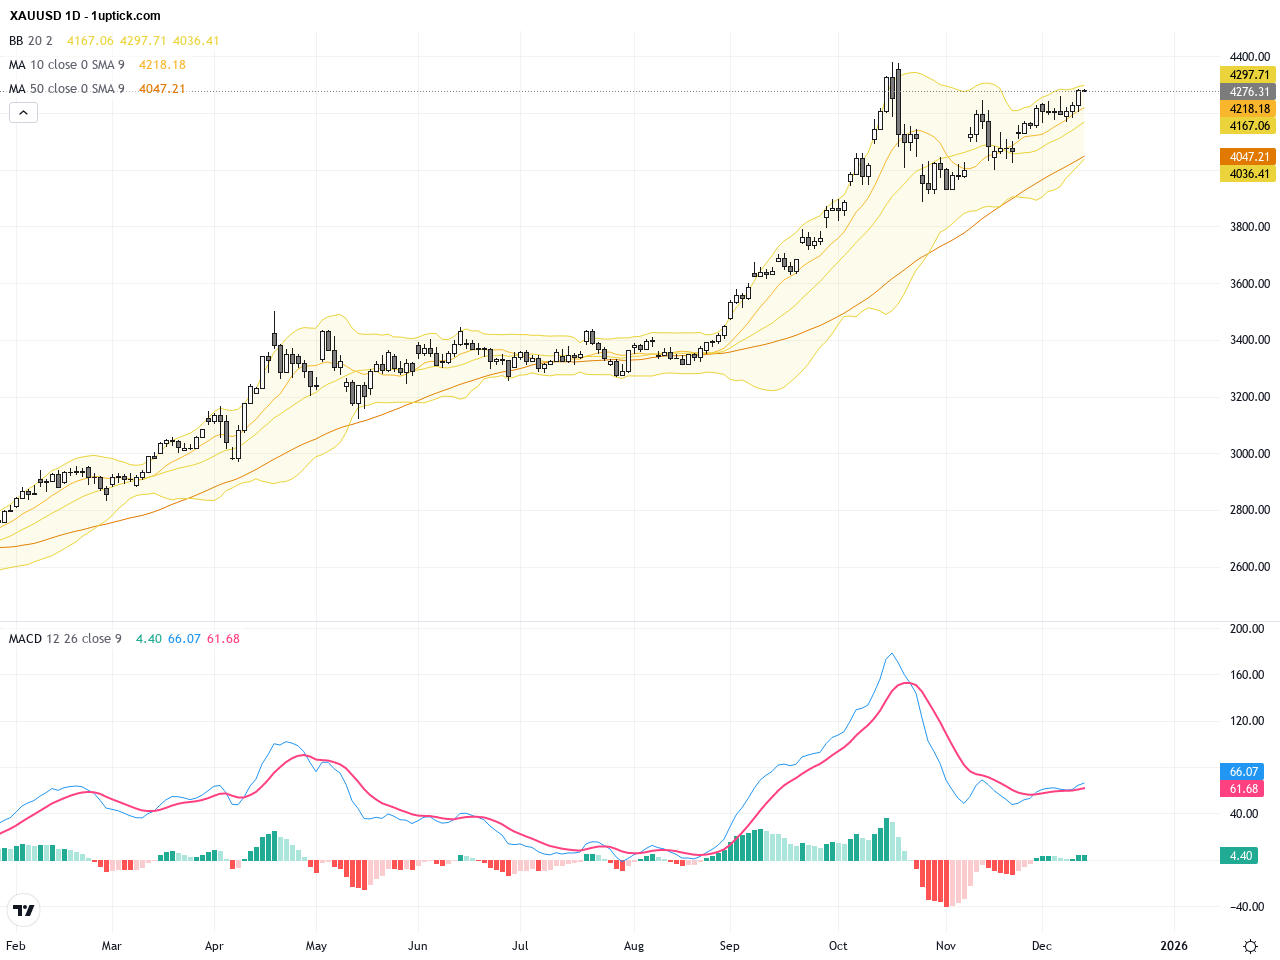
The daily chart reveals a clear bullish trend for XAUUSD, with prices steadily increasing since mid-November and breaking above key moving averages, including the 50-day and 200-day MAs, indicating strong long-term buying pressure. The Bollinger Bands are widening, signaling increased volatility and bullish momentum. The MACD shows a bullish crossover, supporting the upward move. A dominant ascending triangle pattern began to form in late November, and the recent breakout suggests further upside potential towards the next resistance levels.
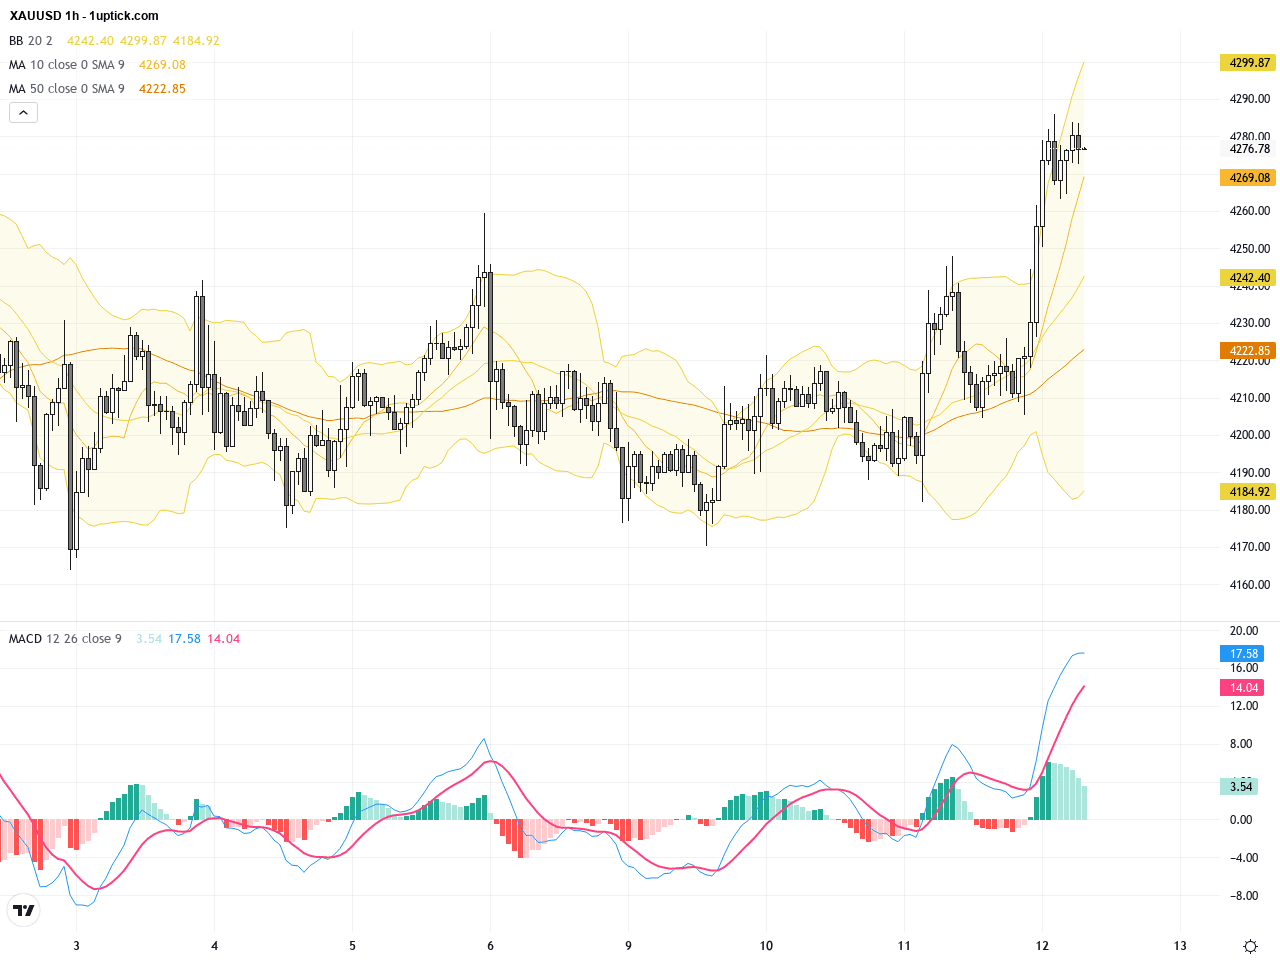
The hourly chart over the past 3-5 days shows that XAUUSD price dipped slightly before the Fed rate cut announcement but then quickly rallied to retest nearby resistance areas. Short-term 50 and 100-period moving averages are aligned bullishly, with prices trading above the middle Bollinger Band, confirming the short-term upward trend. The MACD has just crossed upwards, signaling buying strength in the coming sessions. Notably, a bullish engulfing candlestick pattern has formed recently, indicating a potential price increase within the next 24 hours. Traders should watch for a breakout above resistance to capitalize on the momentum.
Technical Trend: Clearly bullish trend with strong upward momentum and positive market sentiment.
Technically, XAUUSD remains in a strong bullish phase, confirmed by the breakout of an ascending triangle on the daily chart, widening Bollinger Bands, and a bullish MACD crossover. The hourly chart’s short-term moving averages and bullish engulfing candlestick suggest continuation in upward momentum in the next 24 hours. The recent Fed dovish stance has further reinforced market optimism towards gold, making it crucial to monitor price action around key levels for possible entry points.Today’s economic calendar features several European and Asian data releases, including UK’s GDP and Germany’s CPI; however, these are expected to be relatively stable and unlikely to have a major immediate impact on XAUUSD. China’s new loans and M2 money supply data will be released later and could influence market sentiment if numbers deviate from forecasts. Overall, no significant direct events today are expected to dramatically move gold prices, though traders remain attentive to global economic indicators for strategic adjustments.
Resistance & Support

The above financial market data, quotes, charts, statistics, exchange rates, news, research, analysis, buy or sell ratings, financial education, and other information are for reference only. Before making any trades based on this information, you should consult independent professional advice to verify pricing data or obtain more detailed market information. 1uptick.com should not be regarded as soliciting any subscriber or visitor to execute any trade. You are solely responsible for all of your own trading decisions.