


 |
| Gold V.1.3.1 signal Telegram Channel (English) |
GBPUSD: Bearish Consolidation Below 1.3500 Signals Continued Downside Pressure
2026-03-16 @ 13:01
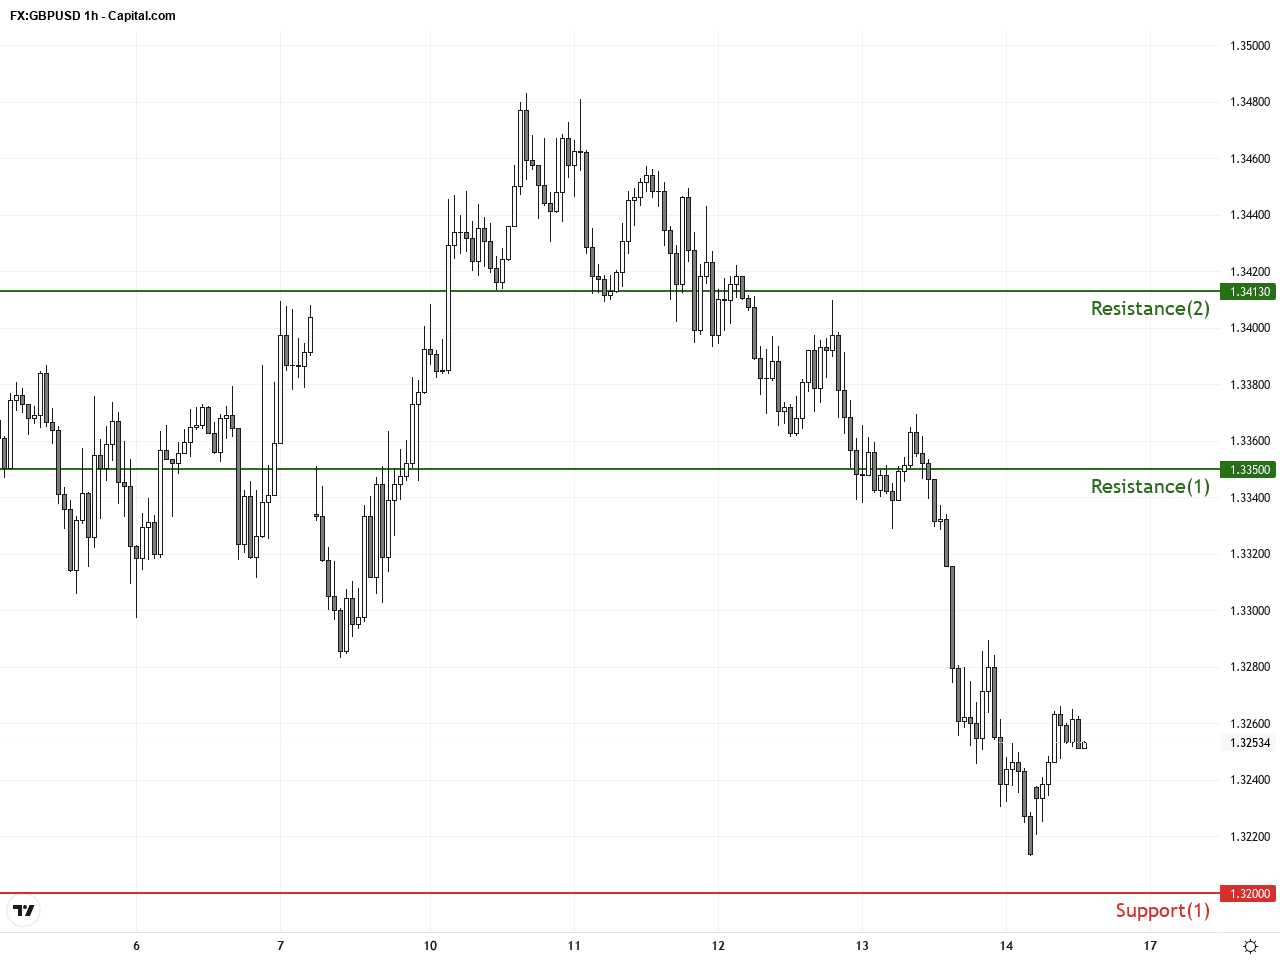
Over the past 24 to 48 hours, the GBP/USD currency pair has demonstrated notable volatility with a downward bias. The pair closed yesterday at 1.32517, slightly up from the previous day’s close of 1.32137, yet it remains firmly below the critical 200-day moving average at 1.34128. Recent market news highlights that the Pound remains bearish, trapped under the key 1.3500 resistance level, consolidating in a weak phase.
This depreciation is primarily driven by escalating conflicts in the Middle East, which have heightened safe-haven demand and pushed the US Dollar Index (DXY) toward and above the 100 mark. The surge in dollar strength is also linked to inflation worries propelled by rising energy prices, increasing expectations for Federal Reserve rate hikes. This dynamic has put additional pressure on GBP/USD. Furthermore, forecasts from major financial institutions suggest near-term dollar gains could continue, implying further downside risks for the Pound in the coming months.
For the average investor, this situation is akin to a flight to safety amid geopolitical uncertainty, with capital shifting away from the relatively riskier Pound to the safe haven of the US dollar. This flow has made the GBP/USD pair hard to stabilize in the short term, as any rallies often fail to sustain, signaling cautious market sentiment toward the Pound’s near-term prospects. Overall, investors should closely monitor developments in Middle East tensions and US economic data, as these remain the key drivers influencing GBP/USD volatility going forward.

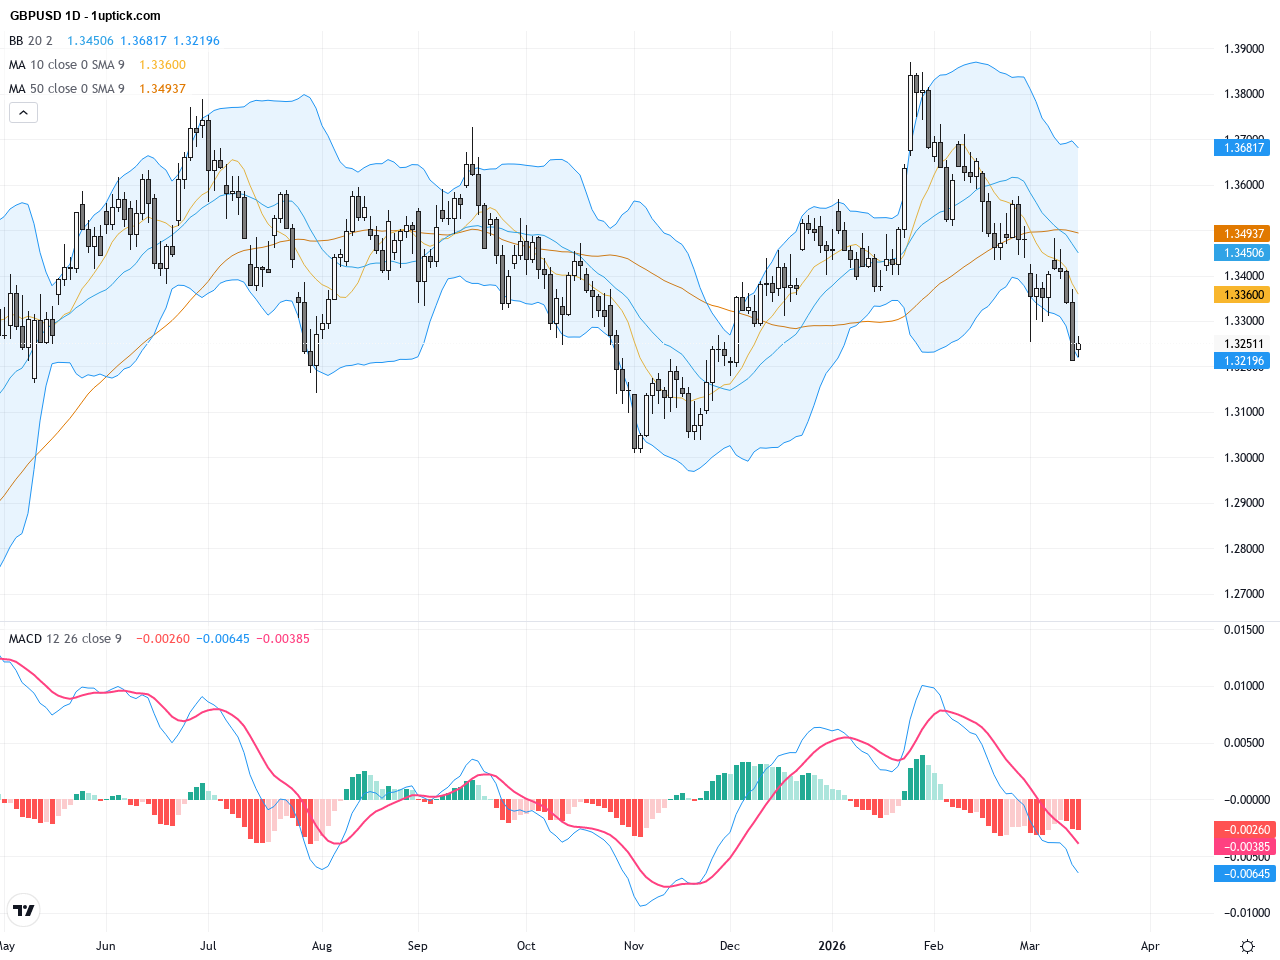
From the start of the visible daily chart, GBPUSD shows a clear downtrend, with bullish attempts failing to hold momentum. Recently, the price has been oscillating between 1.3200 and 1.3350. The pair trades decisively below the 200-day moving average (~1.34128), signaling a prevailing bearish trend. Bollinger Bands are contracting, indicating reduced volatility and a market awaiting direction. The MACD is negative and expanding, reinforcing downward pressure. Overall, the daily technical setup supports a short to medium-term bearish bias, awaiting a confirmed breakdown of support levels for trend continuation.
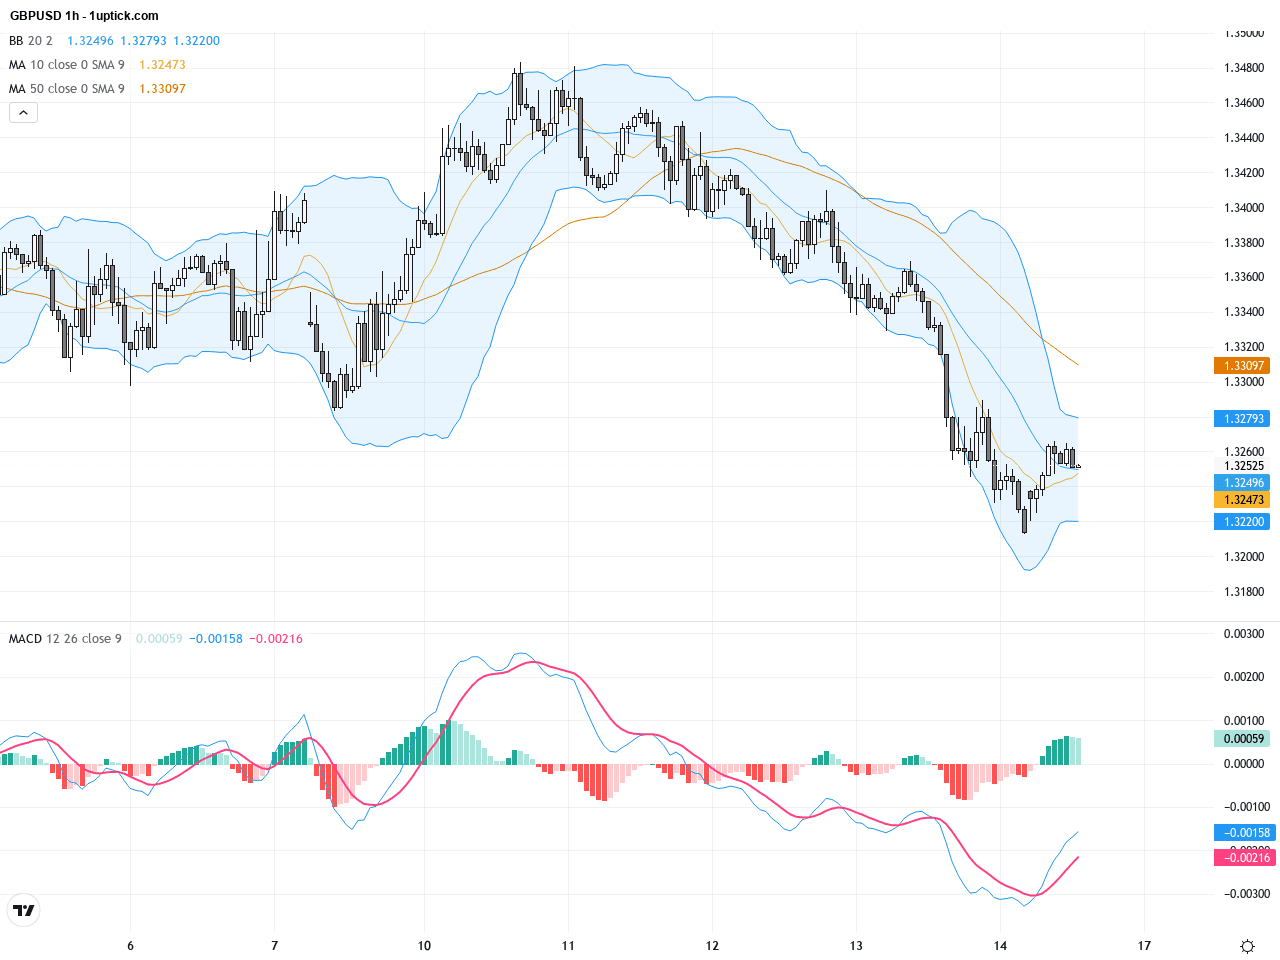
The last 3-5 days on the hourly chart reveal GBPUSD stuck in a consolidation range, repeatedly testing the 1.3300 support zone. Short-term moving averages like the 5 and 20 EMA are aligned bearishly. The MACD shows slight convergence towards the zero line, suggesting softening selling momentum but no confirmed reversal yet. The price remains capped by the middle Bollinger Band, limiting upside attempts. The critical recent candlestick is a long upper wick from yesterday, indicating sellers overwhelmed buyers after a brief rally attempt, reinforcing short-term bearish sentiment.
Technical Trend: Cautiously Bearish
Daily MACD remains decisively negative with price below the 200-day SMA, confirming ongoing bearish momentum. Hourly candlestick patterns indicate recent failed rallies and mild volume stability. Pattern-wise, a descending triangle appears to be forming, suggesting potential for further downside if the 1.3200 support breaks decisively. Traders should monitor this level closely as its breach could trigger accelerated selling pressure.Today’s economic calendar in GMT+1 does not list any major events directly impacting GBPUSD. However, key US inflation data releases at 13:30 and industrial production at 14:15 could indirectly influence the pair by affecting the US Dollar. Stronger-than-expected inflation figures might push the Dollar higher, weighing on GBPUSD, while weaker data could support a Sterling rebound. Traders should watch for these releases closely despite the absence of UK-specific data today.
Resistance & Support
The above financial market data, quotes, charts, statistics, exchange rates, news, research, analysis, buy or sell ratings, financial education, and other information are for reference only. Before making any trades based on this information, you should consult independent professional advice to verify pricing data or obtain more detailed market information. 1uptick.com should not be regarded as soliciting any subscriber or visitor to execute any trade. You are solely responsible for all of your own trading decisions.