


 |
| Gold V.1.3.1 signal Telegram Channel (English) |

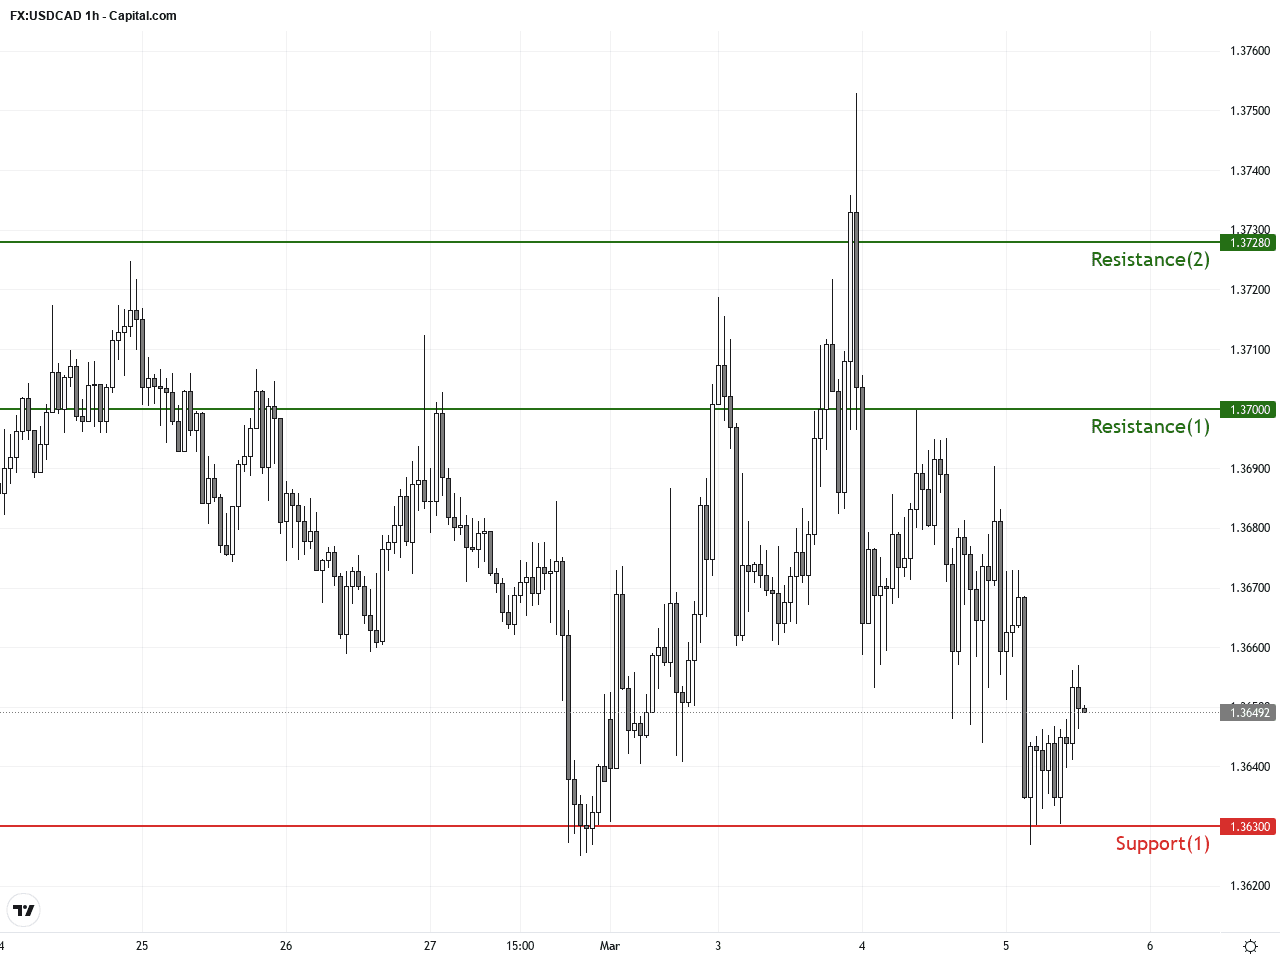
USDCAD: Oil-Driven Support Meets Key Resistance at 1.3700 Amid Dollar Strength
2026-03-05 @ 13:01
Over the past 24 to 48 hours, the US dollar against the Canadian dollar (USDCAD) showed a slight upward trend with yesterday’s closing price around 1.36498. Recently, the Canadian dollar gained strength due to rising global crude oil prices, putting brief downward pressure on the USD/CAD pair, dipping near 1.3630 during the Asian session.
The US Dollar Index this week approached the key psychological 100 level, boosting overall dollar strength. However, easing tensions in the Middle East reduced the dollar’s safe haven demand, leading to some volatility and adjustment in USDCAD. Meanwhile, the steady climb in oil prices provided positive momentum for the Canadian dollar.
For the average investor, this means the US dollar remains a dominant currency amid global economic and geopolitical developments, but the Canadian dollar benefits from favorable oil price movements. The market action reflects a tug-of-war between safe-haven demand for the dollar and commodity currency strength driven by oil, highlighting forex sensitivity to real economy factors and geopolitical risks.
In summary, USDCAD this week presents a market narrative of “dollar striving higher while the loonie pushes back on oil strength.” Volatility has increased amid risk event-driven flows, and as of 13:00 HKT on March 5, paying close attention to how traders weigh dollar demand against oil price trends will be key to forecasting short-term price direction.
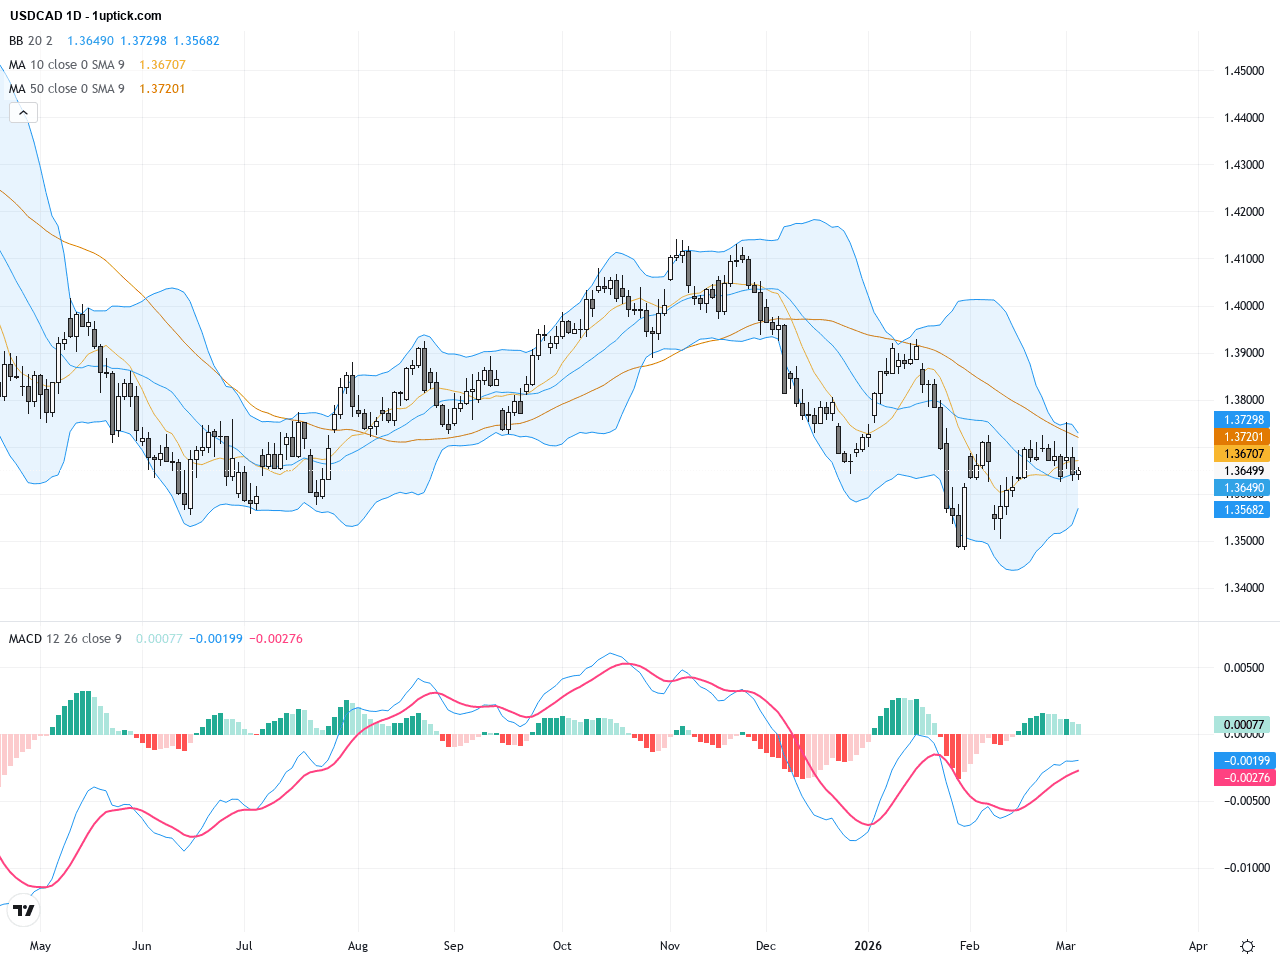
The daily chart reveals USDCAD in a consolidation phase, oscillating between 1.3500 and 1.3700 over recent weeks. The 50-day moving average (~1.37123) remains above current price, implying ongoing downward pressure, while the 200-day MA (~1.38298) remains distant, not immediately threatening. Bollinger Bands are contracting, indicating reduced volatility and a pending breakout. The MACD sits near zero line with a slight bearish tilt, suggesting weak short-term momentum and a market in cautious wait-and-see mode.
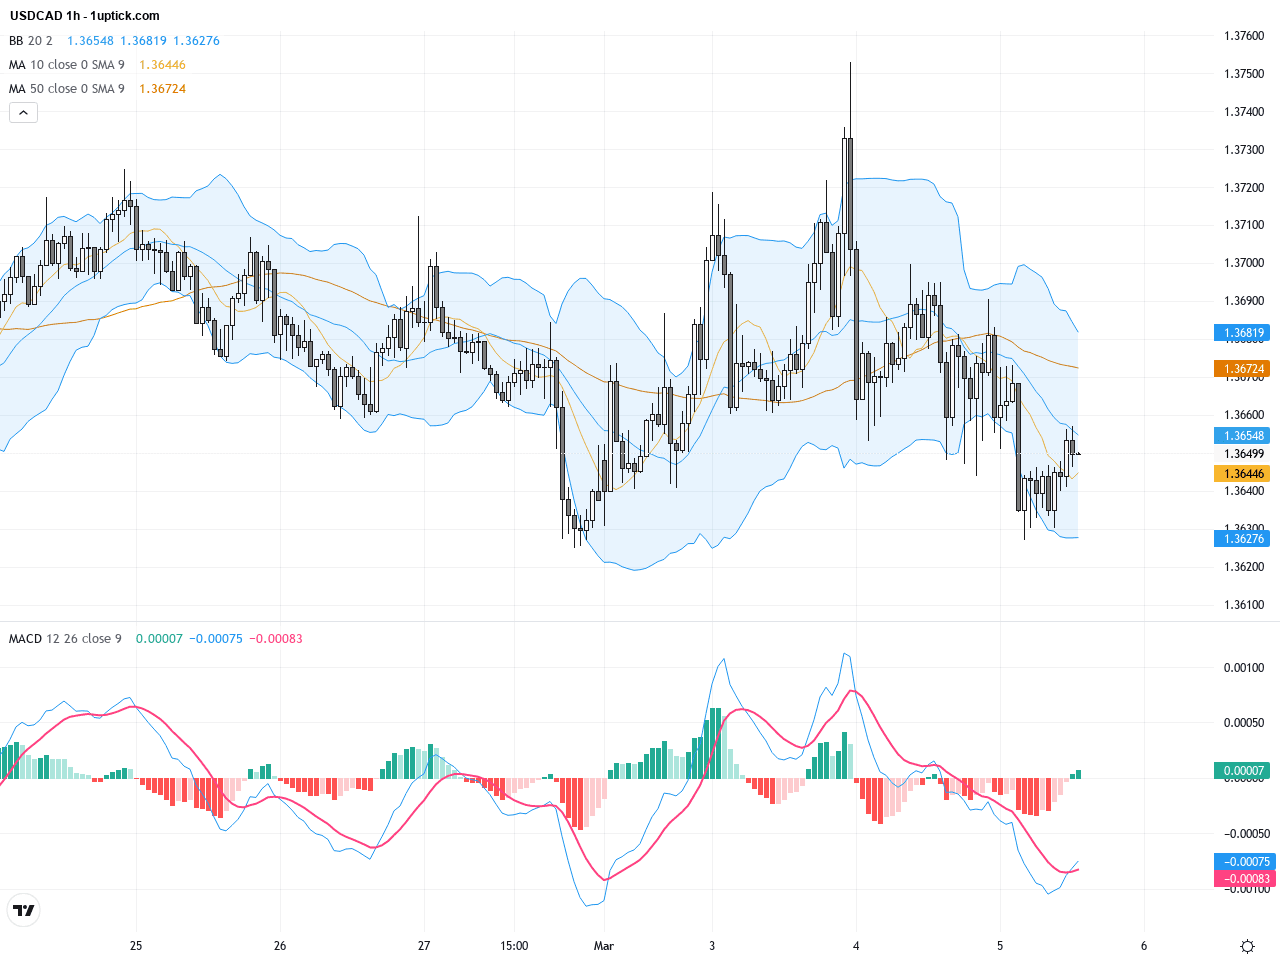
Looking at the hourly chart over the past 5 days, USDCAD trades in the 1.3600 to 1.3700 range with frequent minor bounces and pullbacks. Short-term moving averages (9 and 21-hour MAs) show multiple crossings, indicating choppy momentum. Bollinger Bands have slightly widened, signaling rising volatility, while the MACD trends upward, showing early signs of a bullish turn. A recent hammer candlestick pattern suggests a possible short-term reversal or pause in the downtrend—traders should watch the next 24 hours closely for confirmation.
Technical Trend: Currently, USDCAD is in a ‘Cautiously Sideways’ consolidation phase, with prices range-bound and waiting for a clear breakout or breakdown signal. While short-term reversal signals have emerged, the medium-term trend remains undecided pending confirmation by price action around key levels.
Technically, USDCAD shows consolidation on the daily timeframe with resistance pressure evident from moving averages and MACD oscillating near zero, signaling uncertain momentum. On the hourly chart, early signs of bullish momentum exist with MACD trending higher and a hammer candlestick implying potential short-term bottoming. The 1.3700 resistance level remains a key barrier—breaking above it could herald further upside, while failure may lead to a retest of support levels around 1.3630 and 1.3600.Today’s economic calendar (GMT+1) includes multiple releases from Europe, Australia, and the US, such as Australia’s Trade Balance and US Import Prices. For USDCAD traders, the US Import Price data and Manufacturing Productivity figures at 14:30 GMT+1 are most relevant. A better-than-expected outcome could strengthen the dollar and push USDCAD lower, whereas a weaker reading may support a rally in the pair. There are no direct Canadian economic events today, so the US data will primarily influence short-term price direction.
Resistance & Support
The above financial market data, quotes, charts, statistics, exchange rates, news, research, analysis, buy or sell ratings, financial education, and other information are for reference only. Before making any trades based on this information, you should consult independent professional advice to verify pricing data or obtain more detailed market information. 1uptick.com should not be regarded as soliciting any subscriber or visitor to execute any trade. You are solely responsible for all of your own trading decisions.